The range of filaments for FDM (Fused deposition model) printing is vast. PLA, PETG, ABS, ASA, PA, PP, TPU, etc., each type of plastic has different mechanical characteristics: more or less stiff, more or less resistant to impacts in particular. Manufacturers sometimes provide mechanical test data (in a technical data sheet or TDS). In the BASF Ultrafuse® range ( https://www.ultrafusefff.com/ ), these data are quite rich, with tests of samples printed in 3 directions: flat, on edge or upright, which gives an idea of the performance of the parts in all directions of space, including on a Z axis perpendicular to the printing layers. As the Ultrafuse® range is quite comprehensive, and mechanical tests are provided for each filament, there is a valuable data set available to provide a wide view of the mechanical properties of the main types of plastic.
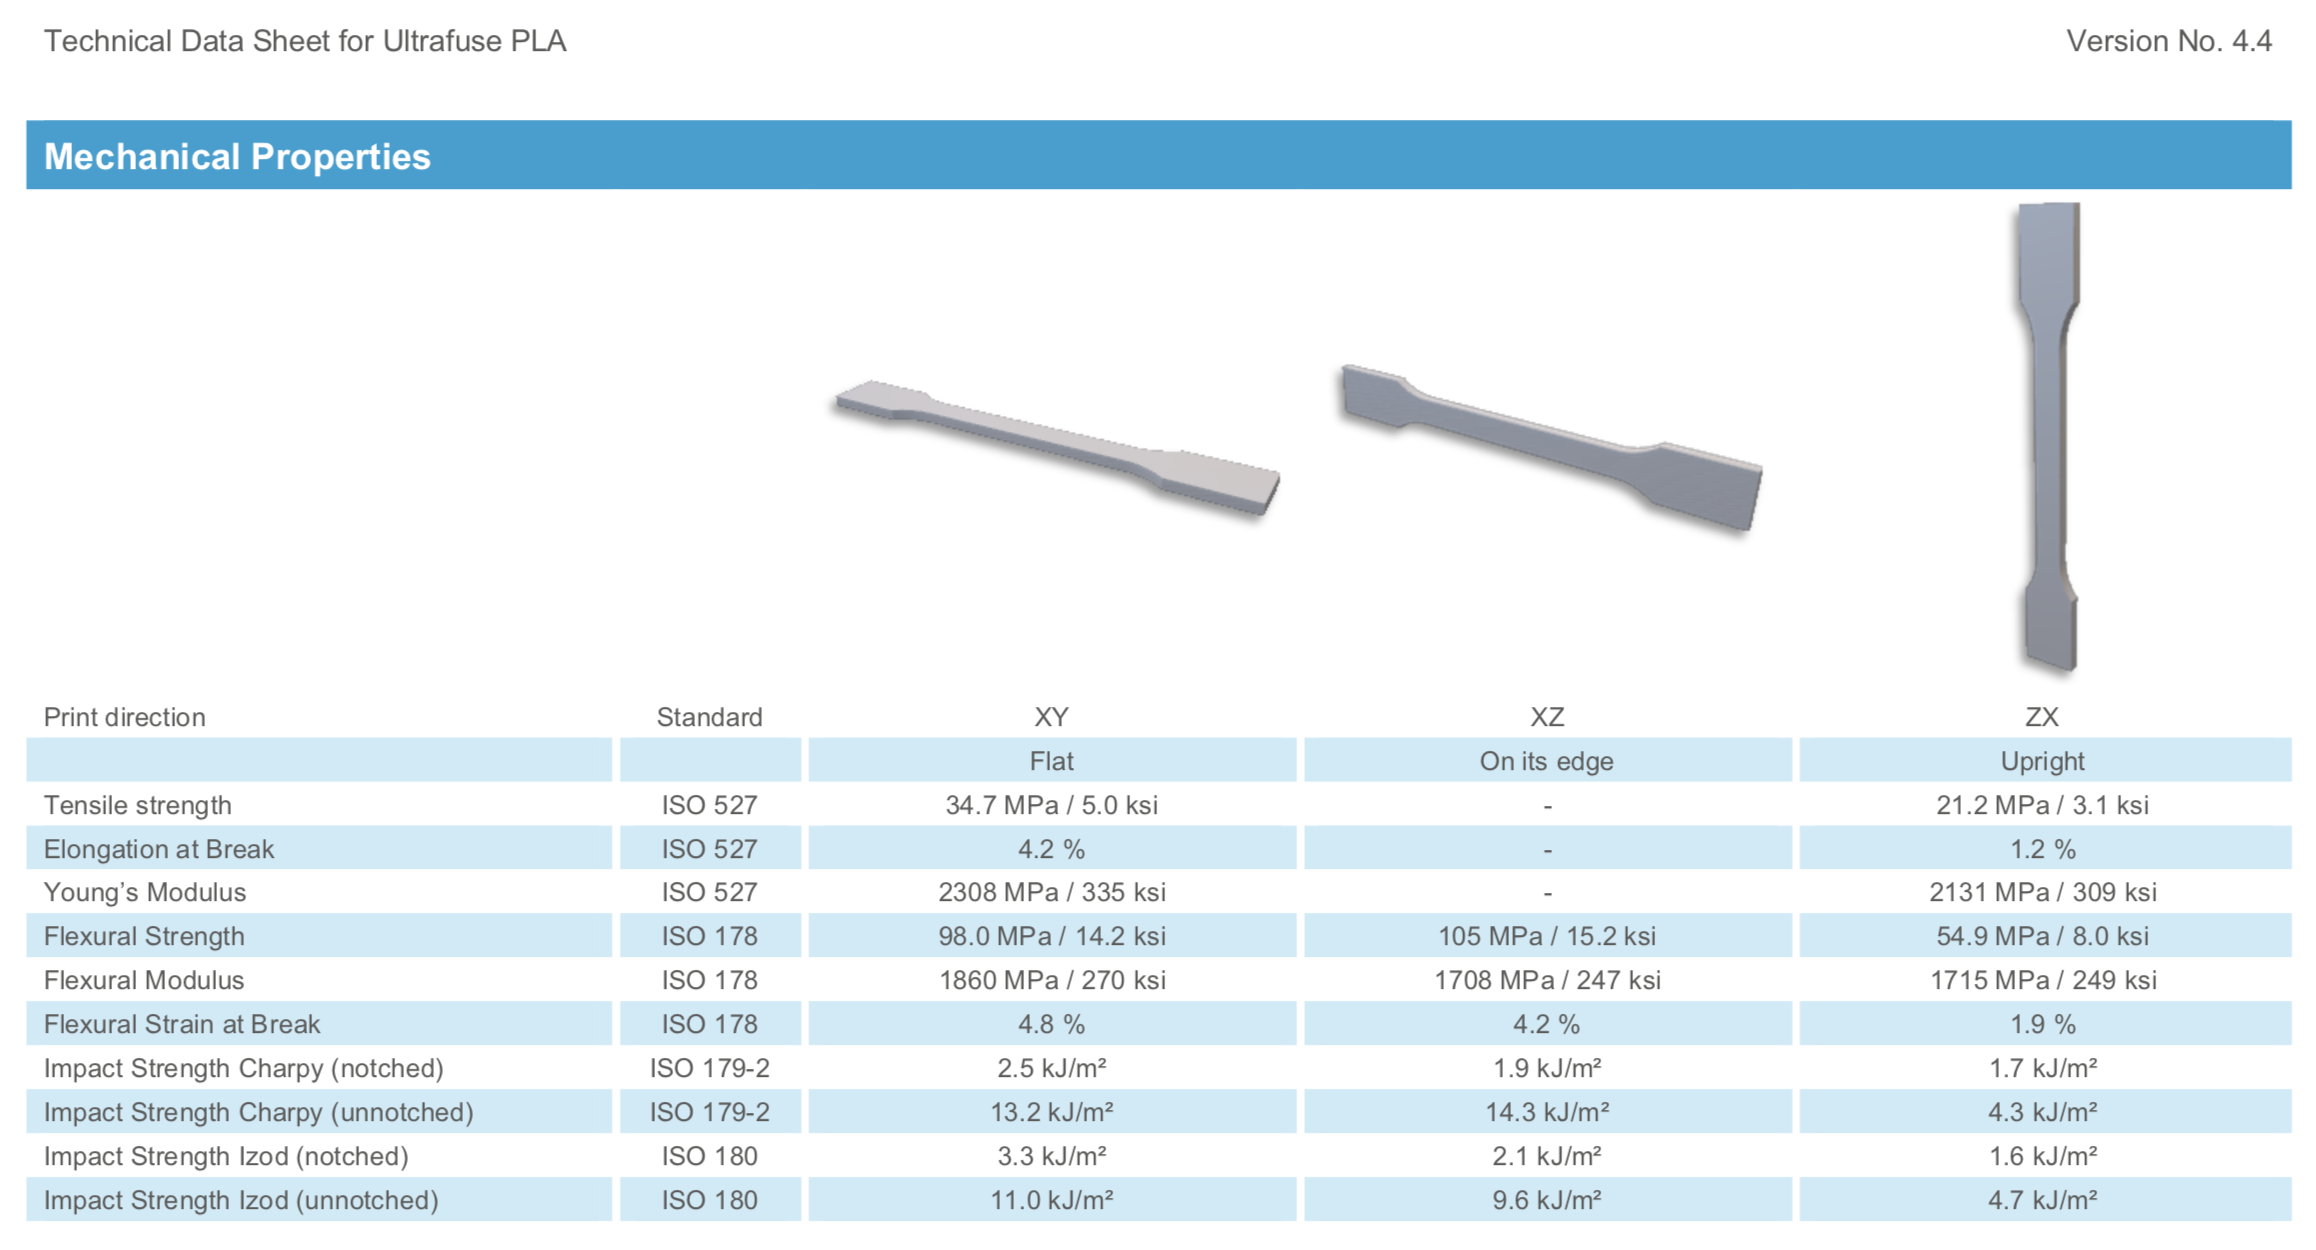
One limitation is that these raw figures are not very meaningful and difficult to compare quickly between types of plastic, and as is often the case, a graphical representation would allow a better understanding of how plastics compare to each other. This is the purpose of this article: to summarise the twenty or so data sheets available in a few graphs, to see at a glance the main differences between plastic types.
Analysed filaments:
- PLA (Polylactic acid)
- PLA PRO1 (high quality PLA)
- PET (Polyethylene terephthalate)
- rPET (recycled PET)
- ABS (Acrylonitrile butadiene styrene)
- ABS fusion+ (easy to print ABS)
- ASA (Acrylonitrile styrene acrylate)
- PP (Polypropylene)
- PA (Polyamide = Nylon)
- PC ABS FR (blend Polycarbonate + ABS + fire retardant)
- TPU 85A (Thermoplastic Polyurethane, flexible filament, shore 85A)
- TPU 95A (flexible, shore 95A)
- TPU 64D (semi-flexible, shore 64D)
- TPS 90A (rubber-like flexible SEBS, shore 90A)
Analysed fibre-filled filaments:
- PA6 GF30 (Nylon filled with 30% of glass fibres)
- PAHT CF15 (Nylon filled with 15% of carbon fibres)
- PC GF30 (Polycarbonate filled with 30% of glass fibres)
- PET CF15 (PET filled with 15% of carbon fibres)
- PP GF30 (PP filled with 30% of glass fibres)
The following Ultrafuse® filaments were not included in the mechanical analysis: BVOH and HiPS* (support filaments), PEI and PPSU (filaments to be printed above 300°C), TPC 45D (no mechanical data).
(* HiPS actually has interesting mechanical properties and will be included in a future version of this report)
The mechanical tests carried out by BASF are of three types:
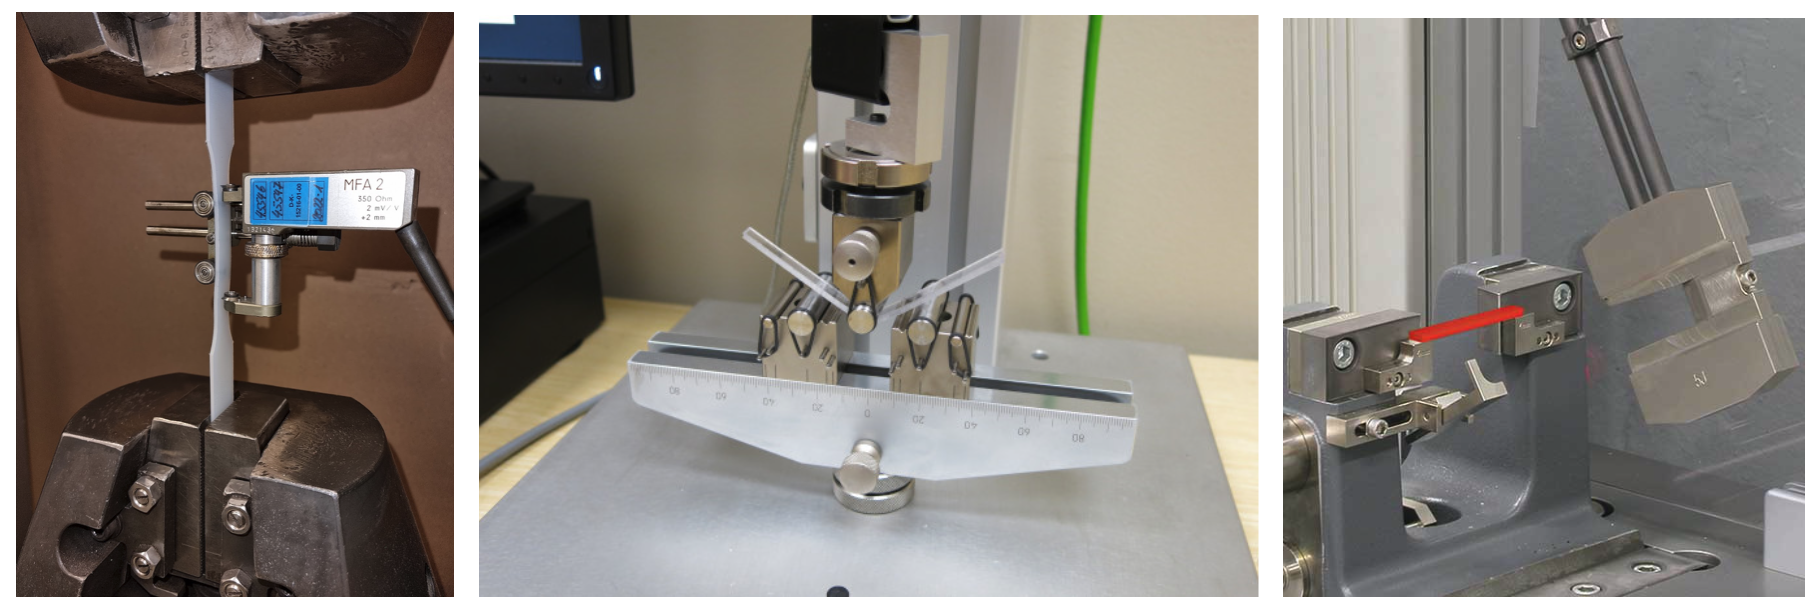
- Tension tests (ISO 527). In this test, the sample is progressively stretched between two clamps, which allows to measure its tensile stiffness, its strength (maximum supported stress), and its maximum elongation before breaking.
- Bending tests (ISO 178). In this test, the sample is progressively bent sideways, to measure its bending (or flexural) stiffness, strength (maximum stress supported) and maximum bending before breaking.
- Impact tests (ISO 179-2 and 180). For these tests, a swinging hammer is used, and the energy absorbed to break the sample is measured. BASF conducts this test using two closely related methods: Charpy and Izod, and for each using a sample with or without a notch.
Tension test: Stiffness
A first interesting mechanical property of a plastic is its stiffness, i.e. its ability not to deform when a force is applied to it. In a tension test, stiffness is measured by a variable called Young's modulus, in MPa (Megapascal). The modulus is simply the ratio of the applied pressure to the observed deformation. For example, if a weight of 200 N (~20 kg) is suspended from a rod with a cross-section of 1 cm2, and the rod elongates by 0.4%, the Young's modulus is (200 / 0.0001) / 0.004 = 500 MPa. The higher the value of Young's modulus, the stiffer the material (i.e. the less it deforms under stress).
BASF's results for tensile stiffness, for flat printed samples, are as follows:
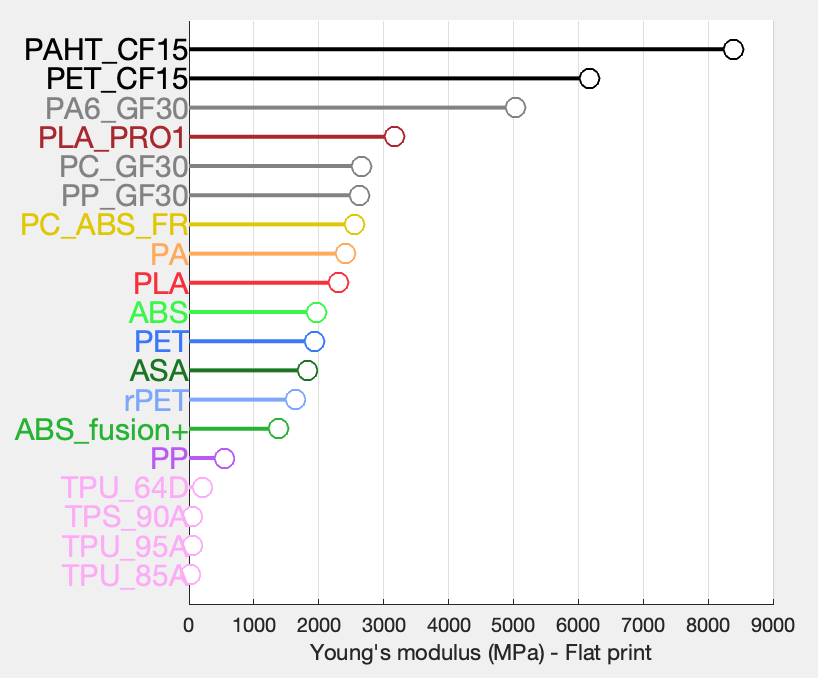
The plastics are ranked in order of increasing stiffness.
If we take PLA as an intermediate entry point, its Young's modulus is measured at about 2300 MPa.
Below PLA, there are less stiff (softer) plastics. The three filaments of the ABS family (ABS, ABS fusion+, ASA), and the two PET filaments produce parts that are slightly less stiff than PLA (modulus 1400 to 2000 MPa). PP, on the other hand, produces a much less stiff sample (500 MPa). At the very bottom of the graph, TPUs are very soft (modulus ~20 to 200 MPa, i.e. 10 to 100 times less stiff than PLA), which justifies the name Flex used for these filaments.
Above PLA, there are stiffer filaments. Nylon (PA) and PC_ABS_FR blend are slightly stiffer. PLA_PRO1 is significantly stiffer, with a modulus in excess of 3000 MPa.
The filaments producing the stiffest parts in this test are fibre-filled filaments: 5000 MPa modulus for glass-filled Nylon (PA6_GF30), 6200 MPa for carbon-filled PET (PET_CF15), and up to 8400 MPa for carbon-filled Nylon (PAHT_CF15). It should be noted that the latter requires high printing temperatures (280 to 330°C), which is why it is labelled HT.
Where the BASF data is interesting is that the same tension test was carried out on another, vertically printed sample. In other words, the tension that was previously exerted in the printing plane is now exerted perpendicular to the plastic layers, and this reduces the measured stiffness for all plastics.
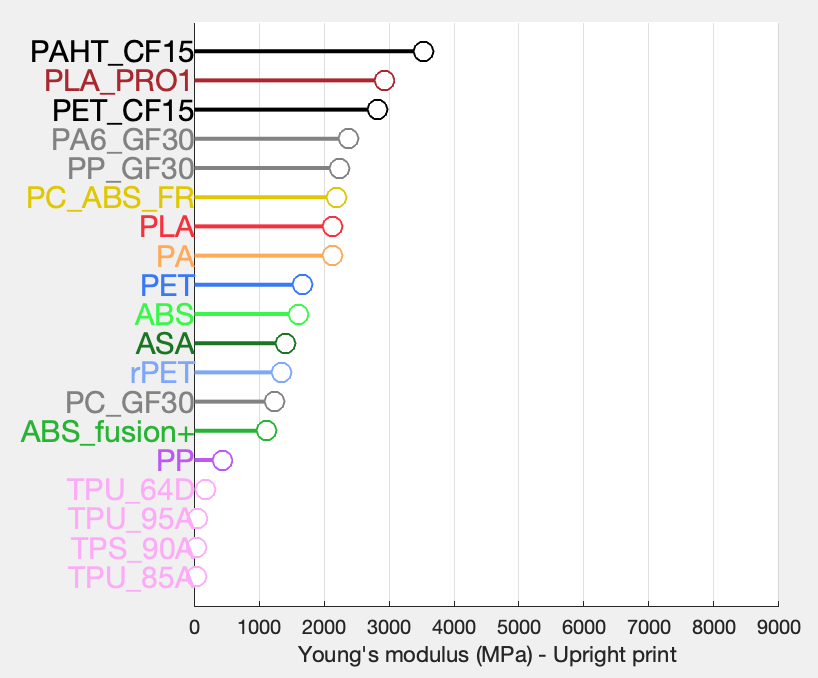
The loss of stiffness compared to flat printing is -10 to -20% for most plastics, but can be as much as -50 or -60% for fibre-filled plastics. This indicates that the addition of fibres makes the plastics very stiff when pulled in the printing plane, but the gain is much less when pulled vertically, perpendicular to the layers. These materials, whose properties vary greatly with direction, can be described as anisotropic materials. This can be an additional constraint in the design of the parts and on the orientation of the printing.
To try and summarise the two tension stiffness tests, the geometric mean of the two measured moduli can be calculated. If one is looking for good mechanical performance in the first direction AND in the second direction (i.e. more or less isotropic materials), the geometric mean, based on the product of the values, seems to me to be more suitable than the usual arithmetic mean, based on a sum. With the geometric mean, a plastic that performs very well on one axis but very poorly on another will be strongly disadvantaged.
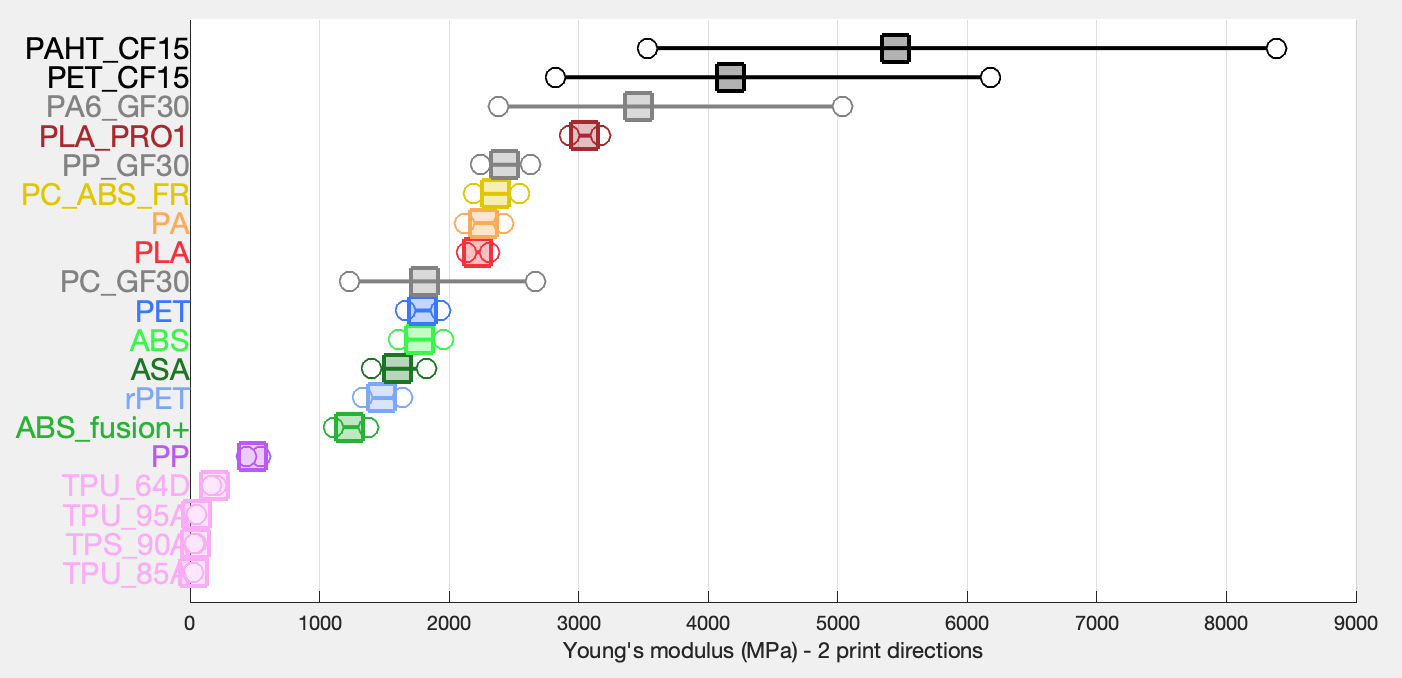
This graph therefore summarises the tensile stiffness for the two printing directions tested. For each plastic, the circles show the two measured Young's modulus values, and the square shows the geometric mean. The plastics are ranked by increasing geometric mean. By the way, it can be seen that most conventional plastics (PLA, ABS, PET, PA) are relatively isotropic for stiffness (clustered circles), whereas most fibre-filled plastics are anisotropic (distant circles).
Tension test: maximum elongation and stress
BASF gives two further measurements made in the tension test. The maximum elongation is interesting to see:
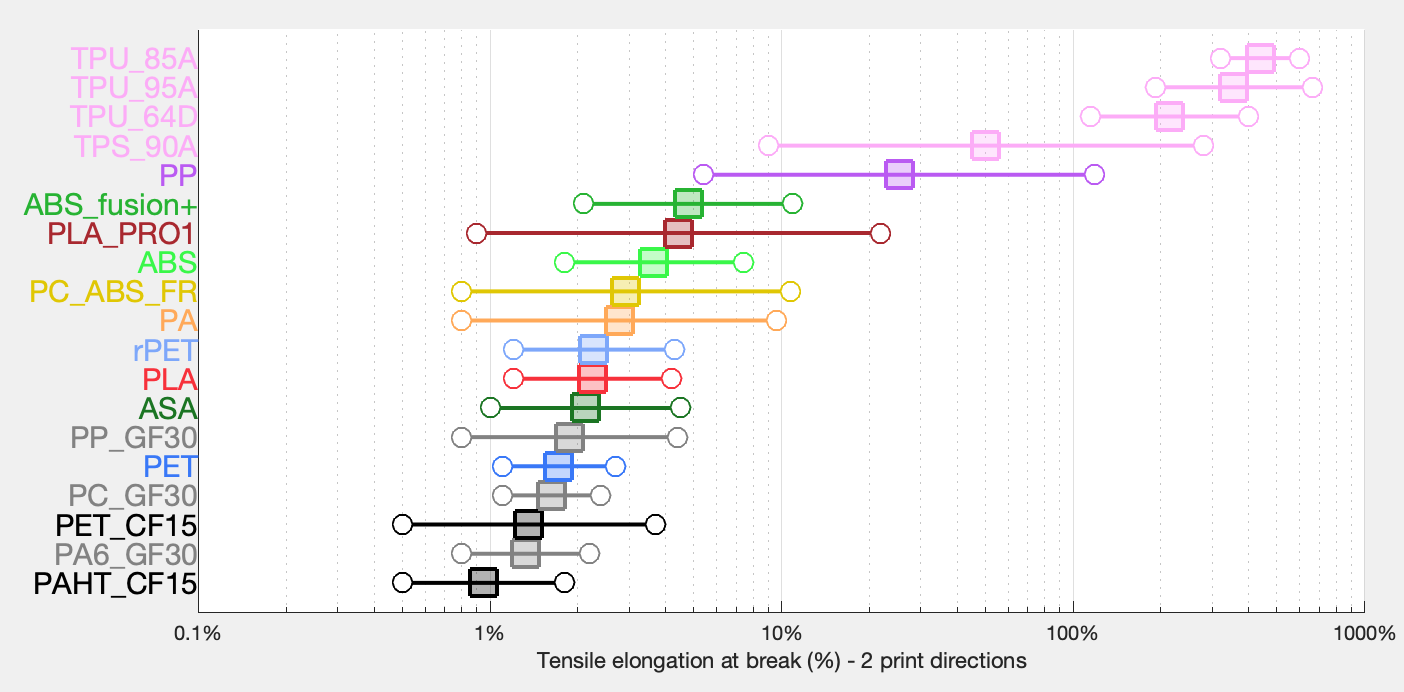
There are large differences between the elongation capacities of plastics, so a logarithmic scale has been used here. As before, the circle on the left represents the elongation of the vertically printed sample, the circle on the right the elongation of the flat printed sample, and the square the geometric mean (n.b. which in log scale is halfway between the two values).
Most samples can elongate between 1 and 10% before breaking, all with marked anisotropy, which greatly reduces the elongation supported in the vertical direction.
PP has a high elongation of >100% in the printing plane (it is 5% in the vertical direction), and TPUs can go well beyond 100% elongation, sometimes in both directions.
In contrast, some fibre-filled plastics break very early. PAHT_CF15, for example, can only withstand 1.8% elongation in the printing plane, and 0.5% vertically. These materials are very stiff, but very brittle when subjected to high stresses.
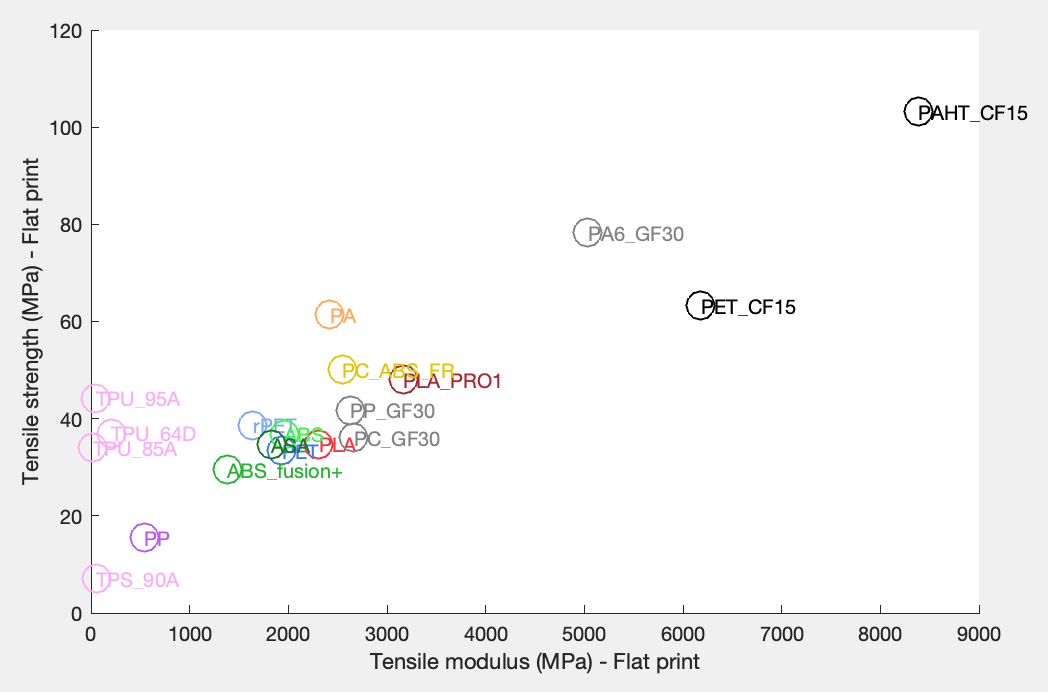
Ultimate tensile strength, i.e. the maximum supported stress before failure, is the third property measured in the tension test. It should be remembered that in this test, the stress is applied very gradually (hence the result is sometimes called static strength), which makes this measurement less interesting than the impact resistance we will see below. This is why I do not describe static strength values in detail here. It can also be observed that static strength is quite strongly correlated with stiffness, so its contribution is quite limited. In other words, the stiffest materials are often also the strongest when the stress is applied progressively.
Bending test: Stiffness
The stiffness measured in bending is calculated differently from the tension test (I will not go into the formulas, for the curious see https://en.wikipedia.org/wiki/Three-point_flexural_test ), but the results observed are congruent with the tension stiffness results. For bending, BASF tested three printing directions: flat, on edge and upright. It should be noted that the TPUs have not been tested in bending, and that the vertical stiffness of PLA_PRO1 is missing from the data currently provided by BASF.

The stiffness in edge printing is often quite close to flat printing, and sometimes even higher (for Nylon and most fibre-filled filaments).
If we summarise the 3 printing directions in a single graph:
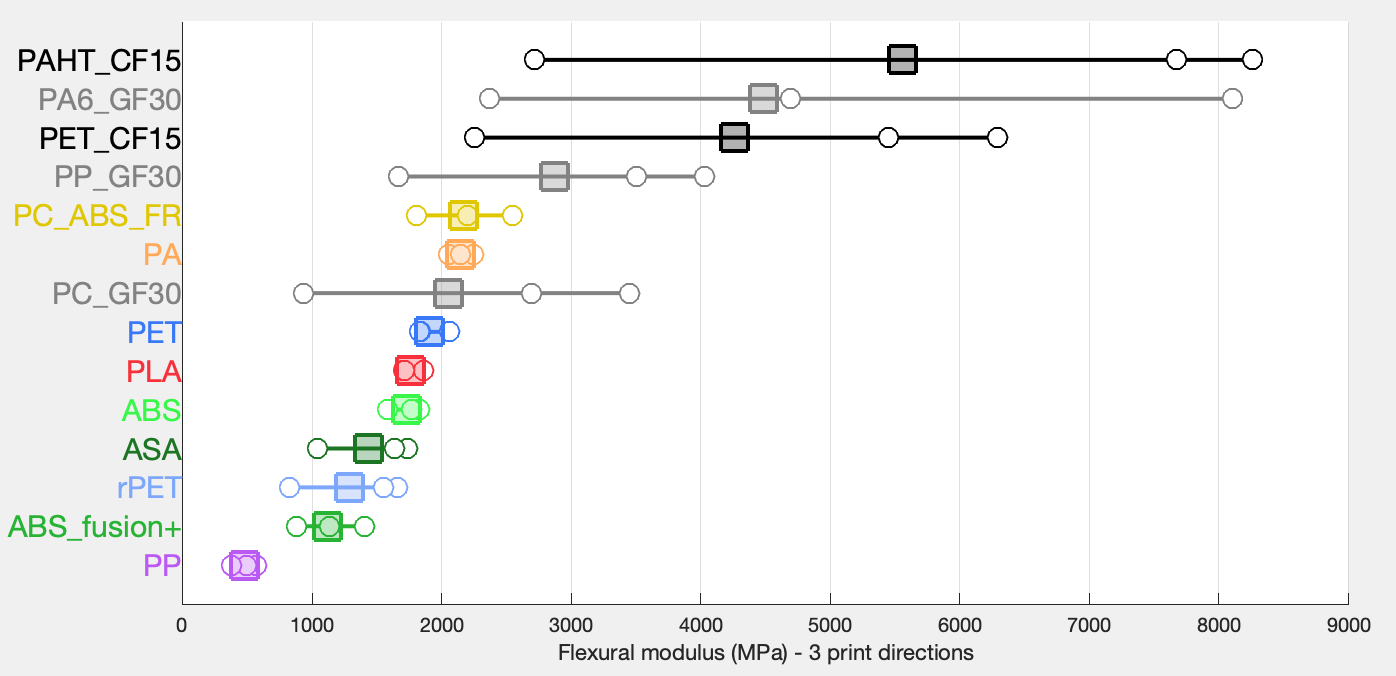
The results are broadly in line with the tension test, the ranking does not change much, but still:
- PLA is relatively less stiff in bending, falling slightly below PET, whereas it was stiffer than PET in tension.
- For conventional (unfilled) filaments, Nylon (PA) and the PC_ABS_FR blend remain the stiffest. It is a pity that PLA_PRO1 cannot be placed, as it lacks the vertical modulus value.
- Some materials have a stiffness that remains quite isotropic in bending: Nylon (PA), PET, PLA and ABS. For these, the lowest modulus is reduced by less than 15% compared to the highest modulus.
- Other plastics have a fairly marked stiffness anisotropy in bending, whereas this was not necessarily the case in tension: PC_ABS_FR, ASA, ABS fusion+, rPET and PP see their vertical modulus reduced by 30-50% compared to flat printing.
- fibre-filled filaments remain the most anisotropic, with stiffness reduced by 60 to 75% in vertical printing.
Bending test: maximum deformation
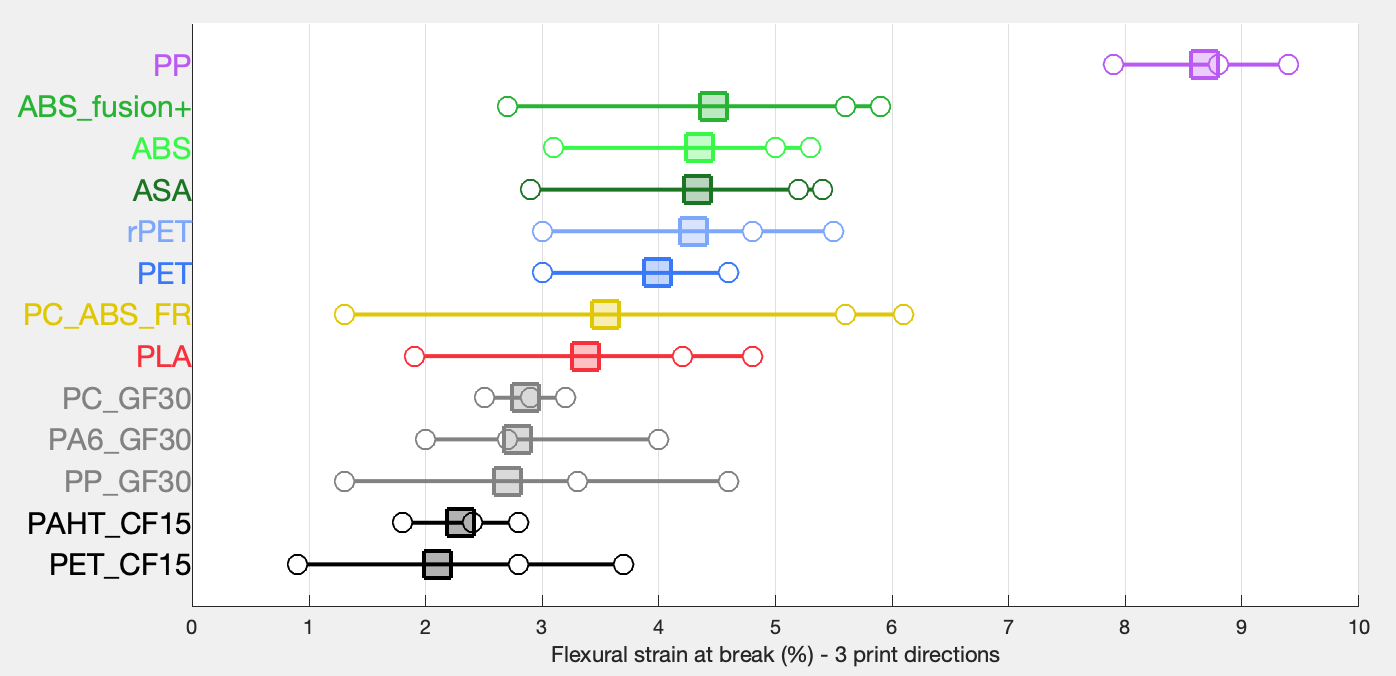
As TPUs are not tested in bending, and the results are more homogeneous than in tension, a logarithmic scale is not necessary here. N.B. Flexural strain is not a simple % elongation, but a measure of the deformation of the outer surface of the specimen when bent (see https://en.wikipedia.org/wiki/Three-point_flexural_test ).
Fibre-filled, brittle materials are found at the bottom of the graph, tolerating 2 to 3% deformation (geometric mean), followed by unfilled filaments which tolerate 3 to 5%. Note that PET and rPET tolerate more bending than PLA (this was not the case in tension). PP again stands out, tolerating more than 8% deformation before breaking. Nylon (PA) is not shown here because it did not reach fracture in this test (the sheet indicates no break in this case).
About the ultimate flexural strength, it is, as for the tension test, highly correlated to the stiffness, and I will not therefore go into further detail.
Impact resistance tests
In contrast to the previous tests, here the sample is hit with a hammer attached to a pendulum, thus applying a strong and sudden stress, which represents a fairly common scenario for everyday objects: falling to the ground, impact with another moving object etc. BASF does 4 slightly different impact tests:
- notched sample: a standard notch in the plastic sample facilitates fracture.
- unnotched sample.
- Charpy method: the plastic sample is placed horizontally, fixed at the sides and the hammer strikes in the centre.
- Izod method: the sample is placed vertically, fixed from below, and the hammer strikes above.
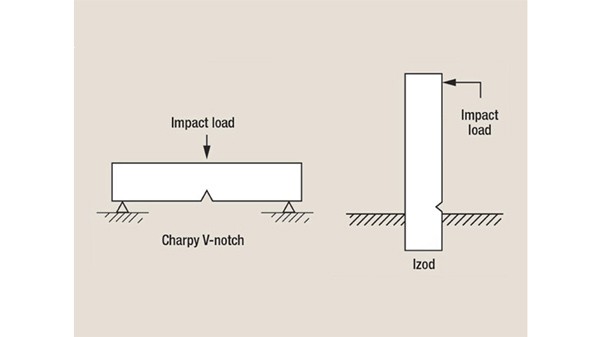
Here we will detail the results for the unnotched Charpy method, and then we will see if big differences emerge with the other 3 test variants.

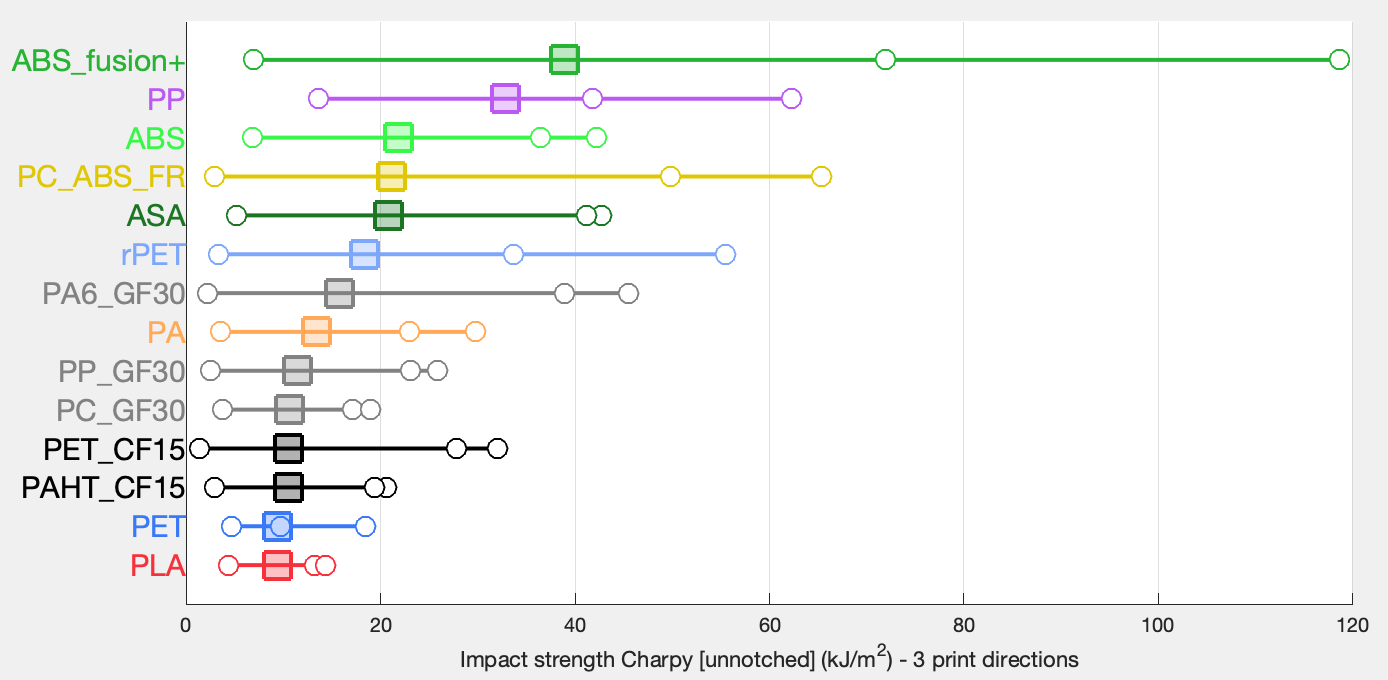
It can be seen that the ranking of plastics is different from previous tests.
- PLA and PET are at the very bottom of the ranking, with an energy absorption close to 10 kJ/m2 (geometric mean).
- Other unfilled filaments are better than PLA and PET, with an absorption between 13 and 22 kJ/m2 : Nylon (PA), rPET, ASA, PC_ABS_FR and ABS. By the way we note the surprise of a better performance of rPET compared to classic PET (rPET is recycled from industrial waste which has a specific and different composition from PET).
- Two filaments stand out for their high impact resistance: PP and ABS_fusion+, which absorb 33 and 39 kJ/m2 respectively, i.e. more than 3 to 4 times the energy that PLA can absorb. PP and ABS_fusion+ were at the bottom of the ranking for stiffness, but we are beginning to see their benefit: parts made with these filaments will not break easily.
- Fibre-filled filaments are rather in the lower part of the ranking, while being slightly stronger than PLA and PET in geometric average.
- Importantly, all plastics have a much lower resistance when printed vertically, i.e. when the impact fractures the sample between the print layers. All the plastics tested therefore produce parts that will have a high anisotropy for impact resistance. It is even noticeable that many filaments that are superior to PLA in geometric average actually have lower vertical resistance than PLA - this is the case for all fibre-filled filaments, Nylon (PA) and the PC_ABS_FR blend. Only PP and the ABS family (ABS, ABS_fusion+ and ASA) are stronger than PLA in this direction.
The ranking is relatively unaffected by the impact test variants:
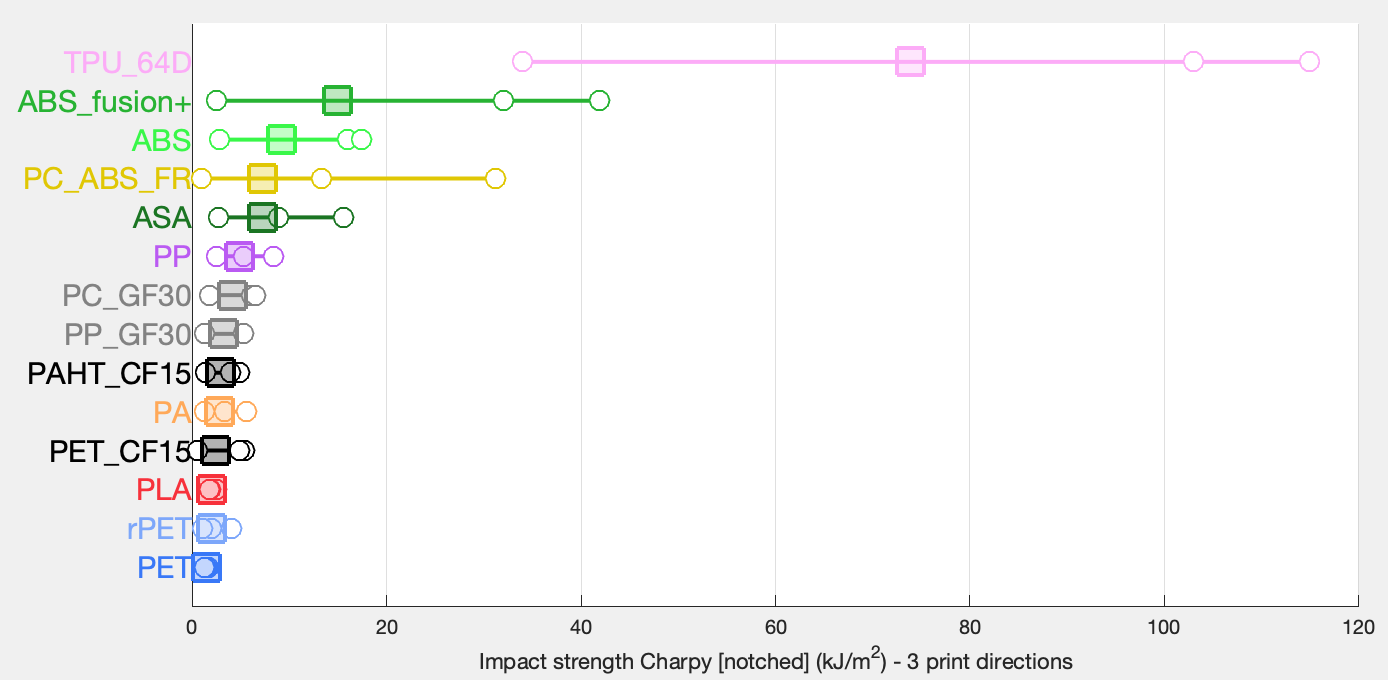
In the Charpy notched test, BASF also tested the TPUs. TPU_85A and TPU_95A were not broken by the hammer (no break in datasheet), but TPU_64D, the stiffest of the flex filaments, passed the test and came out as by far the most impact resistant.
Apart from this particular case, all filaments are much less resistant if a notch is present, but some plastics move down in the ranking, such as PP and rPET which drop several places, obviously more sensitive to notch than ABS for example.
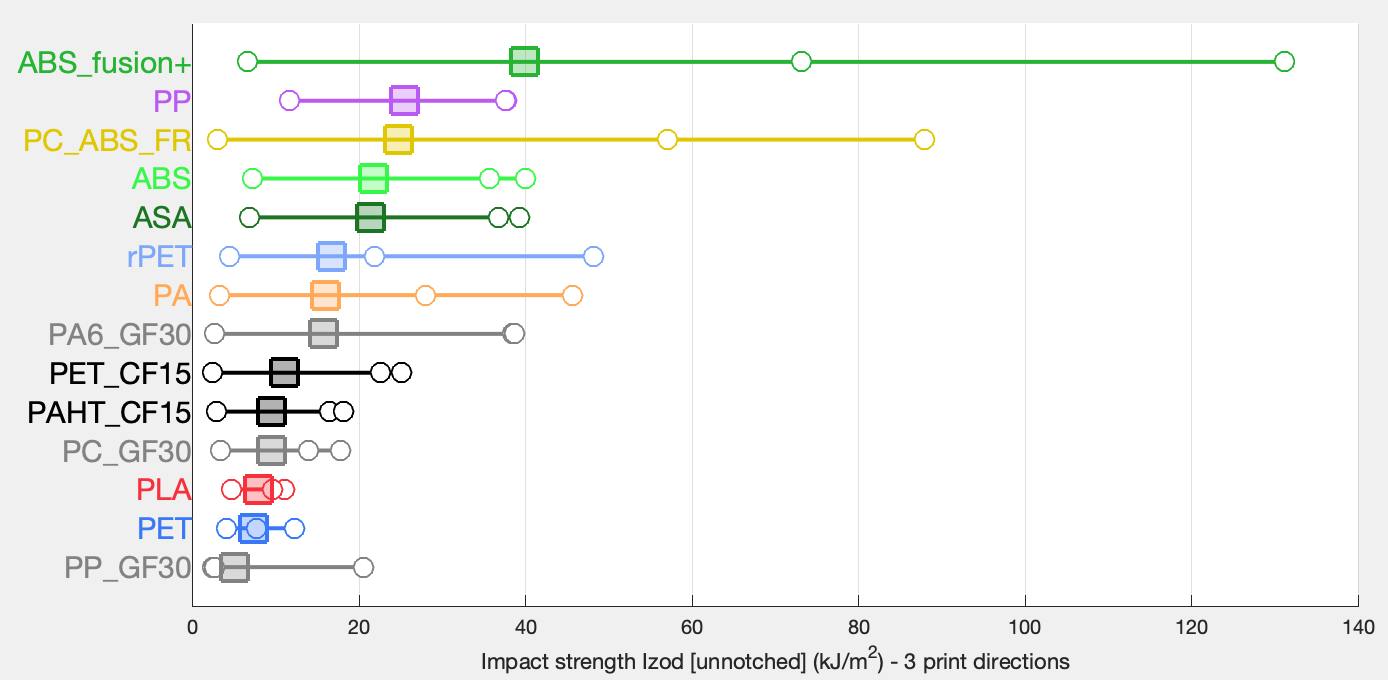
The Izod test on an unnotched sample gives very similar results to the Charpy unnotched test, with just a few differences for fibre-filled filaments, such as PP_GF30 which performs the worst here.
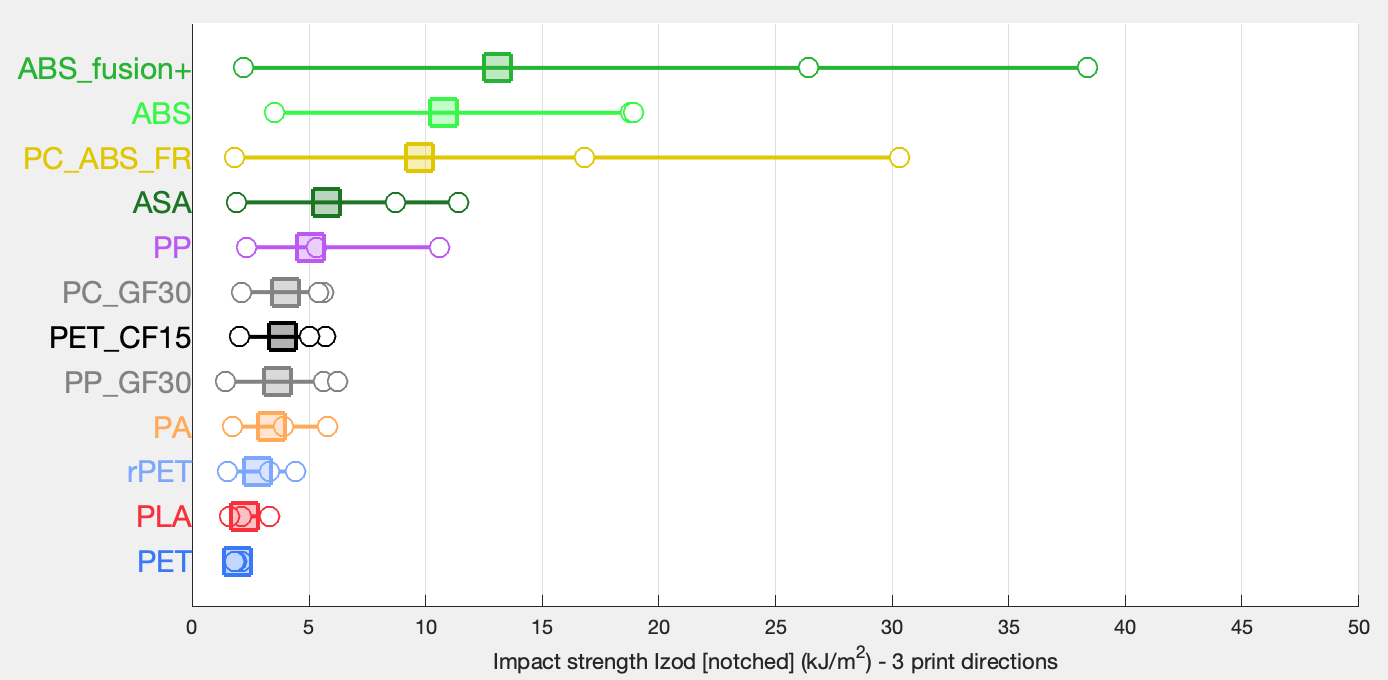
The Izod notched test does not reveal anything new, but confirms the greater sensitivity of PP and rPET to the presence of a notch: here too they lose several places in the ranking compared to the previous test.
Synthesis
Considering the more or less redundant or correlated tests, the multiple impact test variants and the 3 printing directions tested, it is not so easy to come away from this data set with a clear idea of how BASF filaments stack up.
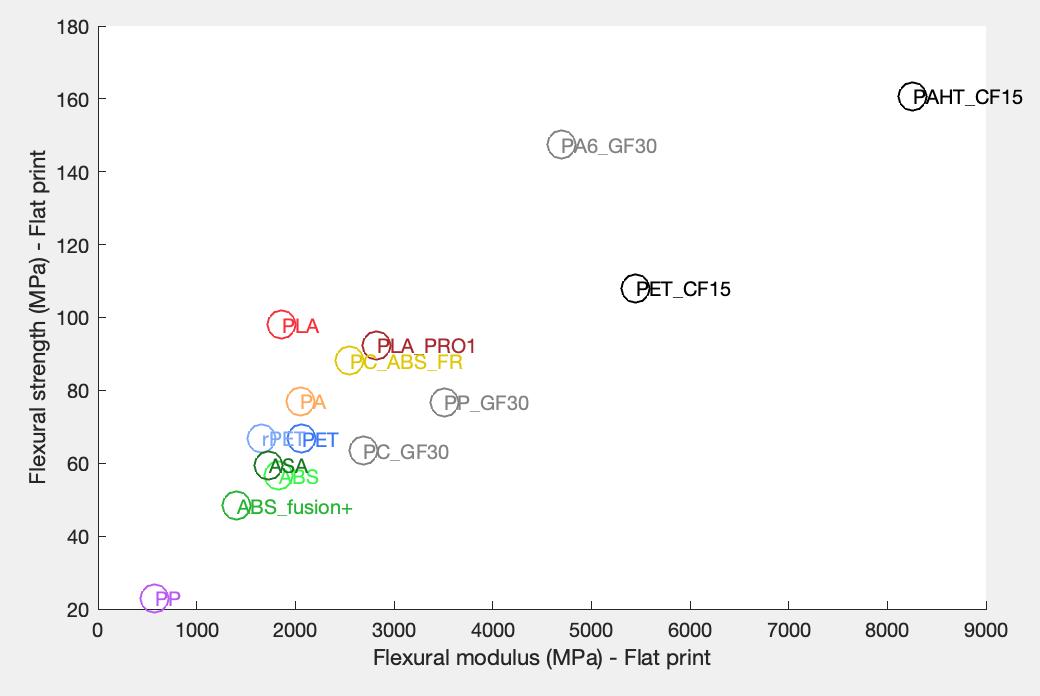
However, there are two relatively decorrelated mechanical variables that one can try to consider when choosing a filament: stiffness on the one hand, and impact resistance on the other. These two variables can be plotted on the same graph:
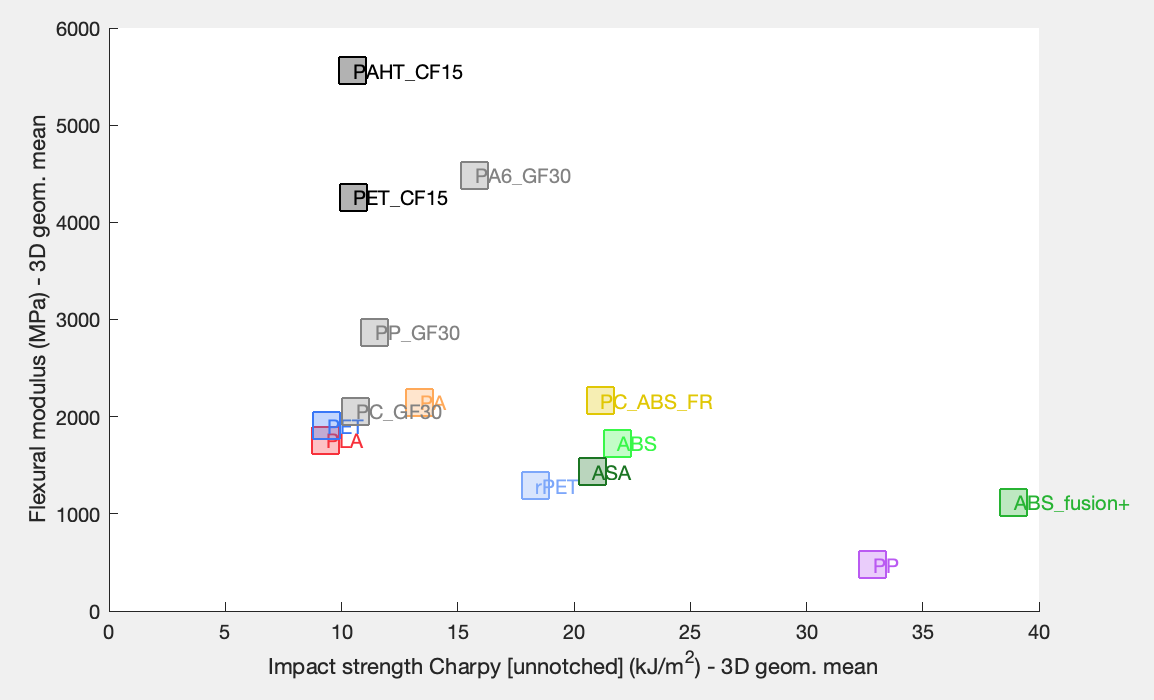
This is a graph that probably summarises the most useful data, and it is the one I would retain as a conclusion to the analysis. Vertically we have the stiffness (geometric mean of the bending tests). Horizontally we have the impact resistance (geometric mean of the Charpy unnotched test). In this 2D map, one can see at a glance where each plastic is placed in relation to the others. This is how the graph can be read:
- If you are looking for a very stiff and impact resistant plastic, it should be at the top right of the graph. This plastic does not exist. There are very stiff plastics (top left) and very impact-resistant plastics (bottom right), and we have to make a compromise between these two mechanical properties.
- You can start by looking at PLA, which is at the bottom left, in the lower performance area. PET is also there.
- If you are aiming for more stiffness than PLA, you can move up the graph to fibre-filled plastics, such as PET_CF15, which is at least twice as stiff. The gain in stiffness is real, but there is little or no gain in impact resistance (also remember that fibre-filled plastics have a lower impact resistance than PLA in the Z direction, so pay attention to the design of the part and its printing orientation).
- If you find PLA too brittle and are aiming for more impact resistance, it is better to go to the right of the graph. You can first turn to Nylon (PA) or PC_ABS_FR blend, which will be more resistant, and even a little stiffer than PLA (but as before, the Z resistance is still lower than PLA, so pay attention to the printing orientation)
- To go further in terms of impact strength, you have to turn to ABS or PP filaments, but then you lose stiffness compared to PLA - that is the trade-off. The strongest filament in this dataset is ABS_fusion+, which is 4 times more resistant than PLA, but 40% less stiff. PP is 3 times more resistant but 4 times less stiff than PLA. It should be noted that unlike Nylon, PC_ABS_FR and fibre-filled filaments, the ABS family and PP remain more impact resistant than PLA in all printing directions.
As can be seen, the anisotropy of the printed parts complicates the analysis somewhat, and the above graph - based on geometric averages - has its limitations. It can be completed by returning to the previous graphs where the anisotropy in stiffness and especially in impact resistance was clearly shown.
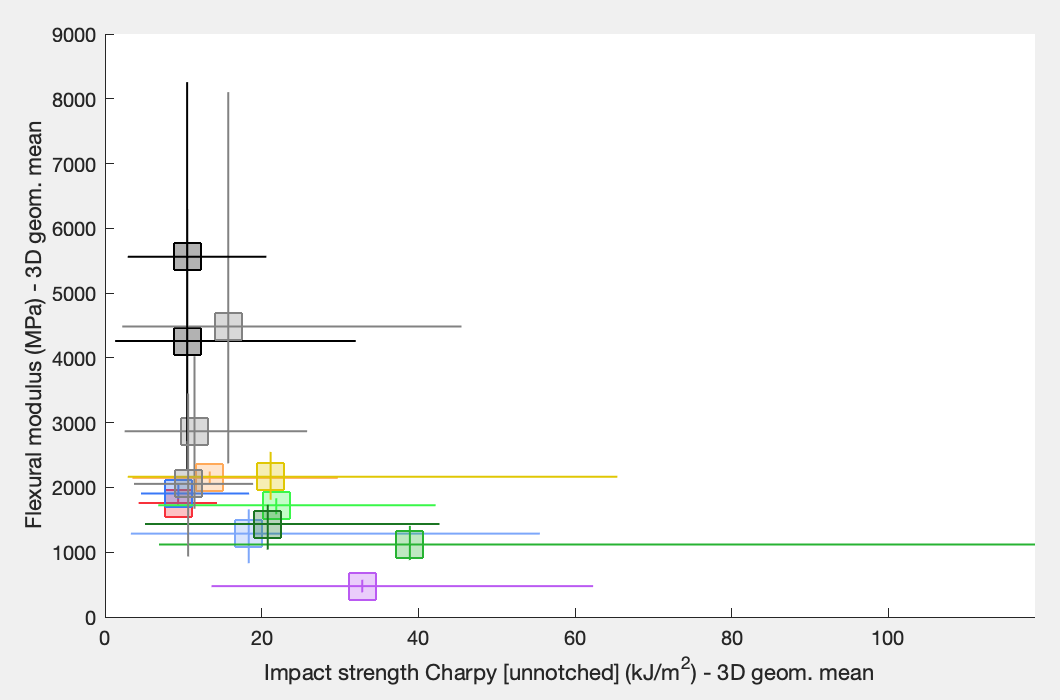
One can also try to make a graph including not only the geometric means, but also the minimum (Z axis) and maximum values, unfortunately the result loses readability:
Another more "pessimistic" approach is to include only mechanical properties for parts printed in vertical orientation:
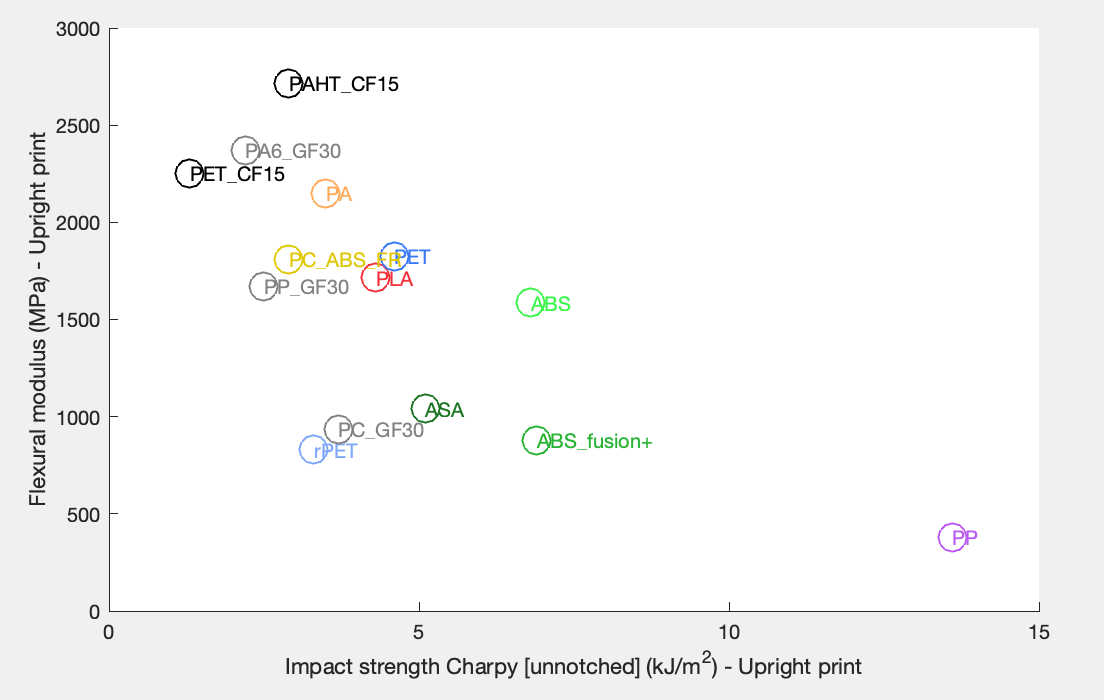
It is clear from this variant of the graph that filaments stiffer than PLA are all less vertically resistant to impact. You can also see that PP stands out with its higher vertical resistance than all other plastics in the unnotched impact tests (but PP was closer to ABS in the notched tests).
Additional remarks
Fatigue. An important mechanical property that is not assessed is fatigue resistance, i.e. resistance to repeated stress and strain. The PP data sheet states that it has good fatigue resistance and the Ultrafuse® website states the same for Nylon, but no more precise quantitative data is available.
Density. Not all these plastics have the same density.
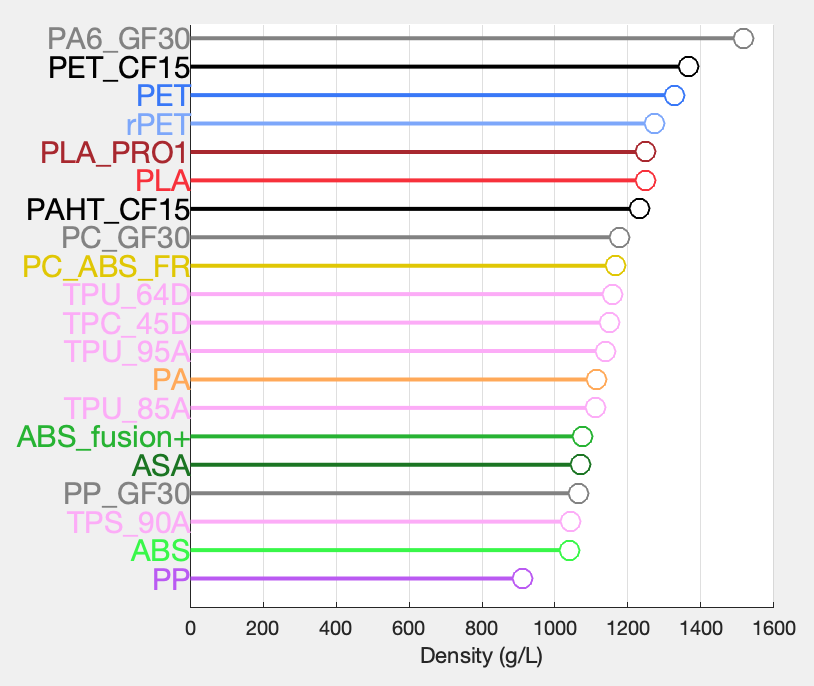
If we start with PLA at 1250 g/L, only PET and some fibre-filled plastics are a little heavier. The others (Nylon, TPU, ABS, etc.) are a little lighter. PP is the lightest, and with a density even lower than water (1000 g/L), this implies that a PP part should float, unlike other plastics. If weight is the only constraint, one can also take advantage of the low density of PP to make parts a little thicker and thus partly compensate for its low rigidity (for example, a PLA rod with a cross-section of 1 and a PP rod with a cross-section of 1.37 will have the same mass).
Price. Ultrafuse® filaments are sold in 750 g spools. By noting the prices on the website https://www.ultrafusefff.com/ on 2022-10-17 and taking into account the density of the plastics, here is the effective price per litre of plastic:
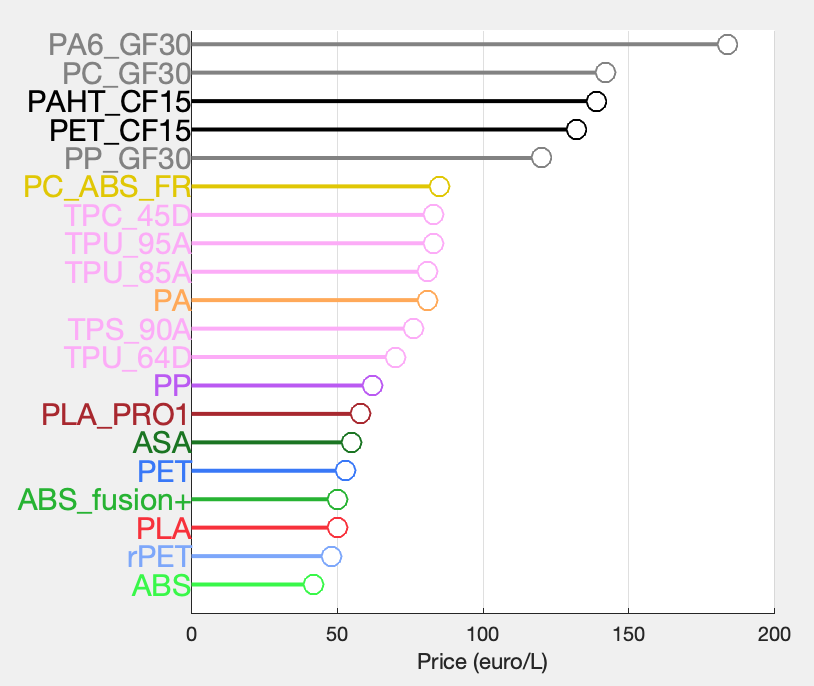
PLA, PET, ABS and PP are the entry level, between 40 and 60 €/L. TPU, Nylon (PA) and PC_ABS_FR are between 70 and 85 €/L. Fibre-filled filaments are considerably more expensive, between 120 and 185 €/L.
Ease of printing. Beyond mechanical properties and price, there are a multitude of other criteria involved in selecting a filament, not covered in this article, but which can nevertheless be decisive. For example, printability varies greatly. PLA and PET have a reputation for being fairly easy to print, but the other plastics all have their own particularities, which we cannot list here (see the BASF sheets, which give quite a lot of information on printing parameters). Let's just mention a few of the more well-known limitations:
- ABS, which prints at fairly high temperatures, is subject to warping, i.e. significant thermal shrinkage which can deform the parts and cause them to come off the printing plate. The purpose of ABS_fusion+ is to reduce this warping by adding an additional compound.
- The PP has to be printed on PP tape to adhere to the printing plate, which adds an extra step to the printing process.
- Nylon-based filaments (PA, PAHT_CF15) concentrate moisture strongly and must be dried for several hours in an oven before printing (in fact, BASF recommends drying for all its filaments except PLA and TPS_90A).
- According to BASF, all fibre-filled filaments must be printed with a nozzle of 0.6 mm diameter or more, preferably made of steel for CF filled filaments.
- Some filaments such as ABS emit more or less harmful vapours during extrusion, which may pose additional safety constraints on the workplace.
Other physical and chemical properties. Depending on the use of the printed parts, resistance to UV, fuels and solvents, and high temperatures are criteria that can be as important as mechanical properties. For example, ASA is UV resistant, and PP is resistant to a number of chemicals. Also, some materials can easily produce waterproof prints (PET, PP), and others like ASA have anti-static properties. The BASF data sheets and the Ultrafuse® website https://www.ultrafusefff.com/ are also a valuable source of information in this respect.
Ultrafuse® range and other brands. The choice of the BASF Ultrafuse® range for this report was dictated solely by the existence of a rich and relatively complete mechanical data set. In the existing BASF TDS, only missing data for TPC_45D, partial data for PLA_PRO1 (which consequently could not reach the end of our analysis), and some missing data for fibre-loaded filaments (PA6_GF30 and PAHT_CF15) are deplored. We also deplore the absence of PETG (Glycol-modified PET) filament in the range, as this plastic is popular in FDM printing, and we would like to know how it compares with the properties of other plastics (probably somewhere between PET and ABS?).
For the record, we also deplore the sometimes imprecise marketing; about PET we can read "prints as easy as PLA, but much stronger", but this is not what is found in the mechanical data (neither in static strength, nor in impact resistance). BASF will not be blamed for this marketing mistake (which they acknowledged), and on the contrary I thank them for the effort put into the mechanical testing campaign.
A number of other brands (Prusament®, FormFutura®, NinjaTek® etc.) offer mechanical data on their filaments, but often less comprehensive than BASF. Most of the time the tests are done in one direction only, without specifying if the specimen was printed flat or even moulded (in which case the characteristics of the raw plastic would be measured, without taking into account the printing process). Prusament® is making an effort by offering tests for specimens printed in 2 directions (flat and edge), but the data in the Z direction is still missing, i.e. there is no precise information on inter-layer adhesion.
It should be noted that even for mechanical tests common to several brands, comparisons of test results between brands are risky: the test methods are never perfectly identical from one place to another, even when they are based on an ISO standard.
Finally, it should be borne in mind that ABS or PLA from brand A probably has a different composition and manufacturing process than ABS or PLA from brand B. We have seen here that the inclusion of an additive can strongly modify the mechanical properties (ABS vs. ABS_fusion+, PET vs. rPET), so we unfortunately cannot directly extrapolate the BASF results to the plastics of other brands.
Carbon footprint. The carbon footprint of filaments is variable, too. It is not very easy data to find, because it will depend on the different stages of production and waste treatment at the plastic part’s end of life, but we can still direct the interested reader to this scientific article: Zheng & Suh 2019. "Strategies to reduce the global footprint of plastics". Nature Climate Change. https://doi.org/10.1038/s41558-019-0459-z
In this paper one can find carbon footprint values for the production of 3 plastic types tested here:
- PET: 3.3 kg CO2e/kg
- PP: 2.0 kg CO2e/kg
- PLA: 1.8 or 0.6 kg CO2e/kg, depending on whether PLA is produced from corn or sugar cane, respectively.
To this plastic production footprint, we must add the CO2e emitted during conversion into functional parts (the authors report 0.8 to 1.4 kg CO2e/kg for industrial conversion). At the end of its life, 1.2 to 1.3 kg CO2e/kg is emitted if the plastic is incinerated, and 0.9 kg CO2e/kg if it is recycled.
At the end of the day, a 750 g spool of filament therefore emits between 2 and 4 kg of CO2e. This is only an order of magnitude, but it is quite interesting to know.
If this surprises and/or worries you, we can put this in relation to the average personal CO2 footprint, which is ~10 tons per person per year (France data). In other words, if you consume 10 spools of 3D printing filament per year, there is a good chance that this is only a very small part (~ 0.3%) of your personal carbon footprint. Another quick comparison, a compact combustion car emits ~ 0.15 kg of CO2 per kilometre, so if you have one, you only need to drive 20 km less to compensate the carbon footprint of one spool of filament! Obviously, these comparisons are not a good reason to waste plastic, which can pollute the environment in other ways than through CO2.
Colours. A final note for artists: the choice of colours in the Ultrafuse® range is variable.
- PLA: 25 colours
- PET: 10 colours
- ABS : 9 colours
- TPC_45D : 8 colours (n.b. no mechanical data on this Flex)
- PLA_PRO1 : 4 colours (black / grey / silver / natural white)
- ABS_Fusion+ : 3 colours (black / grey / natural)
- ASA : 2 colours (black / natural)
- TPU_95A, TPU_64D : 2 colours (black / white)
- rPET : 1 colour (blue)
- TPS_90A: 1 colour (natural white)
- PP, PA and TPU_85A: 1 colour (natural)
- PET_CF15, PP_GF30, PA6_GF30, PAHT_CF15, PC_ABS_FR, PC_GF30: 1 colour (black)
 Emmanuel de Margerie
Discussions
Become a Hackaday.io Member
Create an account to leave a comment. Already have an account? Log In.