This section is dedicated to research and development in physical chemistry and spectroscopy
Effects of Solvents on Fluorescence of Biological Dyes Section ll
3 Biological Dyes in Water, Ethanol and Methanol
Author, David H. Haffner Sr.
8/29/2016
Abstract
In most polar solutions, such as water and alcohol solutions, ions diffuse more rapidly than covalently bonded molecules, because most ions are smaller than most molecules, and because of their greater polarity caused by a negative or positive charge, ions more readily bind to the molecules of the solution wherein diffusion occurs, and thus flow readily with the solution, while covalently bonded molecules, especially if they are nonpolar or large, will diffuse very little in a polar solution such as water or alcohol, because they will not mix with the solution.
Analytical reagent grade solvents and compounds were used for preparations. Denatured Ethanol; 90.5% 200_Proof Ethanol(CAS: 64-17-5) 4.5% IPA (CAS: 67-63-0) 5% Acetate (CAS: 109-60-4) Duda Energy. Methanol; 99.65+% Concentration_Formula CH4O (CAS: 67-56-1) Duda Energy. Distilled water (0_TDS {total dissolved solids}] _NOT deionized.
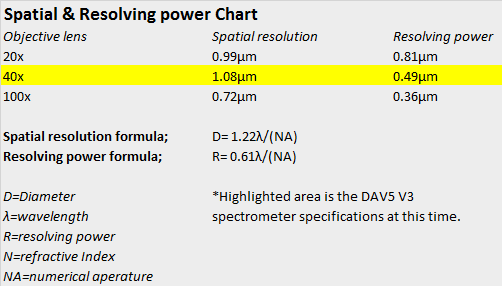
DH4.0 v4 Spectrometer; CMOS Camera Module: JDEPC-OV05, ruling density of the DVD grating is 8.5 GB which equates to 2770 lines per mm. The slit width is now 0.09mm and a spectral bandwidth of 2.13nm, using the new Gillette razor blade design I made.
Software used in data processing is; Spekwin32 v1.72.2P6
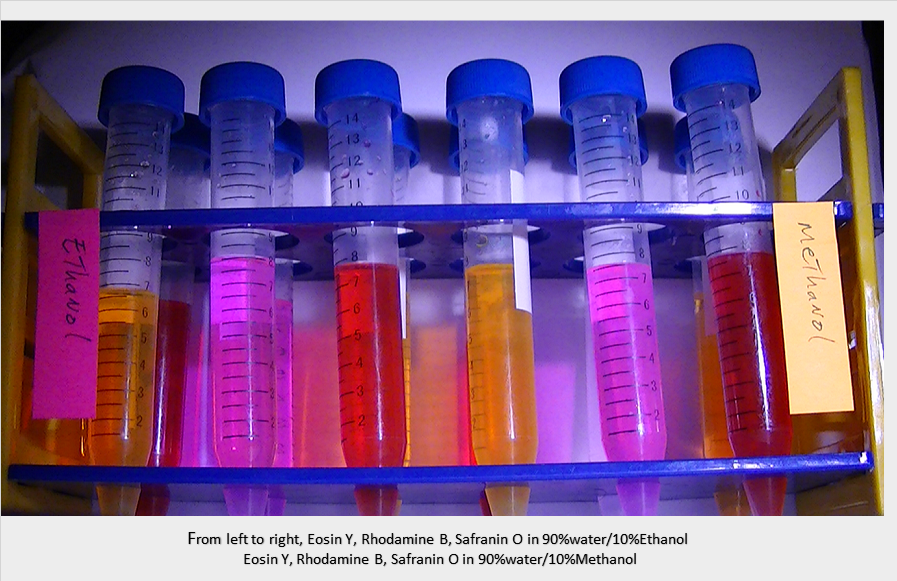
Using [6] 15ml 120mm length centrifuge test tubes, each tube had a transfer of 2 drops from a glass eye dropper of the appropriate biological dye. Then distilled water with a TDS (total dissolved solids) reading of 0, was transferred along with the volumetric equivalent of 10% ethanol and Methanol v/v in the appropriate sample containers.
Dyes used were; Rhodamine B; CAS: 81-88-9 (powdered form) 479.01 g/mol, Eosin Y; 1% Aqueous solution CAS: 17372-87-1 and Safranin O; 1% Aqueous solution CAS: 477-73-6
Introduction and Discussion
Ethanol is primarily a non-polar solvent but does exhibit some polar properties. Methanol on the other hand is primarily polar, as is Isopropyl alcohol, in this follow up study to the one done with Isopropyl alcohol and 5 biological dyes, I examined the effect of 2 solvents with opposite polarities, Ethanol and Methanol. The same experimental conditions were applied in this study as they were in the previous one “Effects of Solvents on Fluorescence of Biological Dyes” posted on; 8/27/2016.
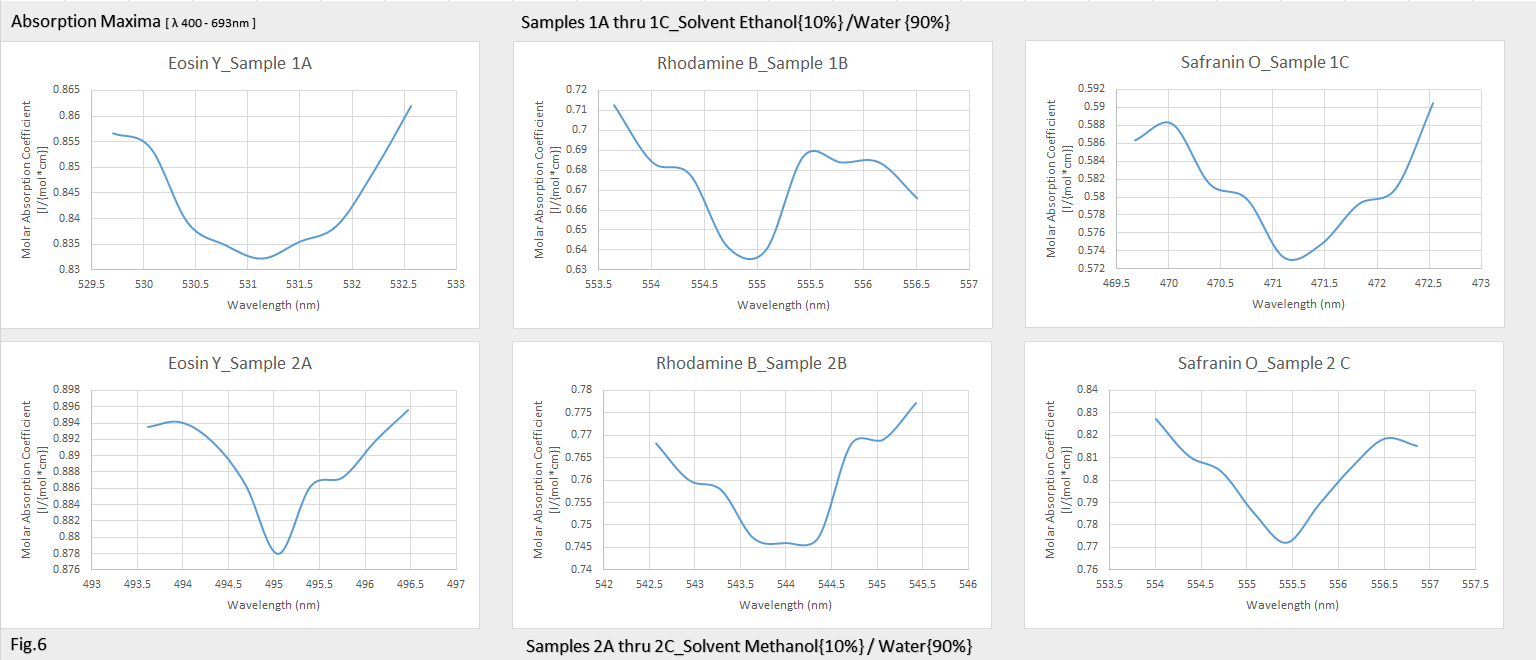
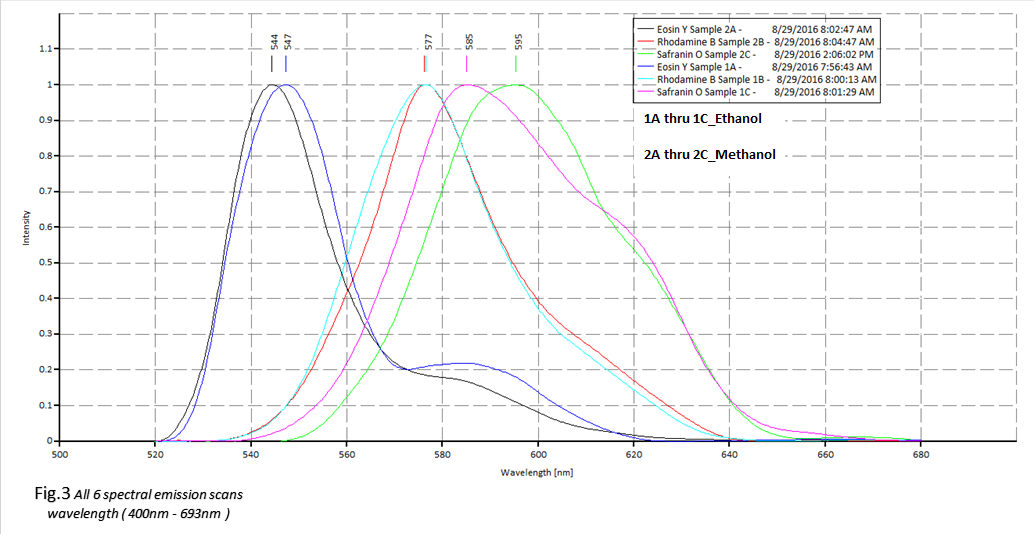
I expected to see a much stronger effect on the fluorophores in the polar solvent than what the data suggested, Safranin O had the most dramatic red shift @ 10nm+ for Methanol than for Ethanol, which the dye’s emission peak was @ 585nm (ethanol) and @ 595nm for (methanol.) Rhodamine B was more sensitive to Methanol than the Ethanol solution which can be seen in figure.6. Water is also a polar substance, so the addition of a non-polar solvent such as Ethanol in theory, should have decreased the solvent effect on the excited state energy level.
The opposite then, should be true for the Methanol solution, increasing the solvent polarity should produce a correspondingly larger reduction in the energy level of the excited state, and this can be seen to a degree in figure.6 also in the lower panels for the absorption data plots, absorption for Eosin Y and Safranin O have a more defined and tighter bandwidth, were in the top panels of figure.6 for Ethanol you can see a more spread out bandwidth for Eosin Y and Safranin O.
What I found truly fascinating was for Rhodamine B, the excitation states are behaving in the opposite manner than what one would expect, but this is what I suspect is happening; If a certain amount of rhodamine B is uniformly distributed in a solvent that it is soluble in, such as water, it should fluoresce without any self quenching effects. However, in presence of the ethanol in the water, solubility becomes a problem and the rhodamine b molecules get encapsulated in the separation layer between the water and ethanol and undergo self-quenching due to the high local concentration inside that layer.
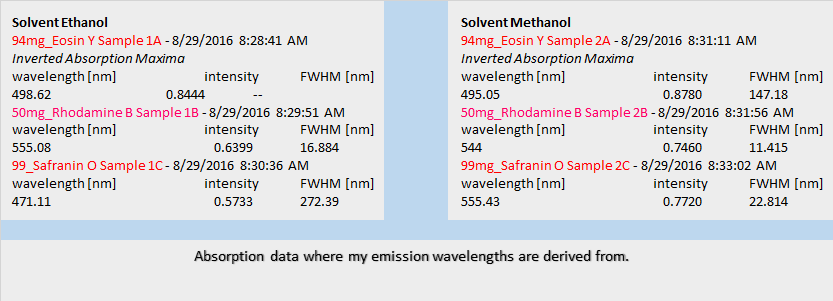
Figures 1 and 2; Emission spectra for Eosin Y, Rhodamine B and Safranin O in Ethanol and Methanol
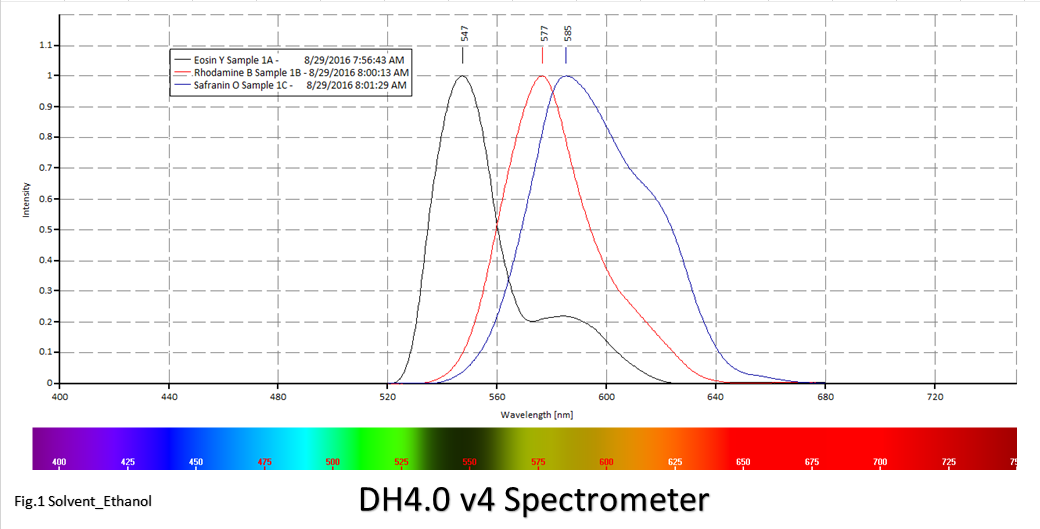
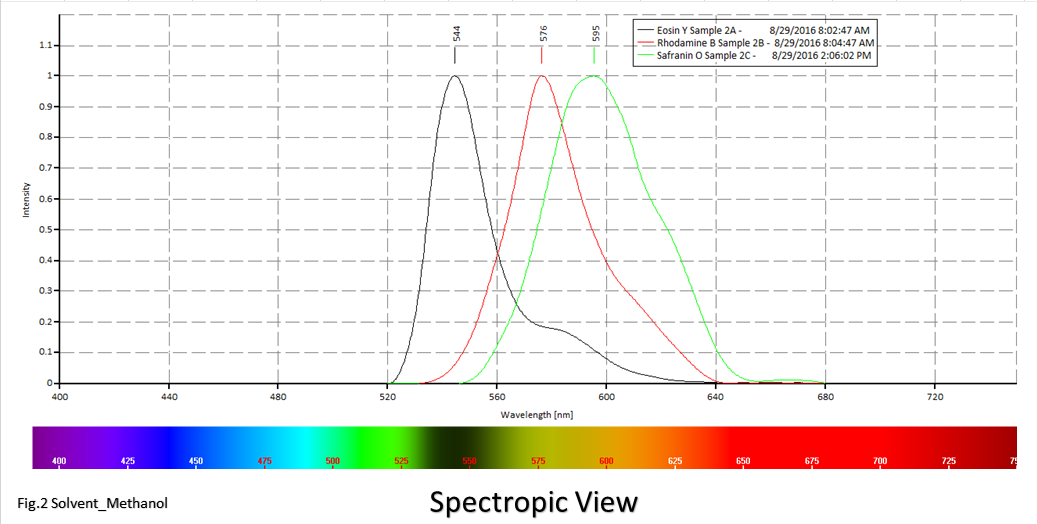 Figure. 3 illustrates all 6 emission spectra and their
respective red shift
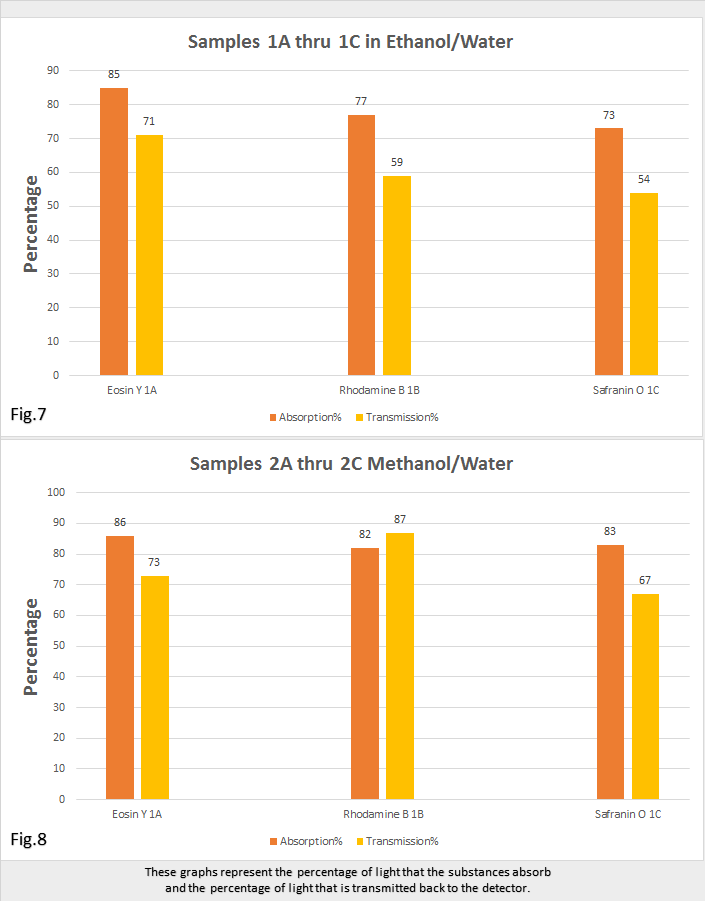
 Figures 7 and 8, are the graphical representation of the
absorption and transmission values depicted in their respective percentages and
effects of solvent and water solution
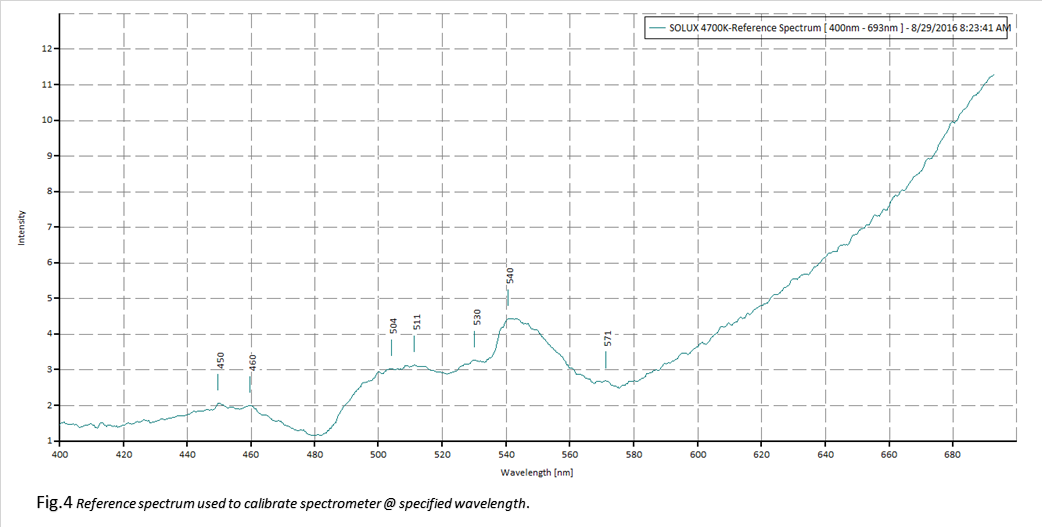
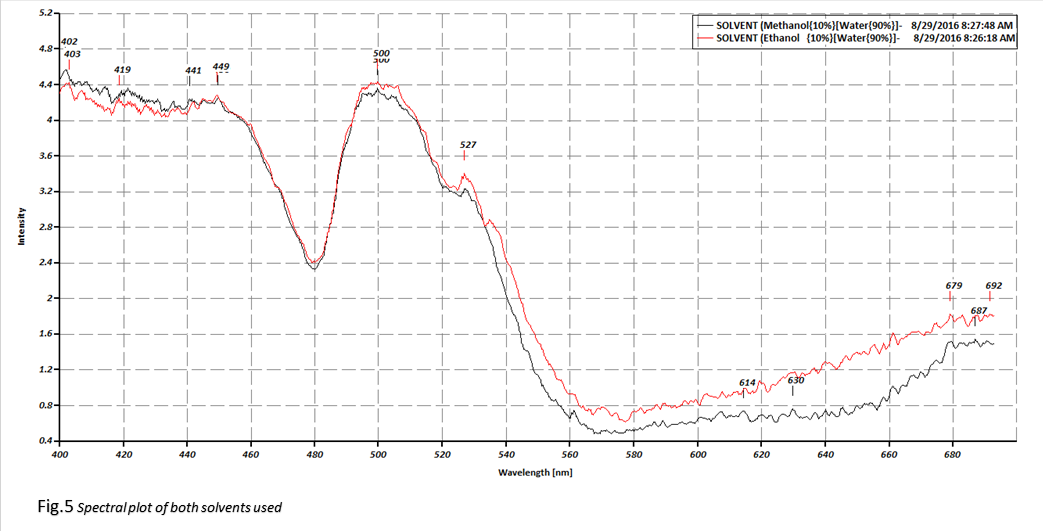
 Figures 4 and 5 contain the reference spectrum (Solux 4700K
used in acquiring the absorption spectra {no sample}), and the two solvent
spectrums that are used as the reference when dividing the sample spectrum with
the solvent spectrum
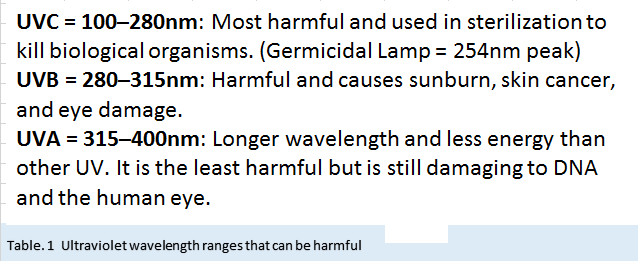
 I wanted to include this last table I made, table.1, it has
the ultraviolet wavelengths from UVA UVB and UVC, here at Plab we do
work at the near UVA range (400-405nm,) sometimes, as I have, down to 385nm, I
thought it important to remind people of the respect one should have for working
safely and smartly when conducting research within these ranges;
References
http://www.rsc.org/suppdata/cc/c1/c1cc13957f/c1cc13957f.pdf
http://pubchem.ncbi.nlm.nih.gov/search/ - the U.S. National Library of Medicine
 David H Haffner Sr
Discussions
Become a Hackaday.io Member
Create an account to leave a comment. Already have an account? Log In.