 Joeshmoe16
Another Plotter Project
I have to confess, the plotter craze got to me. There is something deeply pleasing about a project where your code does something in the real world, where you are creating a tool, and where you are making art. In this project I created a new polar plotter. This project is far more than just some 3D models and circuit design. It’s a new dead simple arduino based gcode controller that works in tandem with a python based application. (If you don’t care to read an article about this project, the github repo has copious amounts of documentation.)
Here is a demonstration of the project.
Before I get into the details of this project, it’s important to talk about the inspiration for this project. The term Polar Plotter comes from a project by Sandy Noble. This project was hosted at polargraph.co.uk and the code can still be found here and here. Noble created an excellent program that can plot some amazing designs. However it is not a gcode machine, and it’s not very general purpose. I wanted something that was minimalistic and easy for people to riff off of.
Then there is the line art itself. I am a big fan of some work done by Mitxela found here. You can also find a huge amount of line art all over the internet, although I like the resources found here and here. In general a lot of these resources are generative art. It’s not AI generated, but rather a lot of different code written by brilliant people all over the internet. The line art must be turned into gcode and here is some information about gcode and generating gcode.
All that being said, the thing that really makes a polar plotter a polar plotter is the simple mechanical design. While it may be simple to make one, it can actually be quite complex to design. Let’s take a look at the finished design and consider some of its features.
In this case the plotter has two motors mounted above the drawing area. Each motor has a pulley with a belt that the pulley can push and pull. The belts meet at a center point with a pen/marker passing directly through the center point. This center part is often called the gondola. The gondola has a servo motor which can raise and lower the marker, using the servo horn to push the marker away from the drawing surface.
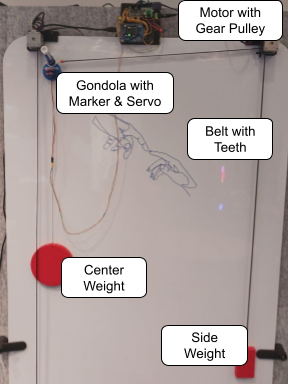
The beauty of this design is that it’s incredibly simple. A typical X/Y plotter might have a gantry that requires a bunch of carefully machined parts to work. Here none of that is required.
Looking closer at the gondola and you might notice that the belts are not directly attached.
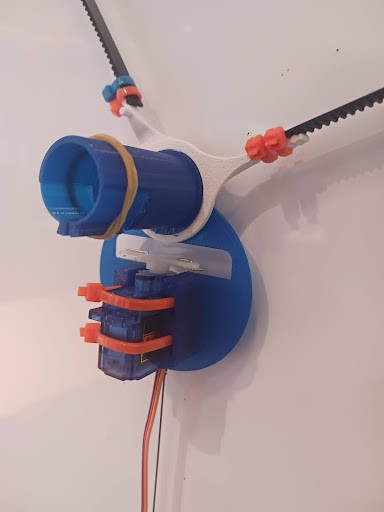
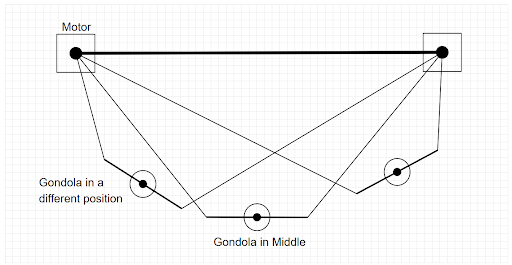
This is because the marker needs to be at the actual centerpoint of the two belts. The two white arms rotate around the blue cylinder. (The blue cylinder is where the marker slides in.) In some plotter designs, this feature is ignored and the belts are directly mounted to the gondola. This creates a problem where the marker won’t be in the expected position. The Gondola will tilt as you move it around so that the weight is always in the lowest possible position. You can see this in the image below.
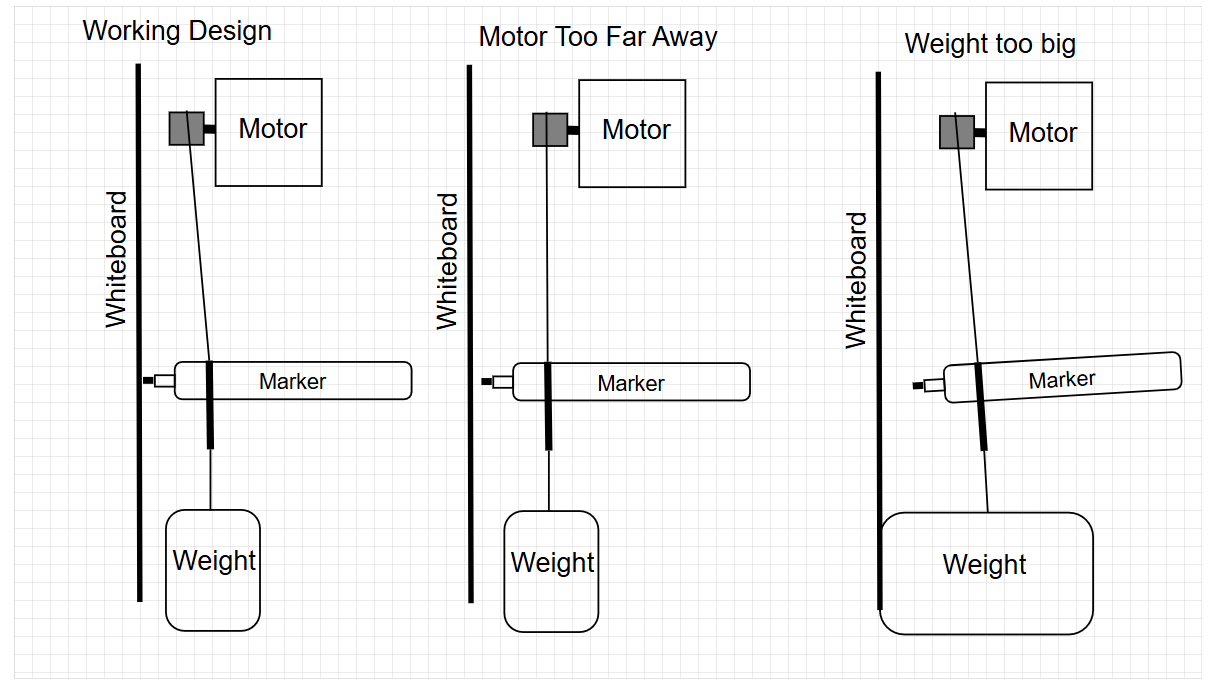
Another consideration with a polar plotter is the marker pressure. In order for the marker to actually touch the drawing surface, the marker needs to push the gondola away from the surface. Consider the sideways view below. If the weight is too big, or the motor is too far away, the marker will just hang in midair and won’t touch the board.
Another mechanical consideration is that the marker can tilt. The further the gondola is from the whiteboard, the more the marker can shake as the plotter moves around and plots. This means the gondola needs to be as close to the whiteboard as possible. Bigger arms will help with this a little bit too. You can see this happen in the gif below.
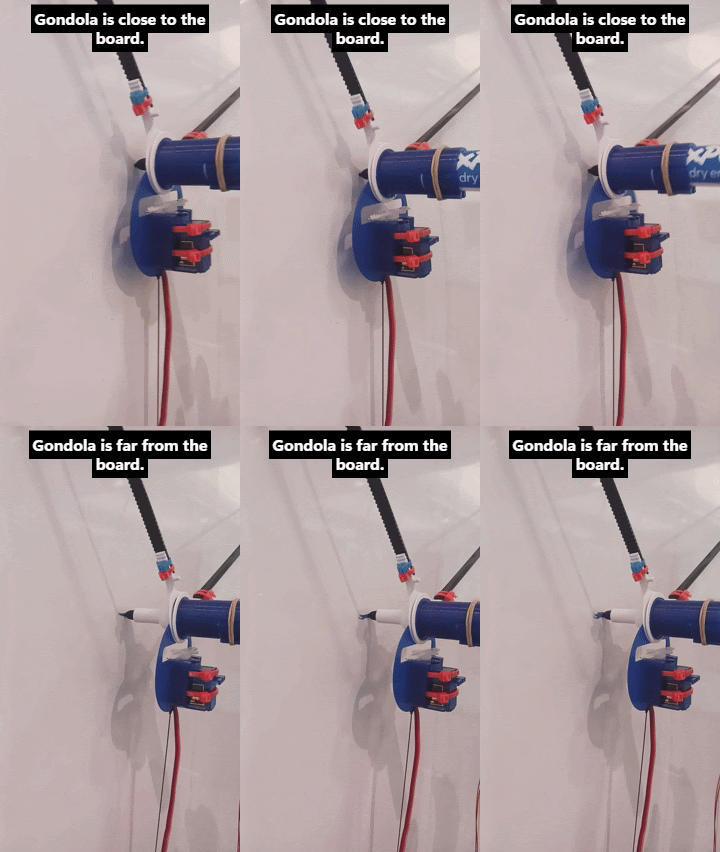
This plotter also has the unfortunate and classic problem of belt skipping. When the machine jerks around too much, or the belts get to certain angles, belt skipping can occur. For simplicity of design, I did not include belt tensioning.
Once you have a mechanical design, you have to write some code. And to make good code, you need good math. It’s actually quite simple to calculate where to move the stepper motors to. You just have to use the Pythagorean Theorem.
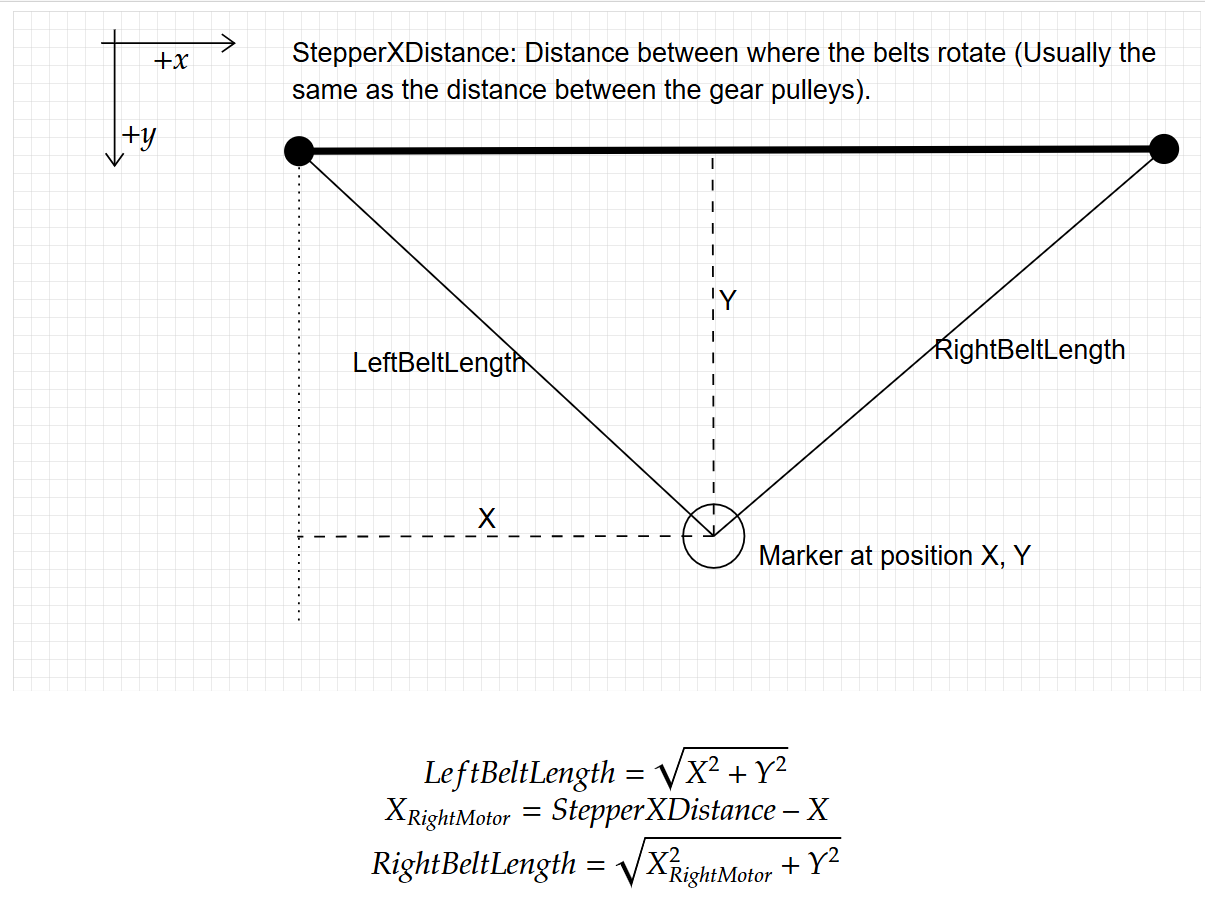
If you know the length of the belt, it’s easy to know how much to turn the stepper motors. You just need to know how much each step of the motors moves the belt. In my case each step moved the belts 0.1mm. Put another way, each step of the stepper motor lengthens or shortens the belt by 0.1mm.
Once you can move the machine around to different points, you then have to figure out how to interpolate. You of course need interpolation to achieve curves (G02 and G03 commands), this is the case even with cartesian plotters. However you also need interpolation to achieve straight paths (G01 commands). When you do rapid positioning (G00 commands) you move the machine directly between two points and the belts move as quickly as possible. This means one belt will reach its position first, causing the gondola/pen path to curve. Even if you move the belts at different speeds so they reach their final positions at the same time, you will still have a problem where the geometry of the plotter will cause the path to curve.
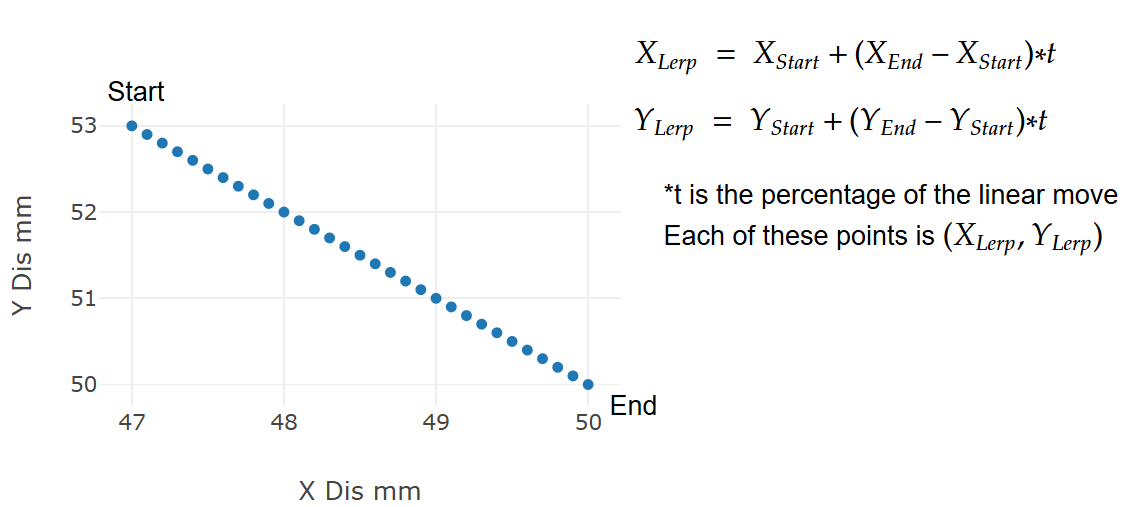
This all means that interpolation is required. This is where you move to a bunch of small points to create a path that follows a GCODE command. The math seems intimidating, but in actuality is not too complicated. One common term is lerp which refers to linear interpolation.
Lerp is commonly used in a variety of computer science applications. Essentially it refers to any time you have a start value, an end value, and a scale. The scale is typically a percentage of the distance between the start and end value. In this case, the scale is steps, where the number of steps between two points is the distance between the points, divided by 0.1mm. (0.1mm is the smallest precision of the machine.) This is all summarized below:
For circular interpolation it gets more complicated. Typically you know the start position and are given an end position and a center point. It starts with interpolating an angle. You have to find the start and end angles relative to the center point, then do a lerp of the angle. I also calculated the arclength when I implemented this code, as it was needed to determine how many steps to make. Once you interpolate through the angles, you can calculate the actual position at each angle using cos and sin. This is all summarized below.
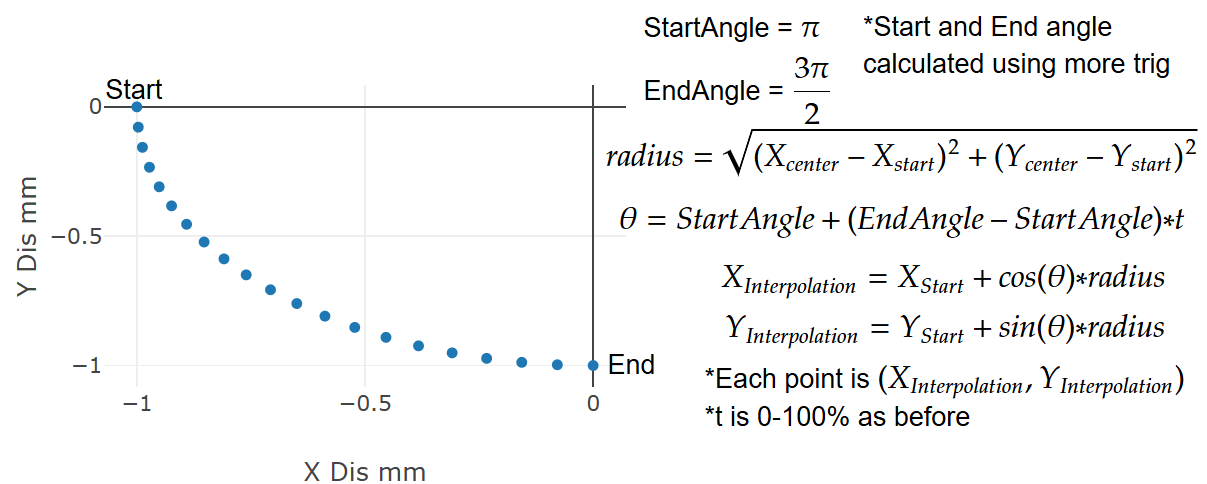
That summarizes the math for this project. The real work was a lot of programming and testing. That is not interesting enough to discuss here, and you can look at the documentation if you want those details.
In general this project was a real joy for me. The challenge of designing a difficult yet fun pen plotter met my skills where they were at. I hope that others take up this plotter or a similar one and make some great art. Here are some more pictures of stuff I’ve made for your enjoyment.
Discussions
Become a Hackaday.io Member
Create an account to leave a comment. Already have an account? Log In.