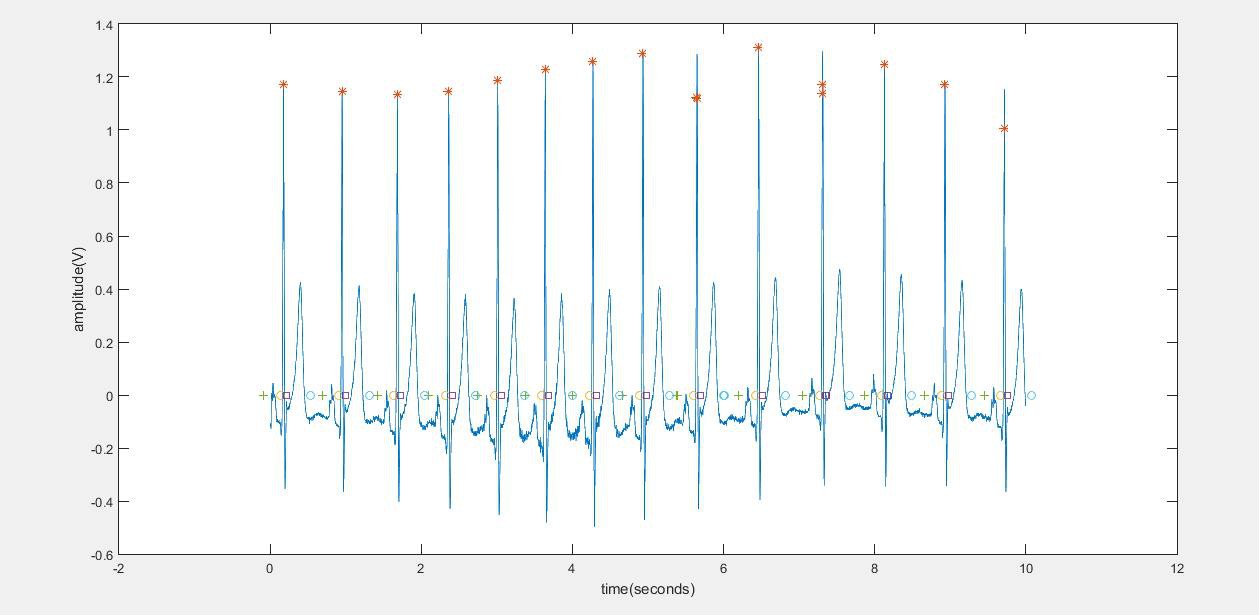
So, major news. We just managed to get the software working.

The crosses, circles and other markings show where the major components of a heartbeat are.
They are as follows:
+ sign- start of the p wave.
yellow circle- start of the qrs complex
red square-ending of the qrs complex.
* sign- top of the qrs complex.
purple square-start of the t wave.
It works pretty darn good. And the timings are accurate.
We can now measure timings and detect errors. The graph is labeled, aproximate BPM is about 90. Amplitude is labeled wrong in volts instead of millivolts.
 Alex Lungu
Discussions
Become a Hackaday.io Member
Create an account to leave a comment. Already have an account? Log In.