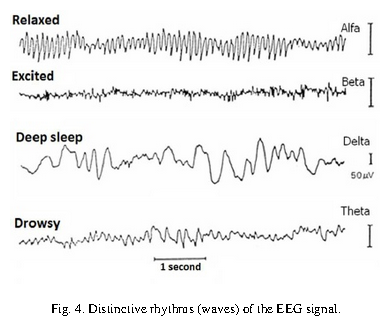
We have begun to ask what signal characteristics we recognize? And we decided to do an analysis of EEG frequencies. But what the waveforms and frequency of status or physical activity of a person say ?. We have found the following:

Author: [1]
Name | frequencies [Hz] | When | |
alpha | 8 | 13 | evident during the absence of visual stimuli |
beta | 12 | 30 | seen in the frontal region of the brain and are observed during concentration |
gamma | 30 | 100 | seen during motor activities |
delta | 0.5 | 4 | observed at stage 3 and 4 of sleep |
theta | 4 | 8 | occur during light sleep and are observed during hypnosis |
mu | 8/12 | Motor Imagery (MI) BCI paradigm | |
Author: [1]
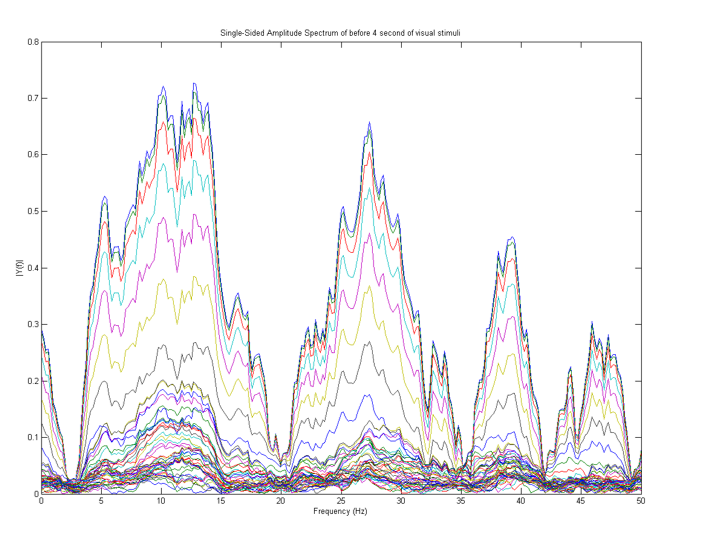
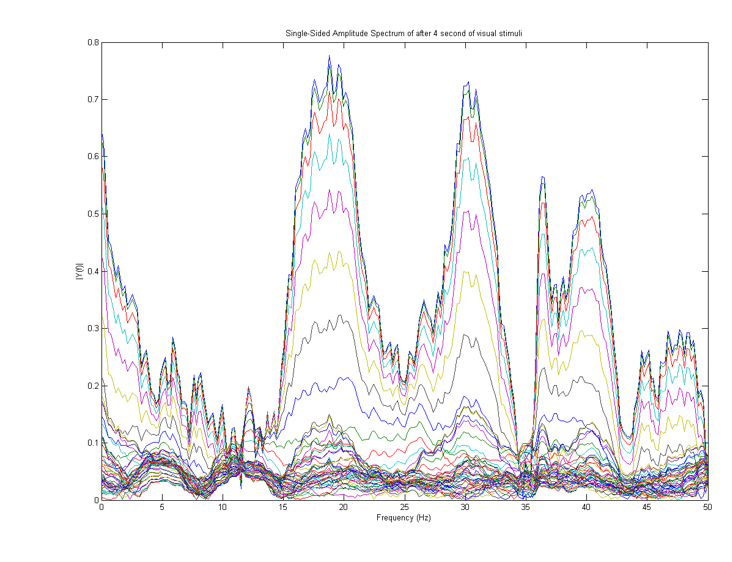
The lines of the next figure 1. are the FFT (Fast Fourier Transform) of the 59 channels database of BCI Competition IV, dataset 1 during the second 2 after a visual stimulus and the second one after removing the stimulus Visual. It seems that you can see the visual image stimuli right, because there is a lot of energy between 8-13 Hz frequency bands, and the Figure 2. there appears to be an absence of visual stimulation.

Figure 1.

Figure 2.
[1] S. Sanei and J. Chambers, EEG signal processing. John Wiley & Sons, 2007.
 Daniel Felipe Valencia V
Discussions
Become a Hackaday.io Member
Create an account to leave a comment. Already have an account? Log In.