 Kuldeep Singh Dhaka
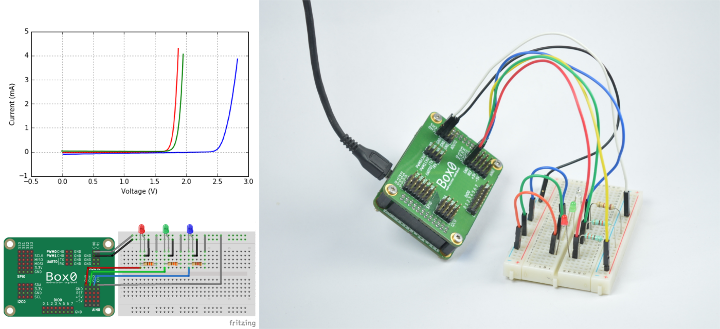
Introduction
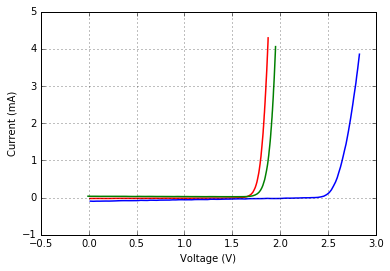
We will draw I-V characteristics of thee led (Red, Green, Blue) on one graph.
The three led’s have different behaviour at different voltage and we can clearly see that on the graph.
Connections


Code
import box0
import numpy as np
import matplotlib.pyplot as plt

# allocate the appropriate resources
dev = box0.usb.open_supported()
ain0 = dev.ain()
aout0 = dev.aout()

# prepare AIN0
ain0.static_prepare()
ain0.chan_seq.current = [0, 1, 2, 3]
ain0.speed.current = 100000

# prepare AOUT0
aout0.static_prepare()

# generate voltage, read voltage, calculate current and store the result
# AIN0.CH0 = Voltage across Red led
# AIN0.CH1 = Voltage across Green led
# AIN0.CH2 = Voltage across Blue led
# AIN0.CH3 = AOUT0.CH0 = generated signal
# current across LED  = (AIN0.CH3 - AIN0.CHi) / Ri

SAMPLES = 100

red_res = 330.0
red_x = np.empty(SAMPLES)
red_y = np.empty(SAMPLES)

green_res = 330.0
green_x = np.empty(SAMPLES)
green_y = np.empty(SAMPLES)

blue_res = 120.0
blue_x = np.empty(SAMPLES)
blue_y = np.empty(SAMPLES)

voltages = np.linspace(0.0, 3.3, SAMPLES)
aout0_running = False

for i in range(SAMPLES):
    if aout0_running:
        aout0.static_stop()

    # output "v" value on AOUT0.CH0
    aout0.static_start(voltages[i:(i+1)])
    aout0_running = True

    # read back AIN0.CH0 and AIN0.CH1
    readed_data = np.empty(1000)
    ain0.static_start(readed_data)

    # do the calculation
    ch0 = np.mean(readed_data[0::4])
    ch1 = np.mean(readed_data[1::4])
    ch2 = np.mean(readed_data[2::4])
    ch3 = np.mean(readed_data[3::4])

    # store the result
    red_x[i] = ch0
    red_y[i] = (ch3 - ch0) / red_res
    green_x[i] = ch1
    green_y[i] = (ch3 - ch1) / green_res
    blue_x[i] = ch2
    blue_y[i] = (ch3 - ch2) / blue_res

# stop if AOUT0 running
if aout0_running:
    aout0.static_stop()

# close the resources
ain0.close()
aout0.close()
dev.close()

# A to mA
red_y *= 1000.0
green_y *= 1000.0
blue_y *= 1000.0

# now, plot the data
plt.xlabel('Voltage (V)')
plt.ylabel('Current (mA)')
plt.grid(True)
plt.plot(red_x, red_y, 'r-', green_x, green_y, 'g-', blue_x, blue_y, 'b-', linewidth=1.5)
plt.show()
Conclusion
You can clearly see the behaviour at increasing voltage.
First RED bias then, Green and then Blue.
Discussions
Become a Hackaday.io Member
Create an account to leave a comment. Already have an account? Log In.