 David H Haffner Sr
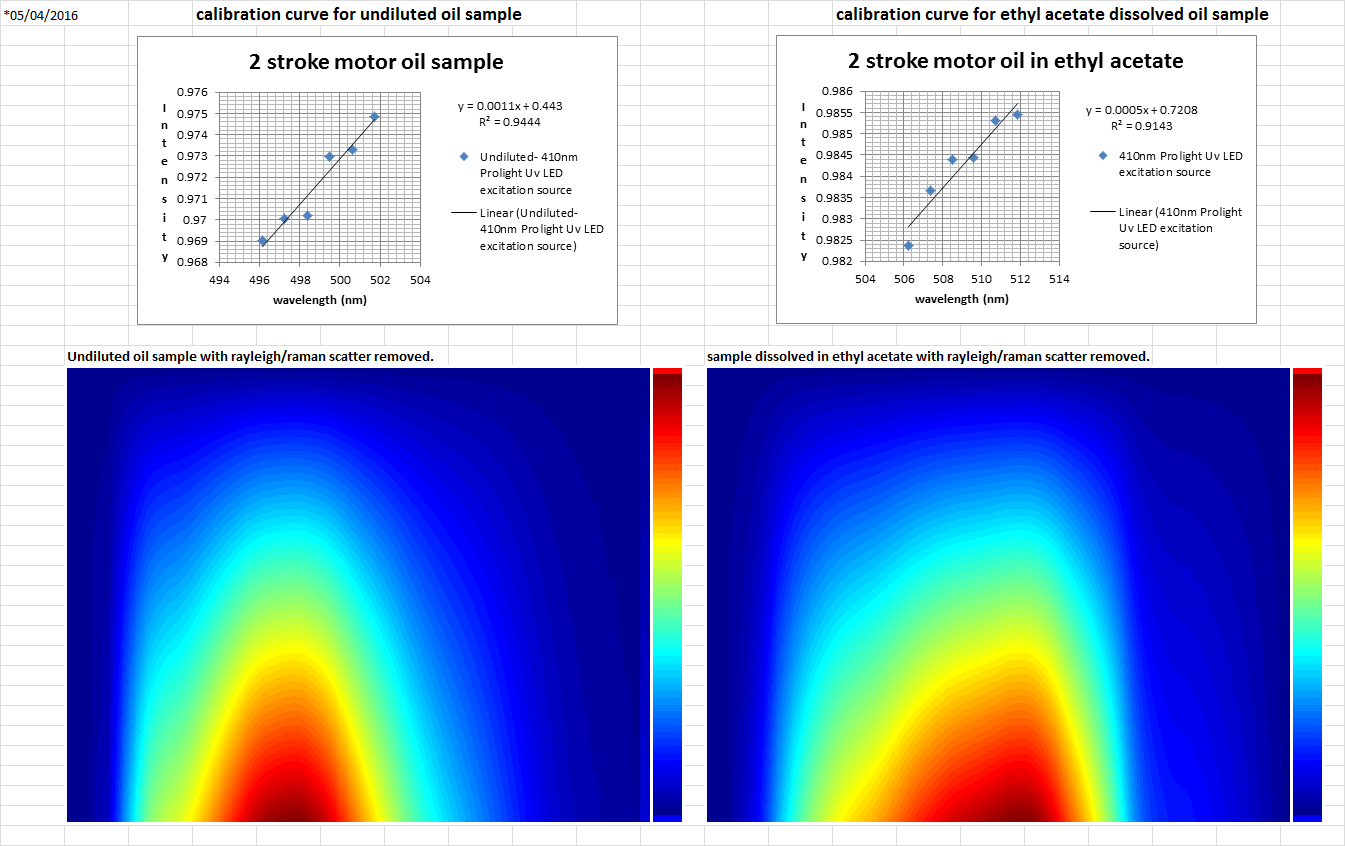
- Further demonstrating the capabilities of my homemade spectrometer is a calibration curve done on 2 stroke motor oil:
![]()
 CFL spectra (compact fluorescent light)
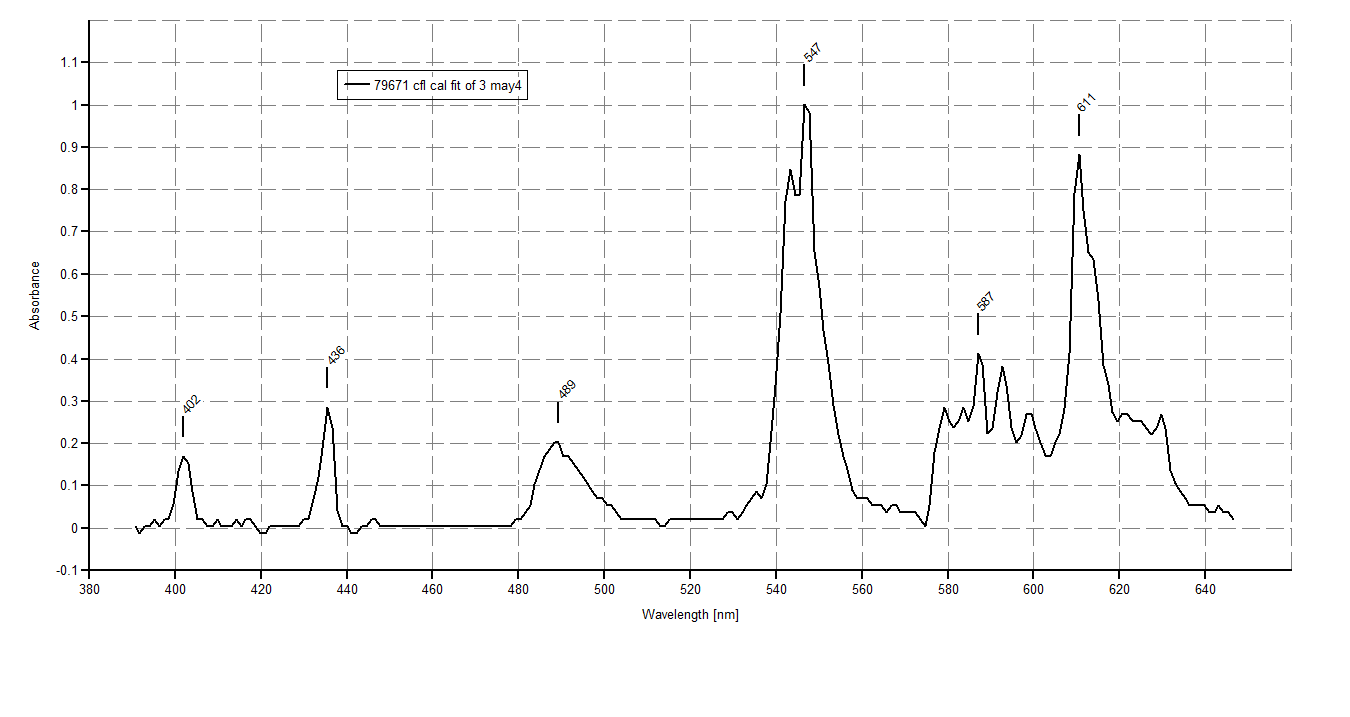
Graph showing cfl plot blue band at 436nm and green band at 547nm
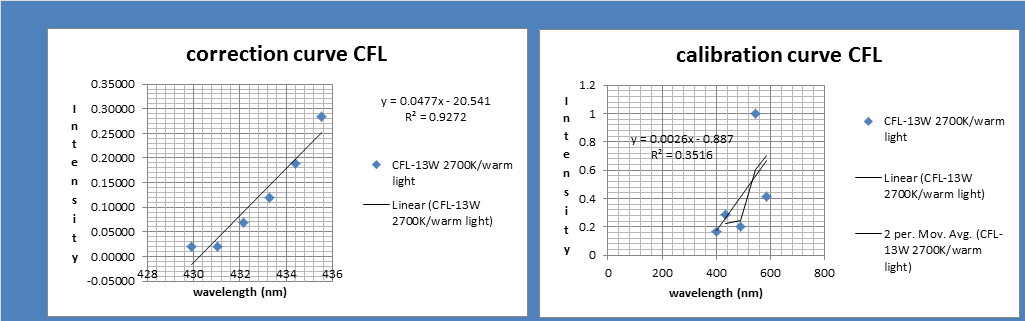 correction curve showing calibration quality fit of 3, target is always a fit of "0" but alas, soooo...far away!
 After upgrading the DVD grating this weekend I naturally had to run a series of tests to recheck alignment and resolution, so this is a great demonstration of what a homemade spectrometer can do!
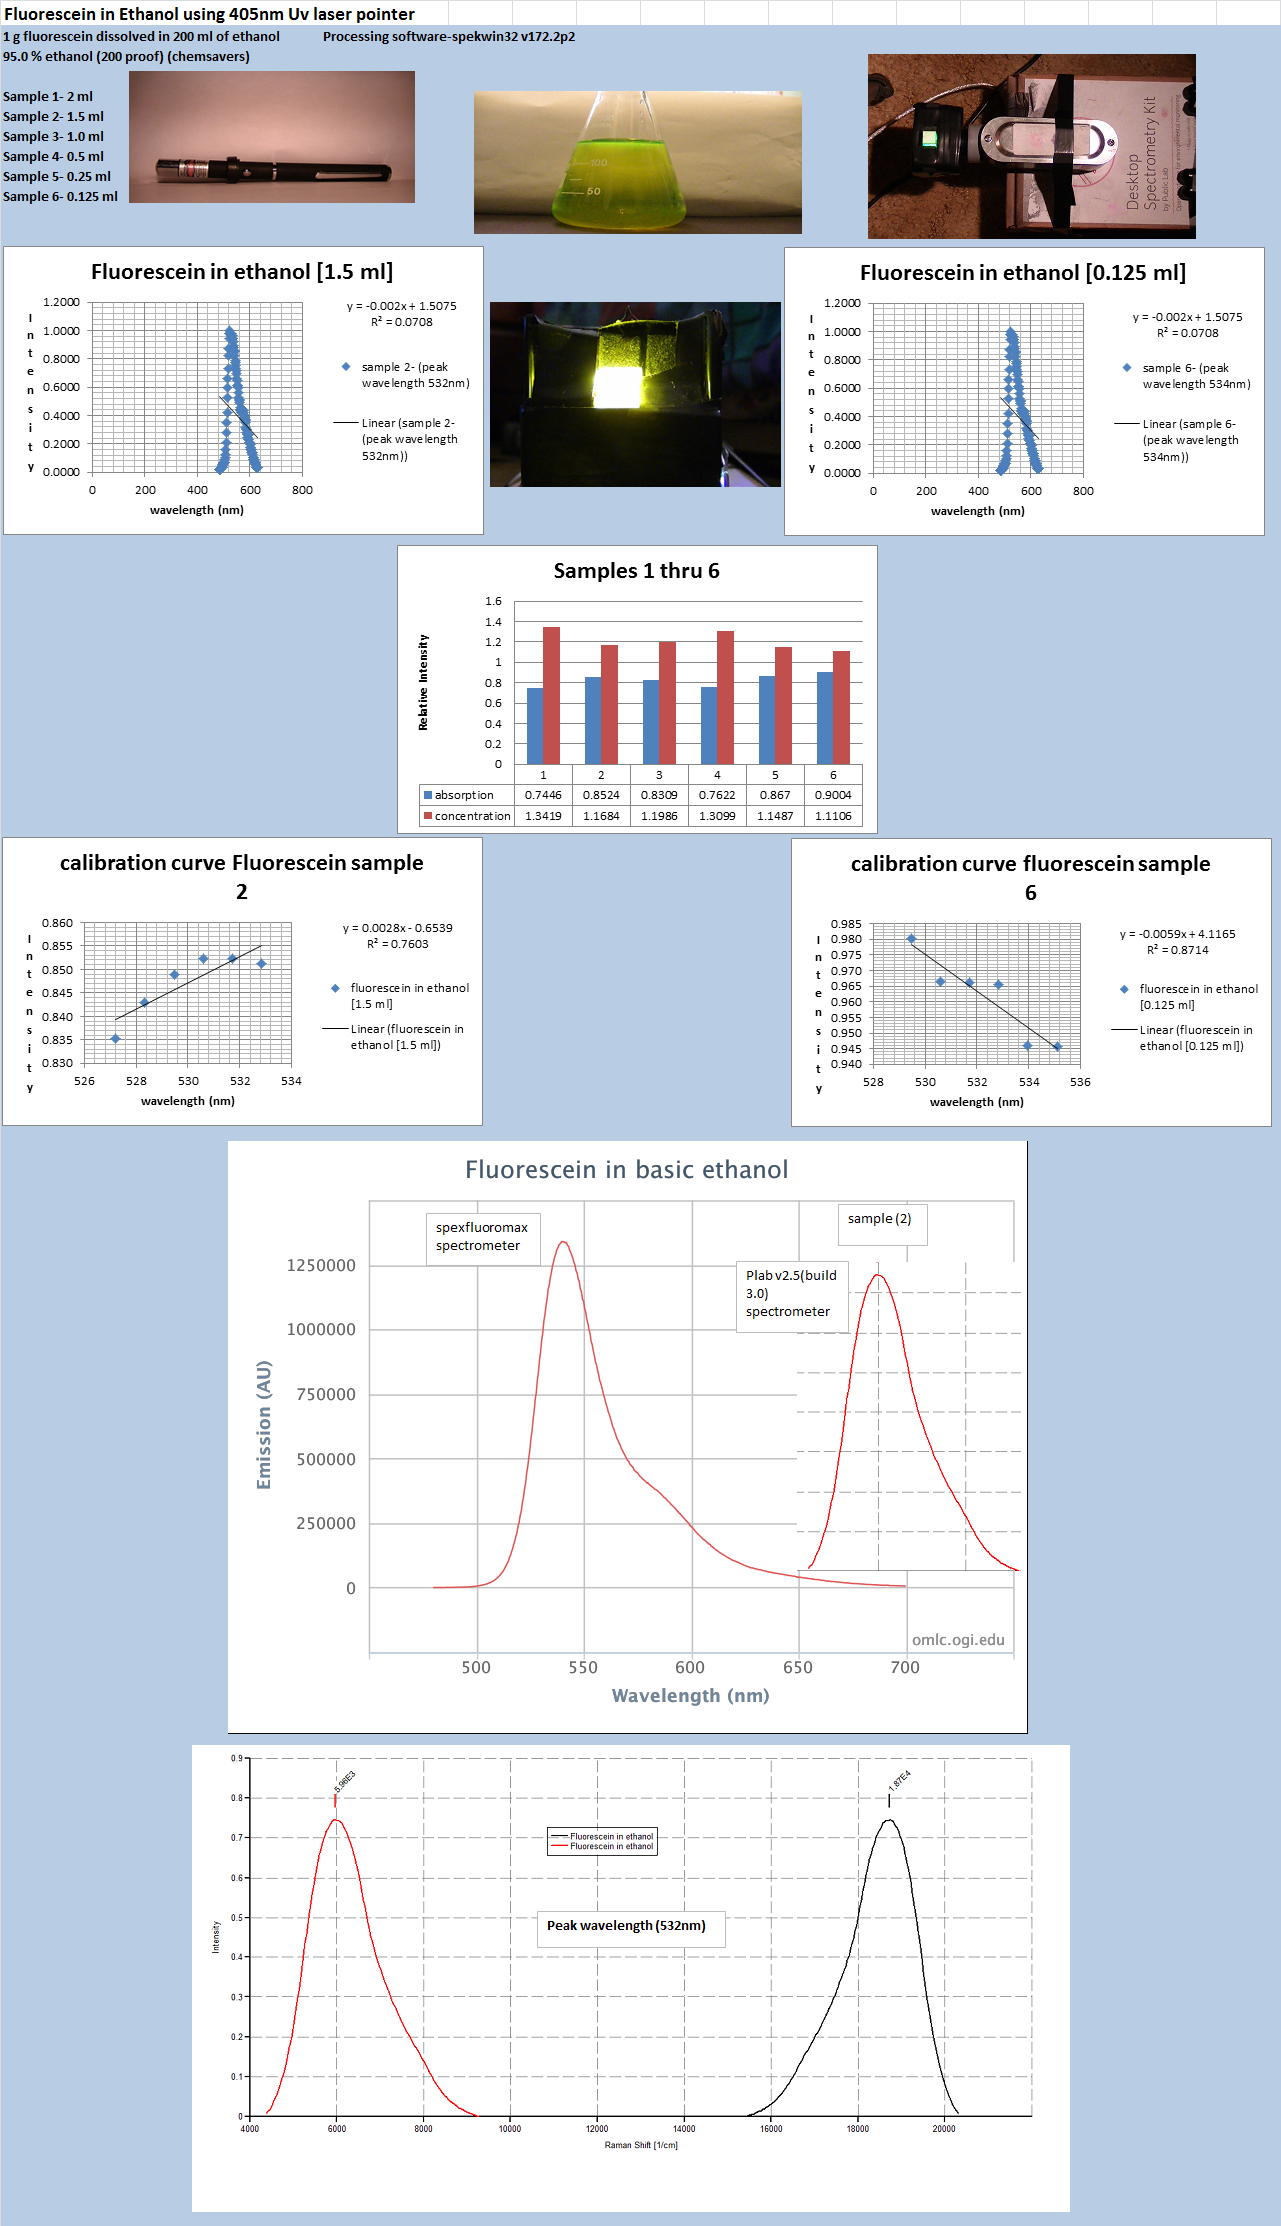
Fluorescein study 6 sample concentrations :
Discussions
Become a Hackaday.io Member
Create an account to leave a comment. Already have an account? Log In.