 M. Bindhammer
Today I started a measurement series by preparing control solutions with different glucose concentration, measuring the concentrations with the commercial glucose meter and comparing the results with the measured transimpedance amp and op amp integrator output voltage of my DIY glucose meter. I used Excel scatter charts to apply linear regression.
Test code:
int current = 0;
int integral = 1;
float threshold = 2.8;

void setup() {
  Serial.begin(9600);
  pinMode(6, OUTPUT);
}

void loop() {
  float current_voltage = analogRead(0) * (5.0 / 1023.0);
  float integral_voltage = analogRead(1) * (5.0 / 1023.0);
  if(current_voltage > threshold) {
    // reset integrator
    digitalWrite(6, HIGH);
    delay(100);
    digitalWrite(6, LOW);
    //delay 5 seconds like the ONE TOUCH ULTRA 2
    delay(5000);
    current_voltage = analogRead(0) * (5.0 / 1023.0);
    integral_voltage = analogRead(1) * (5.0 / 1023.0);
    Serial.print("Current to voltage: ");
    Serial.println(current_voltage,5);
    Serial.print("Integral to voltage: ");
    Serial.println(integral_voltage,5);
    while(1);
  }
}
Scatter charts: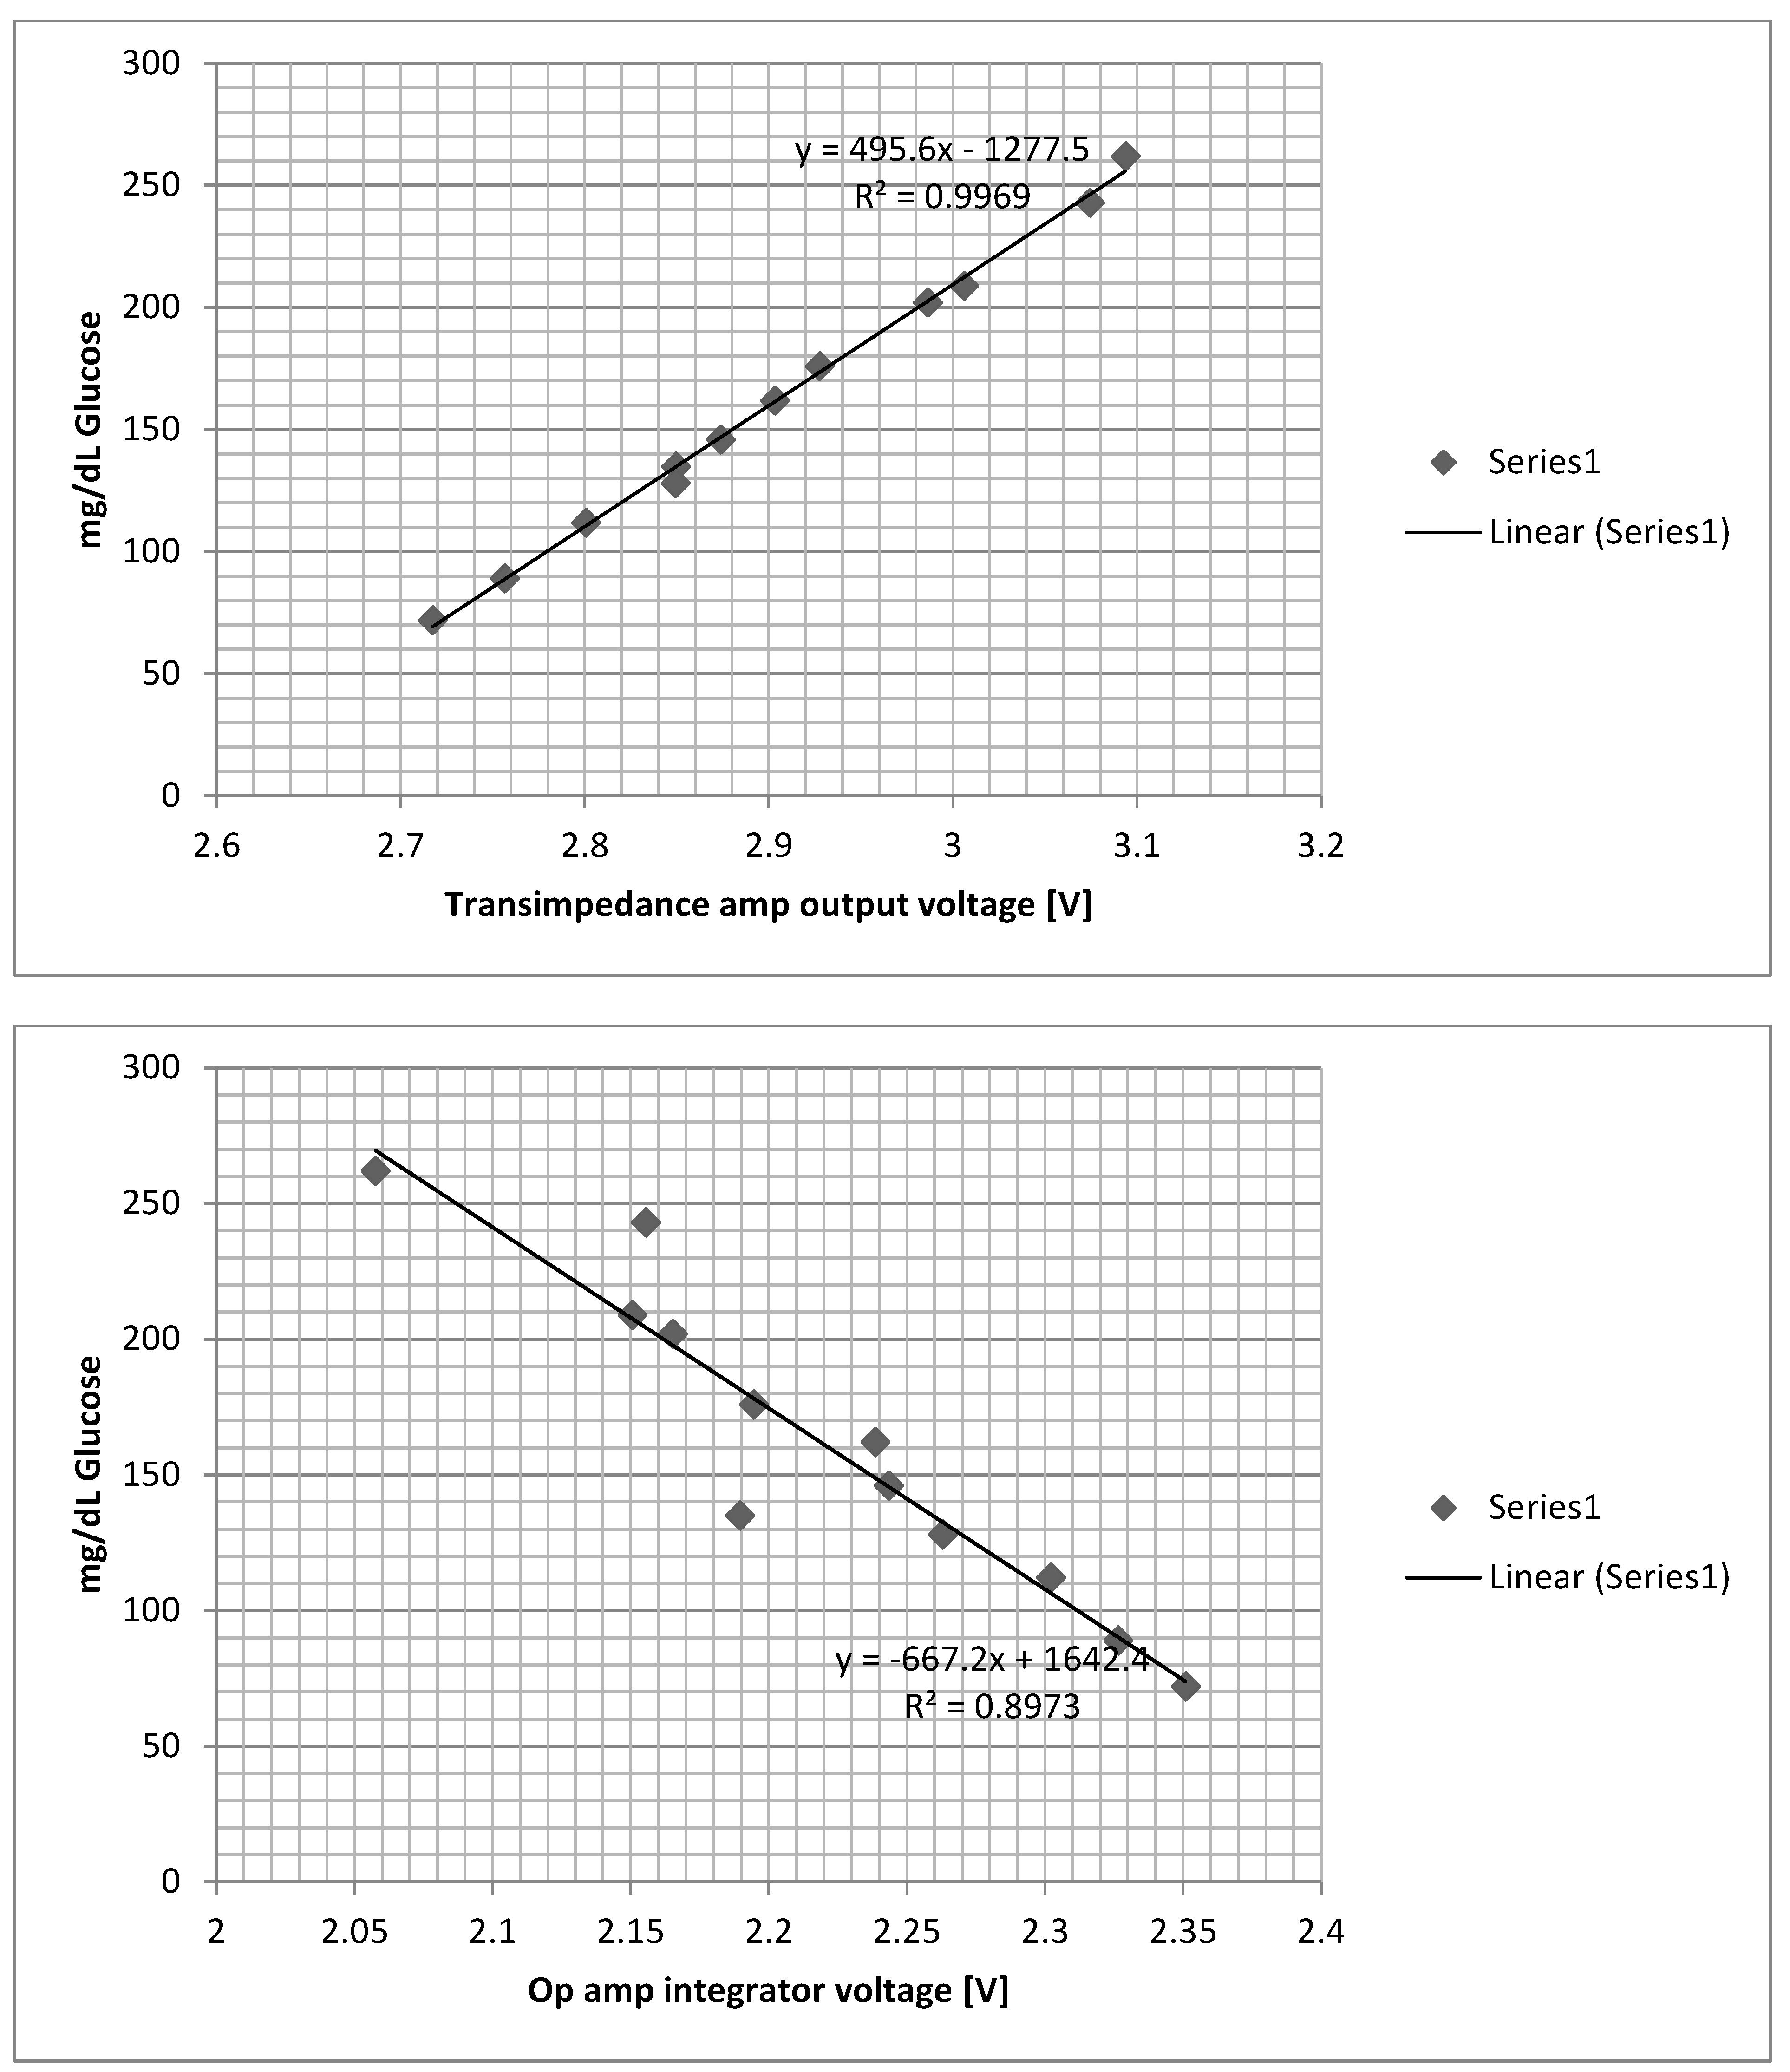
Discussions
Become a Hackaday.io Member
Create an account to leave a comment. Already have an account? Log In.
Hi...the link of Excel scatter charts is damage....i sampled my transimpedance amp output that is the horizental axis in this curve .I do not know what the vertical axis should be? my paper is EASY Gluco Device thet made by China.I live in Iran and I do not have access to the device you introduced.Can you help me reach the final formula?
Are you sure? yes | no