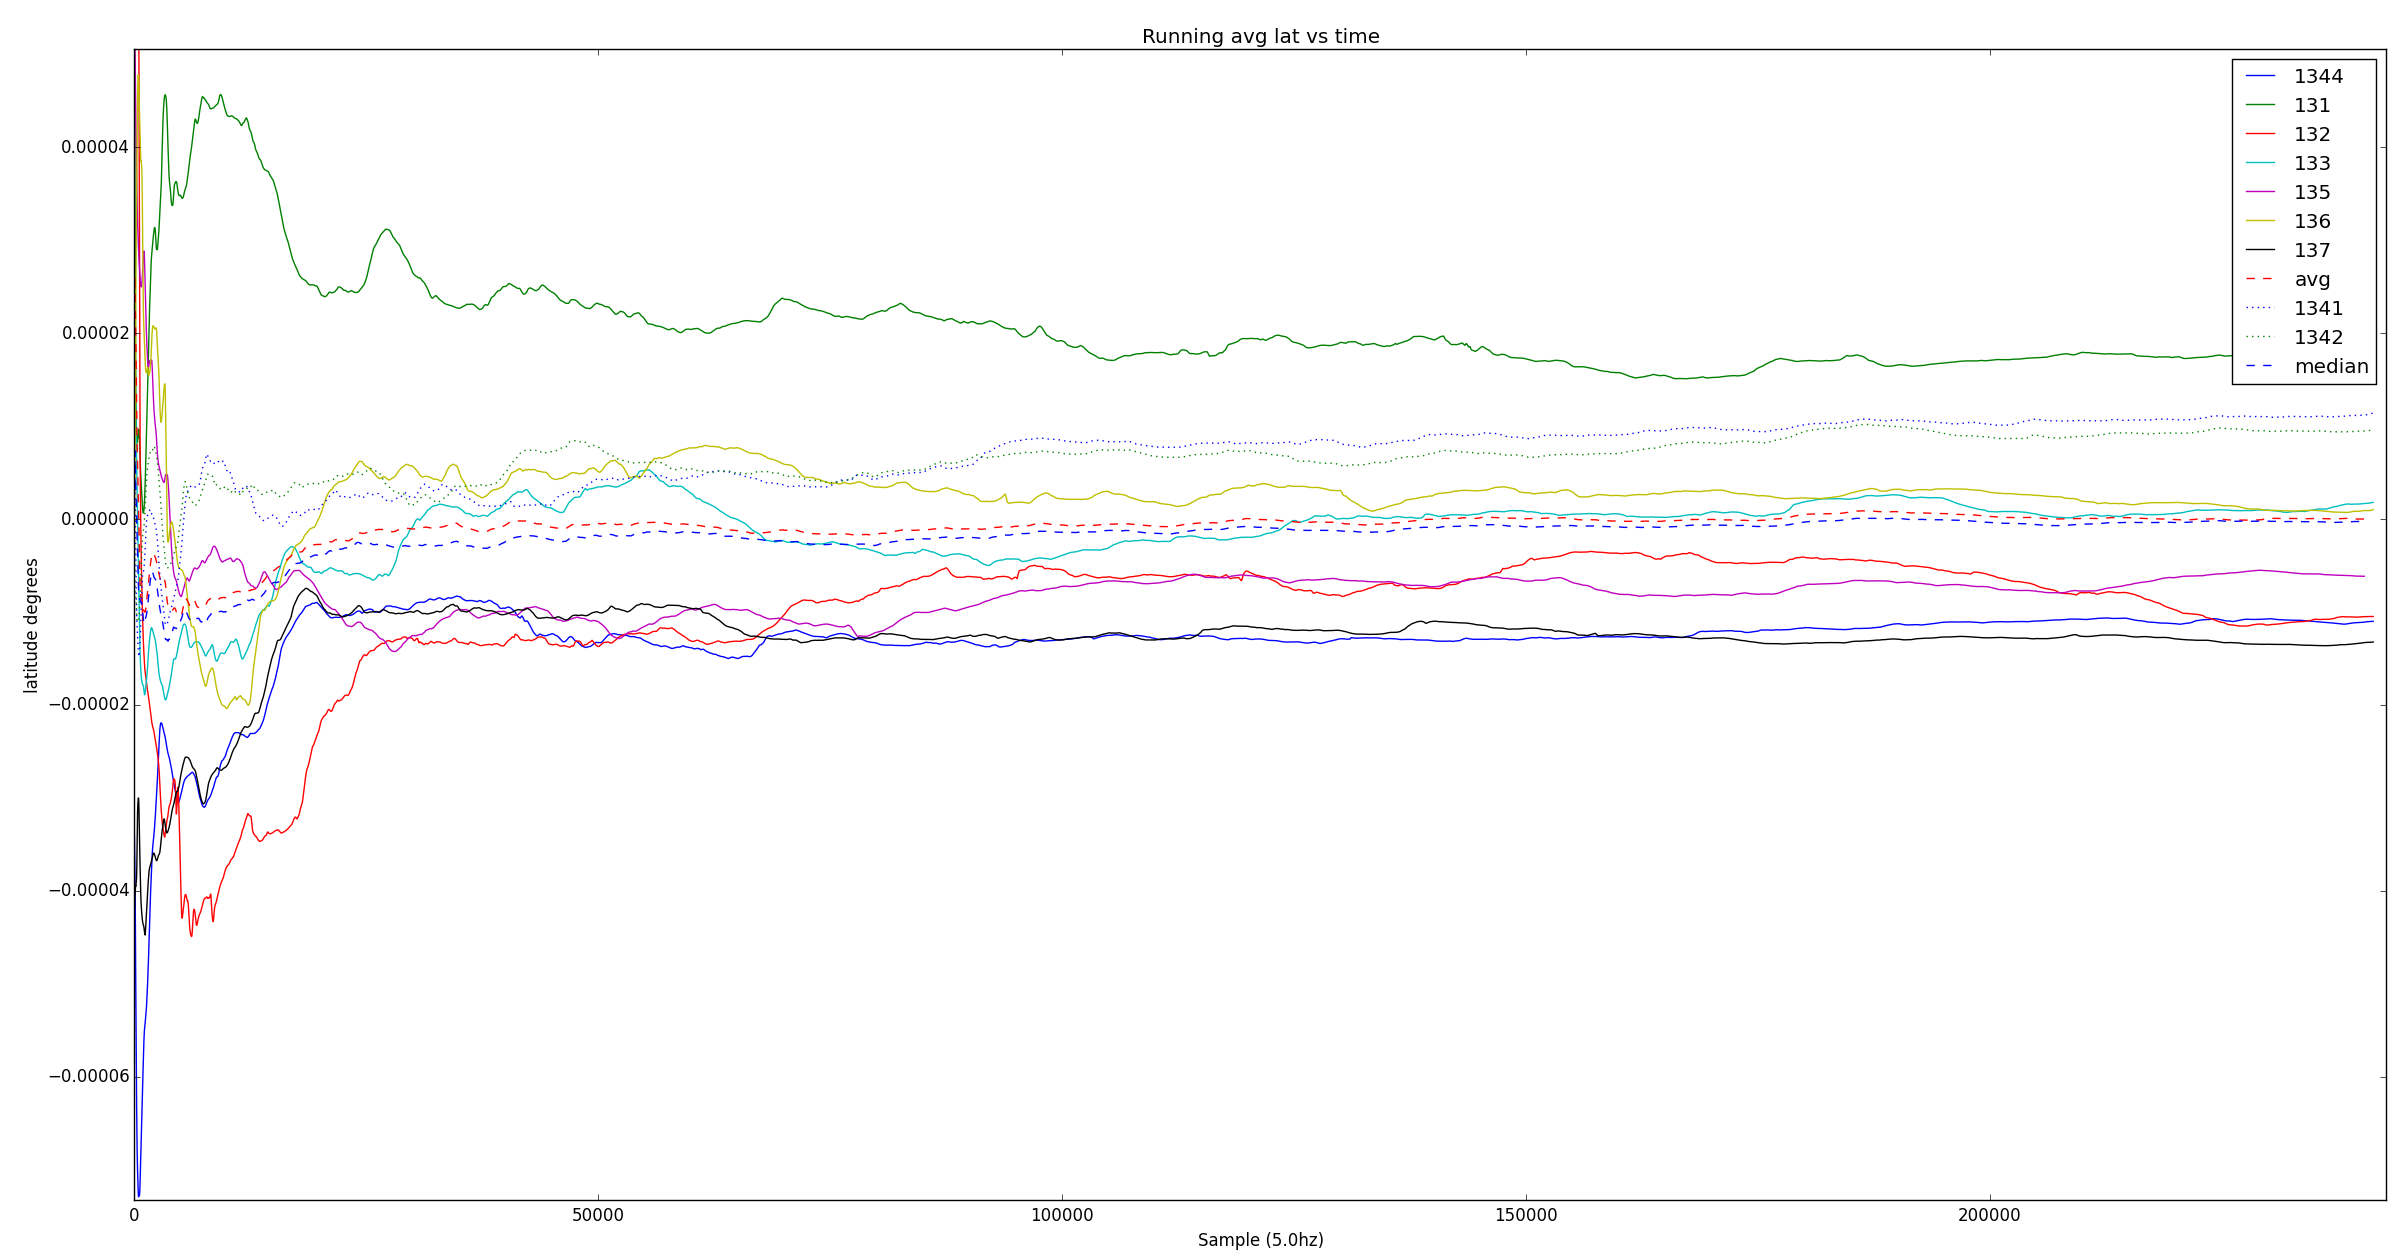
Anthony posted a question about averaging the positions for each receiver and comparing them to the overall average, and checking whether the grouping gets tighter. I hadn't checked that yet, but a few plots later, here is a running average of each receiver with 0 being the average of all data.
 The data stabilizes over the first hour or two but there are consistent offsets between receivers that I think are from reflections since the data was collected indoors. Since each receiver seems to be stabilizing to its own offset the averages get closer but only up to some limit.
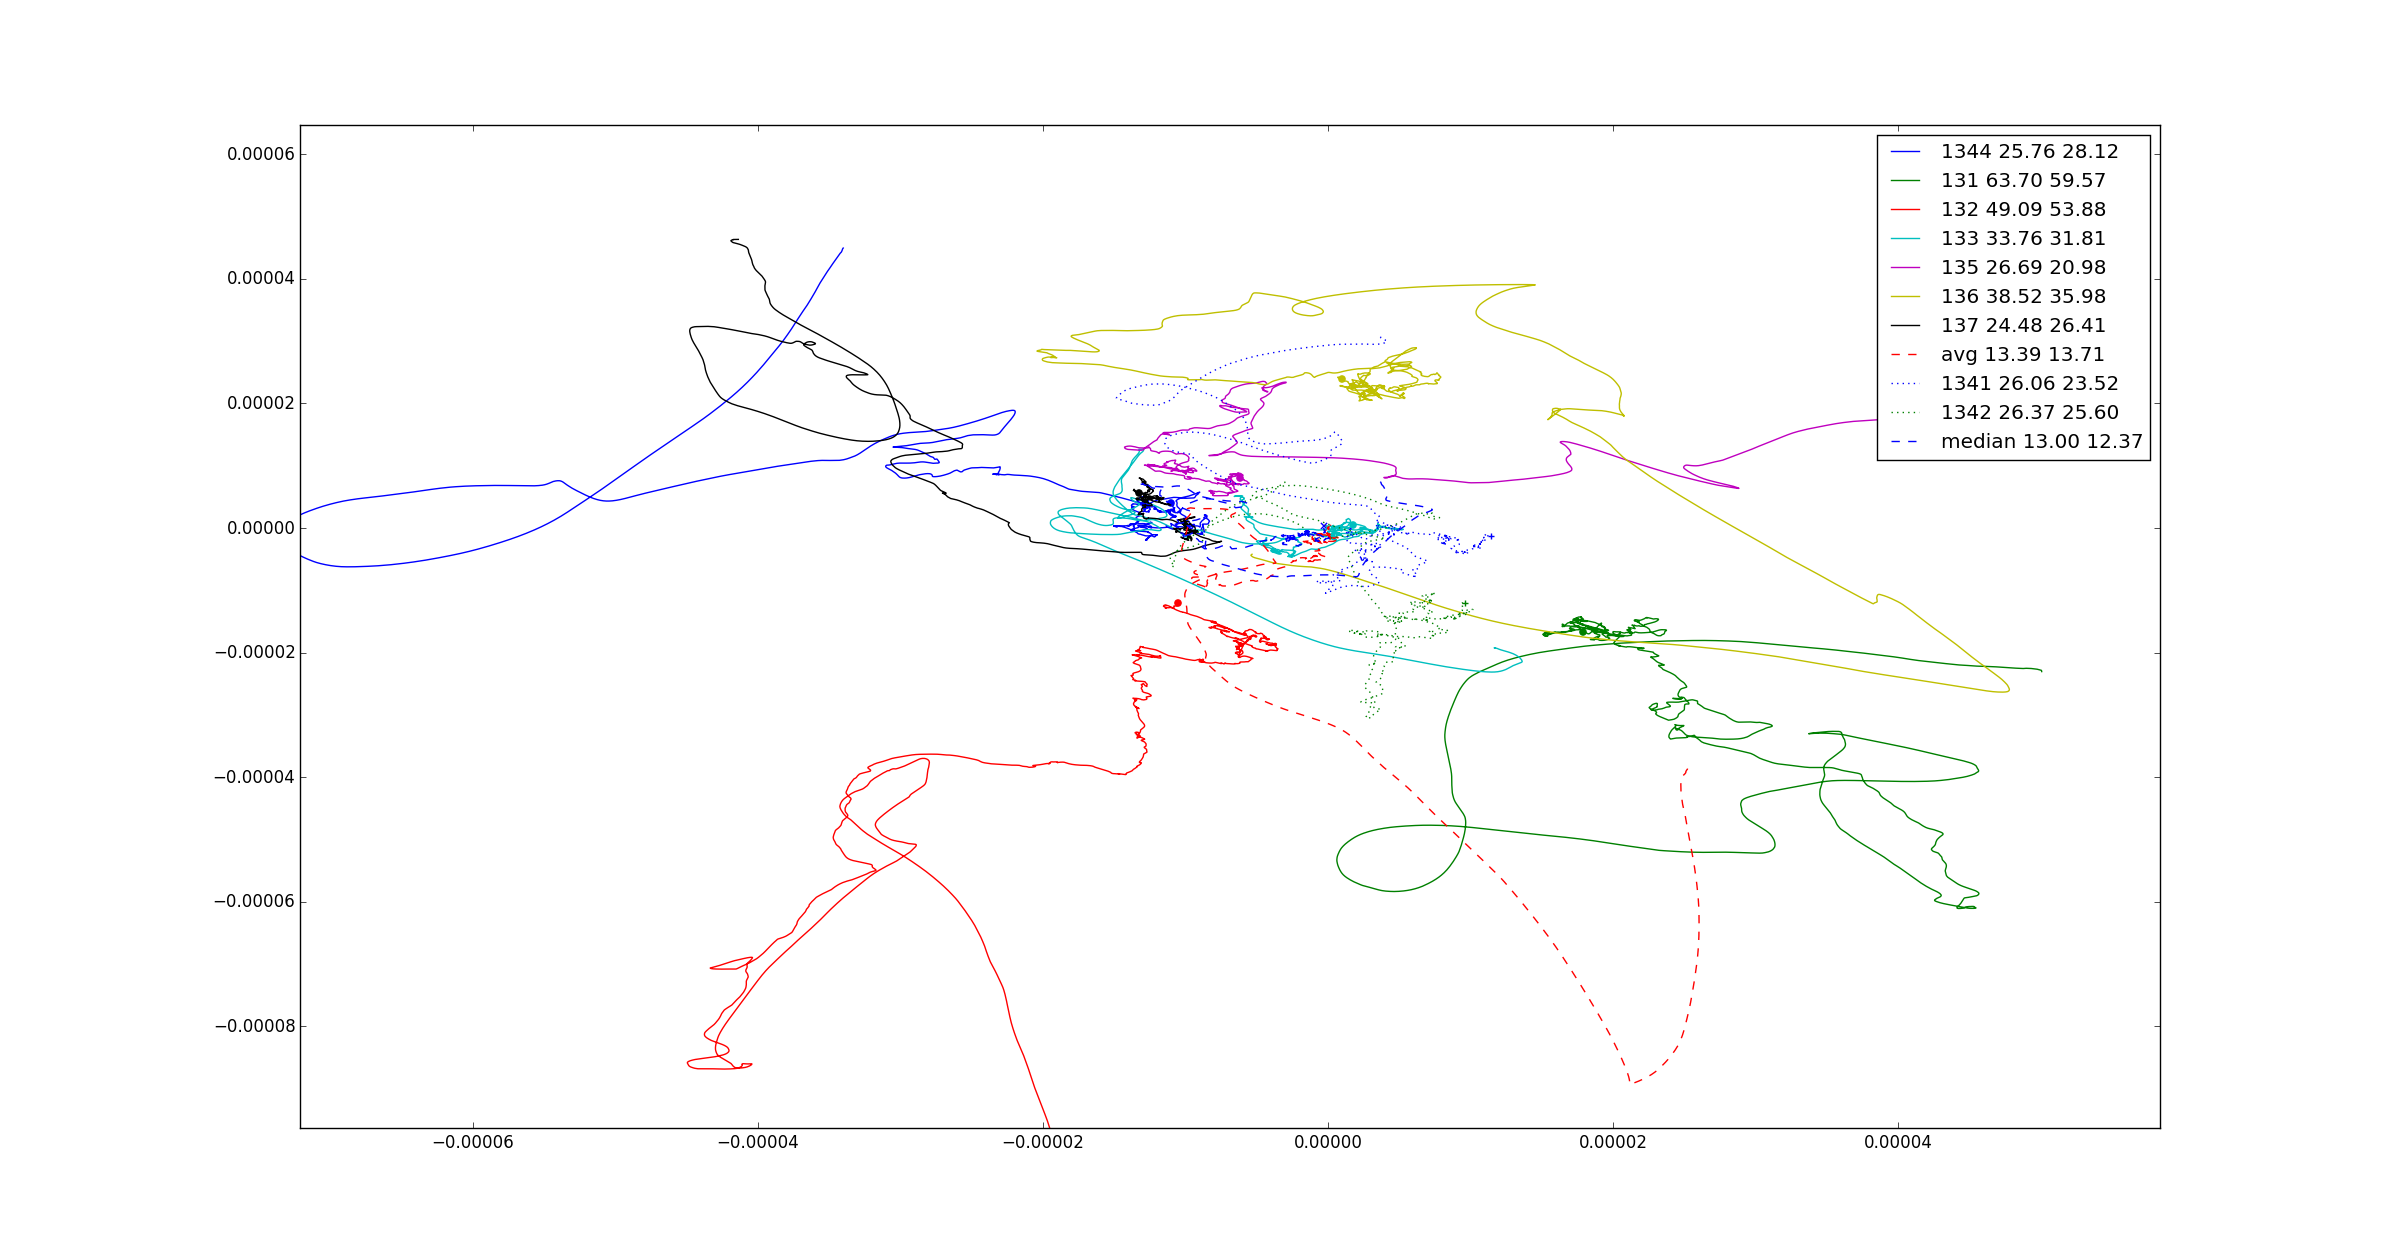
Here is a 2d plot showing latitude and longitude, again with the running average. There is a dot at the final position of each path and the overall average ends at (0,0).
The numbers are receiver port# then standard deviation *1e6 for latitude and longitude.

Discussions
Become a Hackaday.io Member
Create an account to leave a comment. Already have an account? Log In.