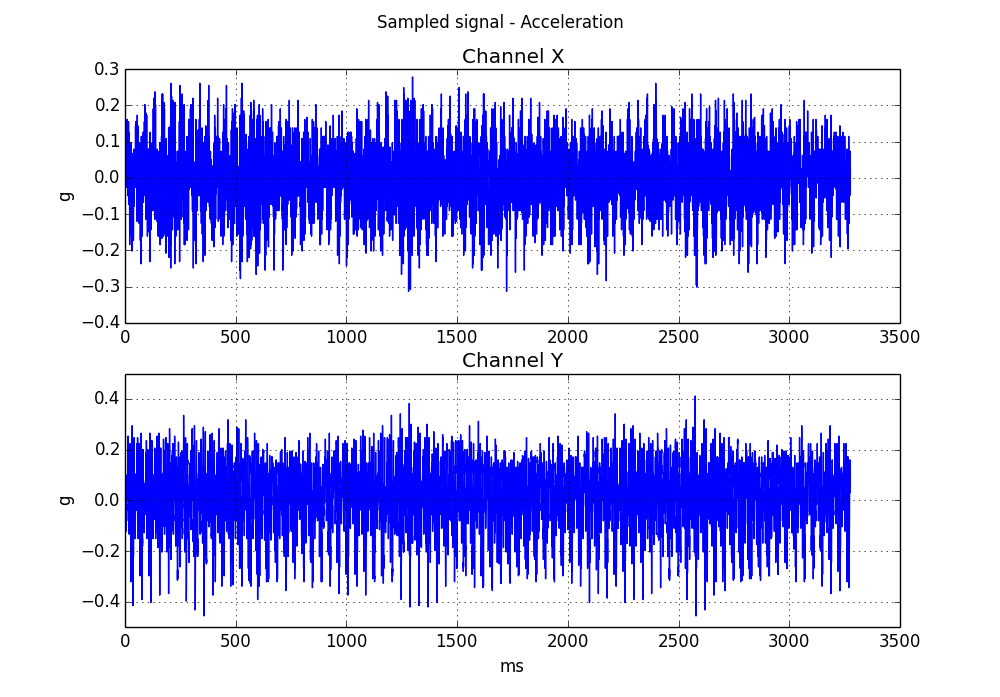
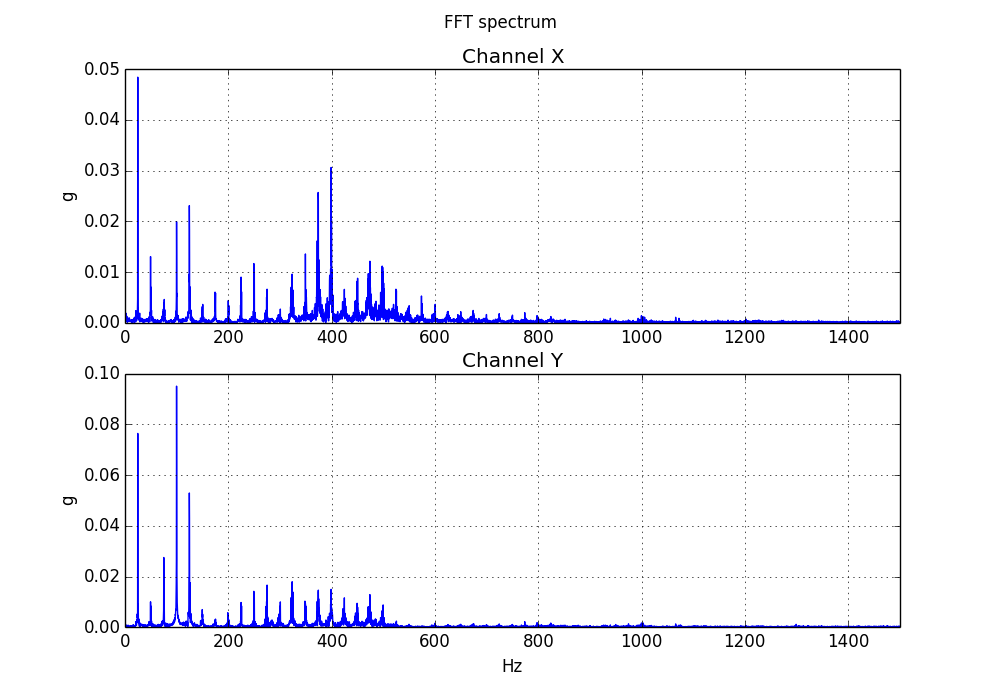
The original program was not properly scaled. The signals were plotted using the ADC values and the number of samples obtained.
The signal size has been scaled to g. The ADXL335 has an output from -3g to +3g, for a voltage range from 0 to 3.3 V, that is converted by the ADC to values from 0 to 1023. The original signal is multiplied by 3.0/512, and then the DC offset is determined, taking the average of all the readings. This approach assumes that the average value of the vibration signal is 0.
A correction to the time scale has also been done, considering the sampling rate and the number of samples taken. Frequency range has been limited to 1500 Hz, the maximum frequency that the ADXL335 con provide on the X and Y axes.
The corrected program is acel_file_plot_03.py, and the resulting plots are now properly scaled.


 Ariel Quezada
Discussions
Become a Hackaday.io Member
Create an account to leave a comment. Already have an account? Log In.