*UPDATE* 01/10/2018 5:01PM
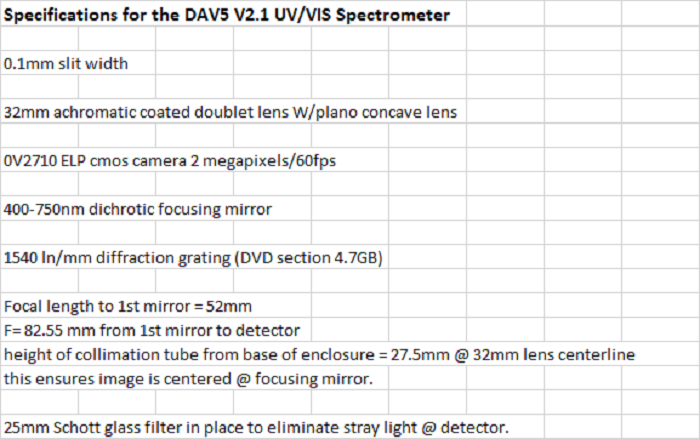
Specifications for the DAV5 V2.1 UV/VIS spectrometer:
( New spectrometer pic's coming soon)
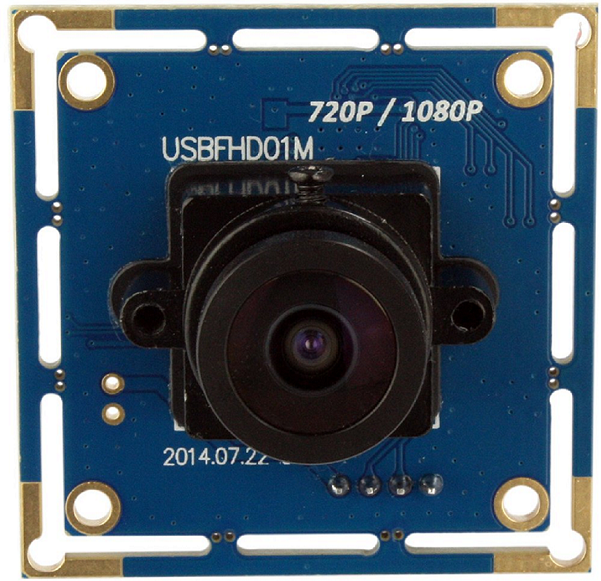
new cmos webcam: ELP-USBFHD01M-L21
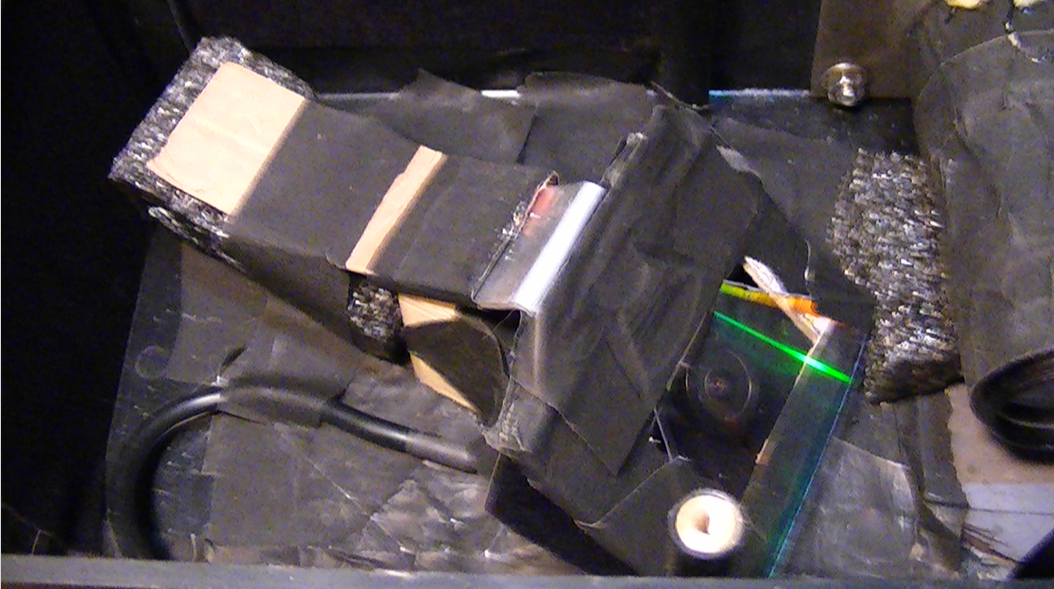
Sorry for the fuzzy pic...

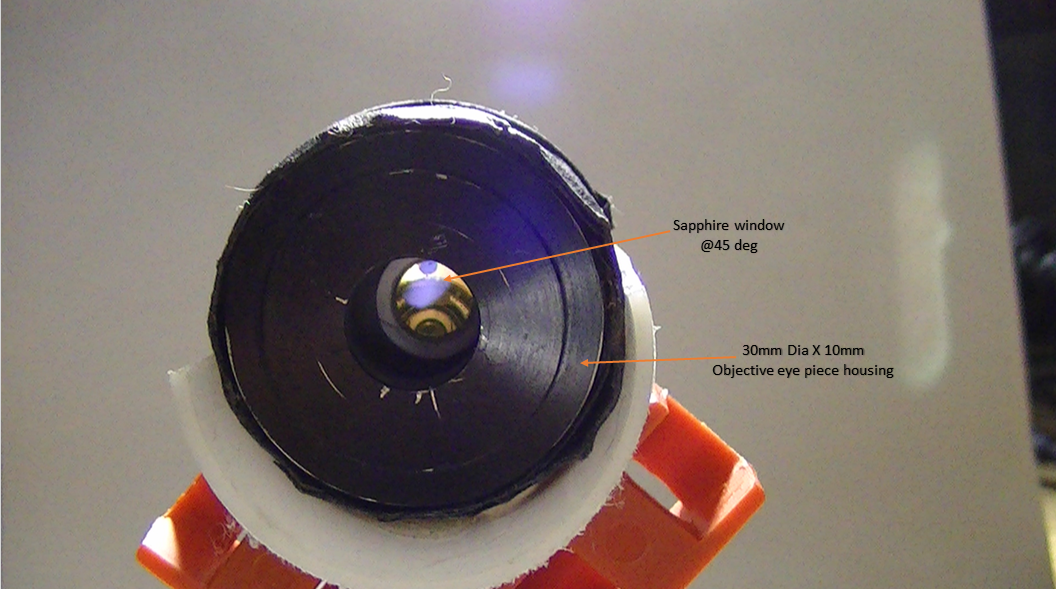
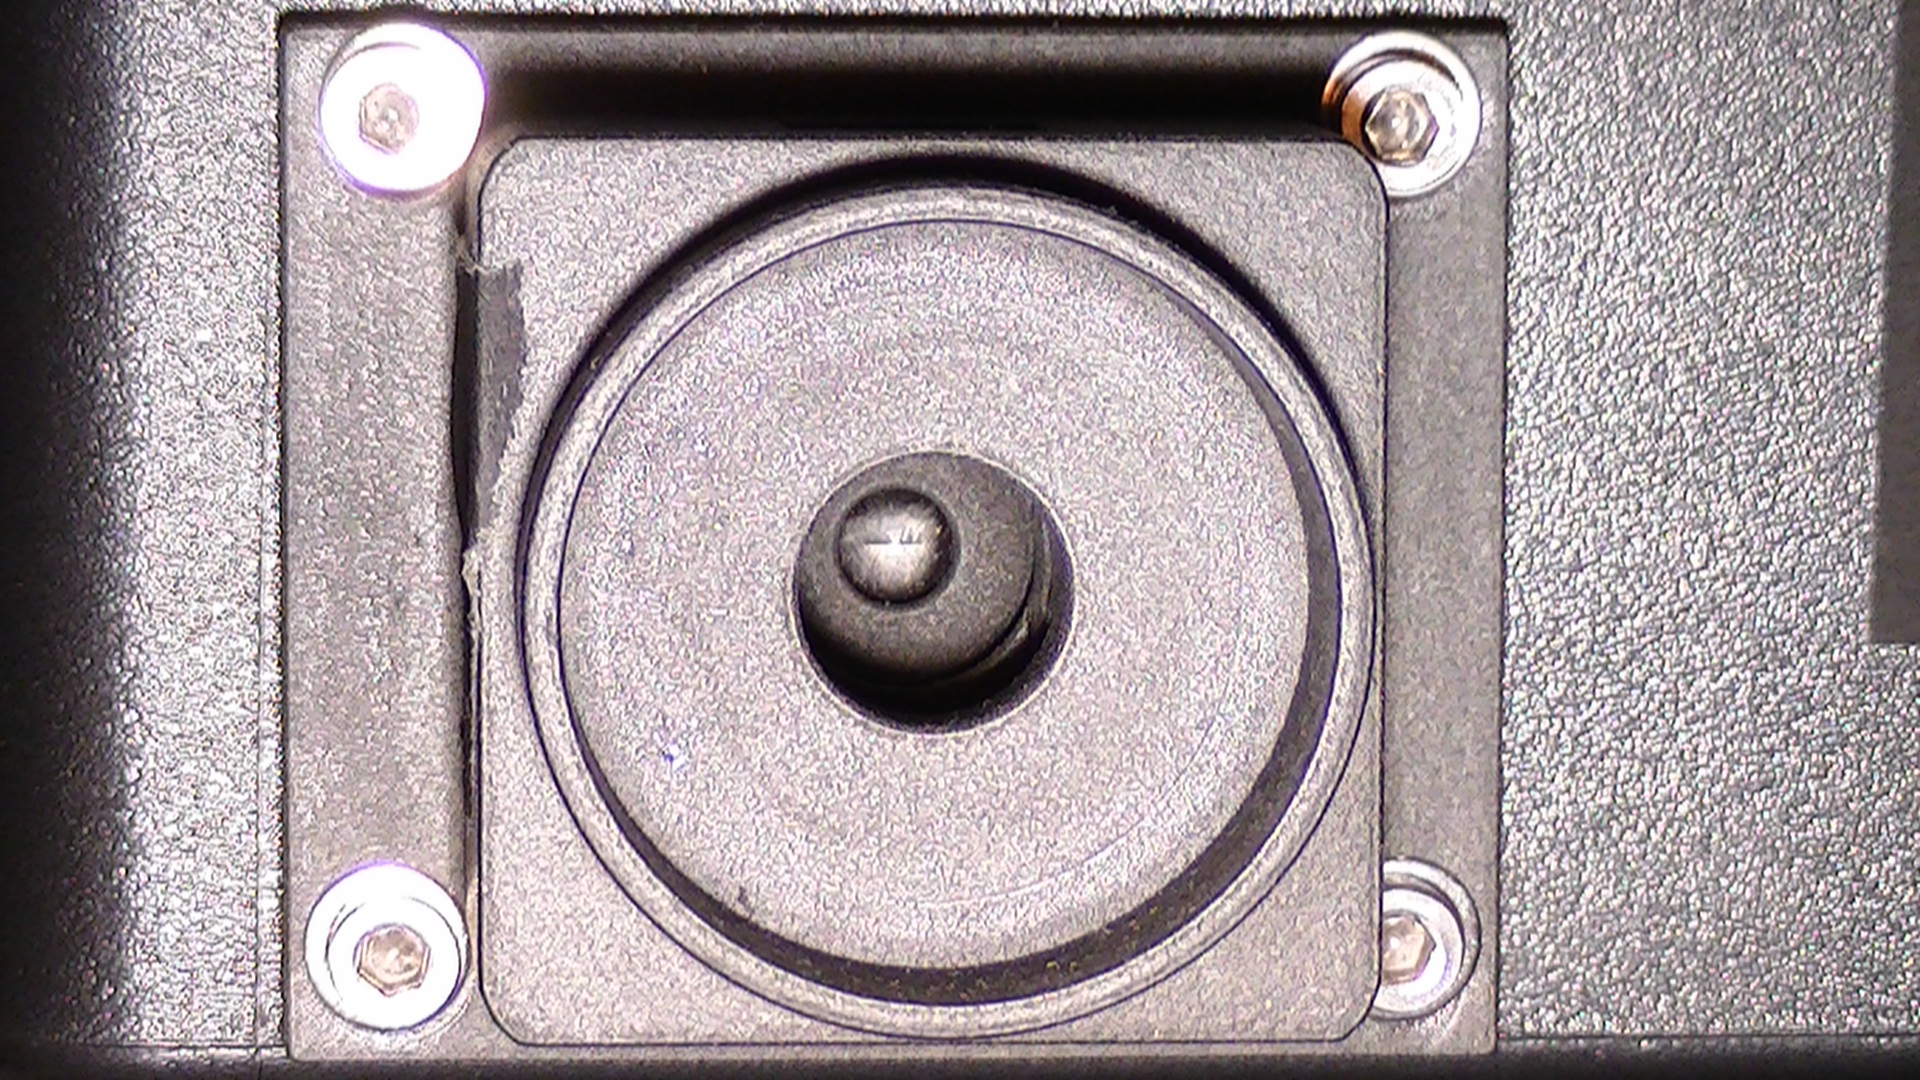
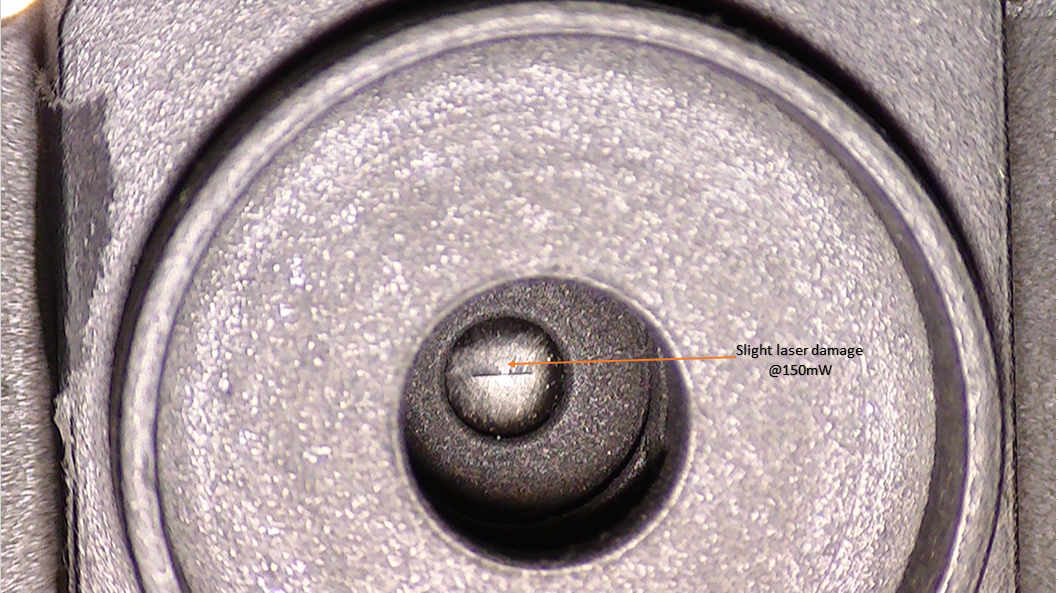
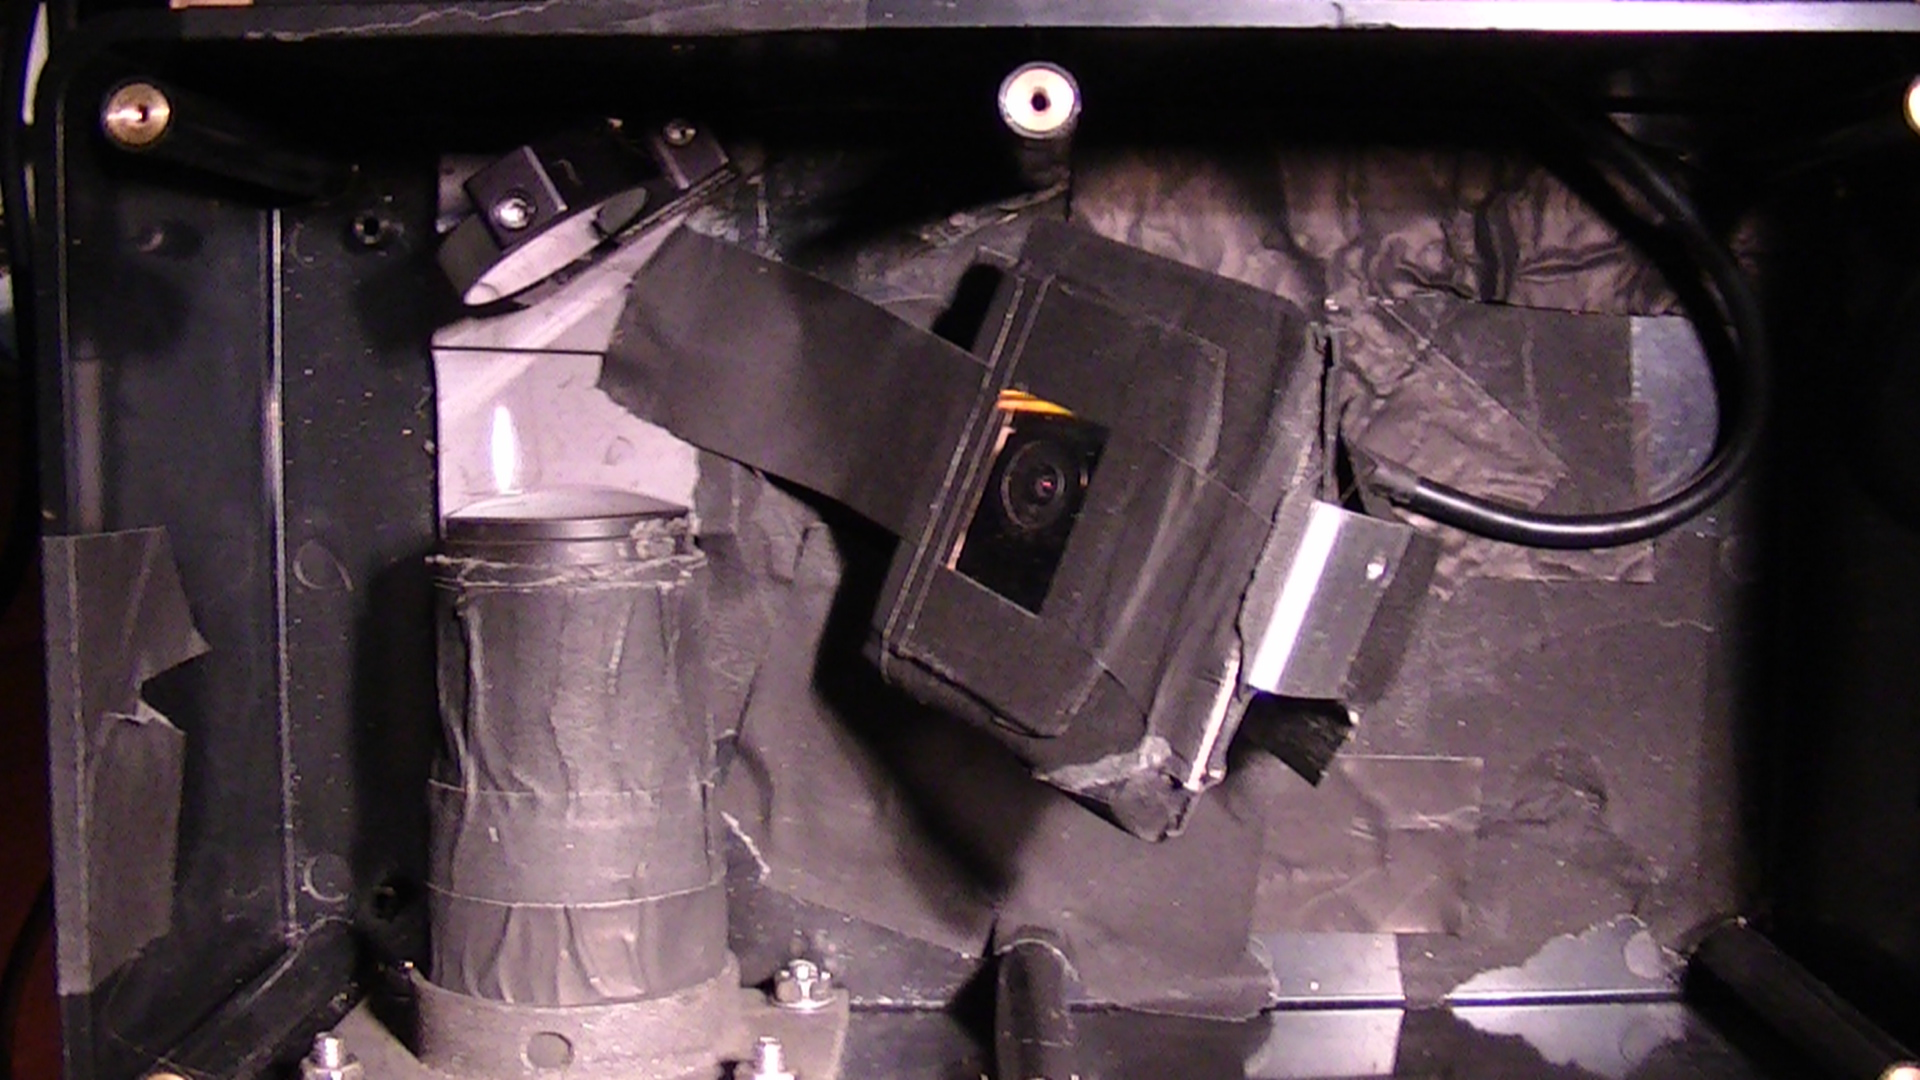
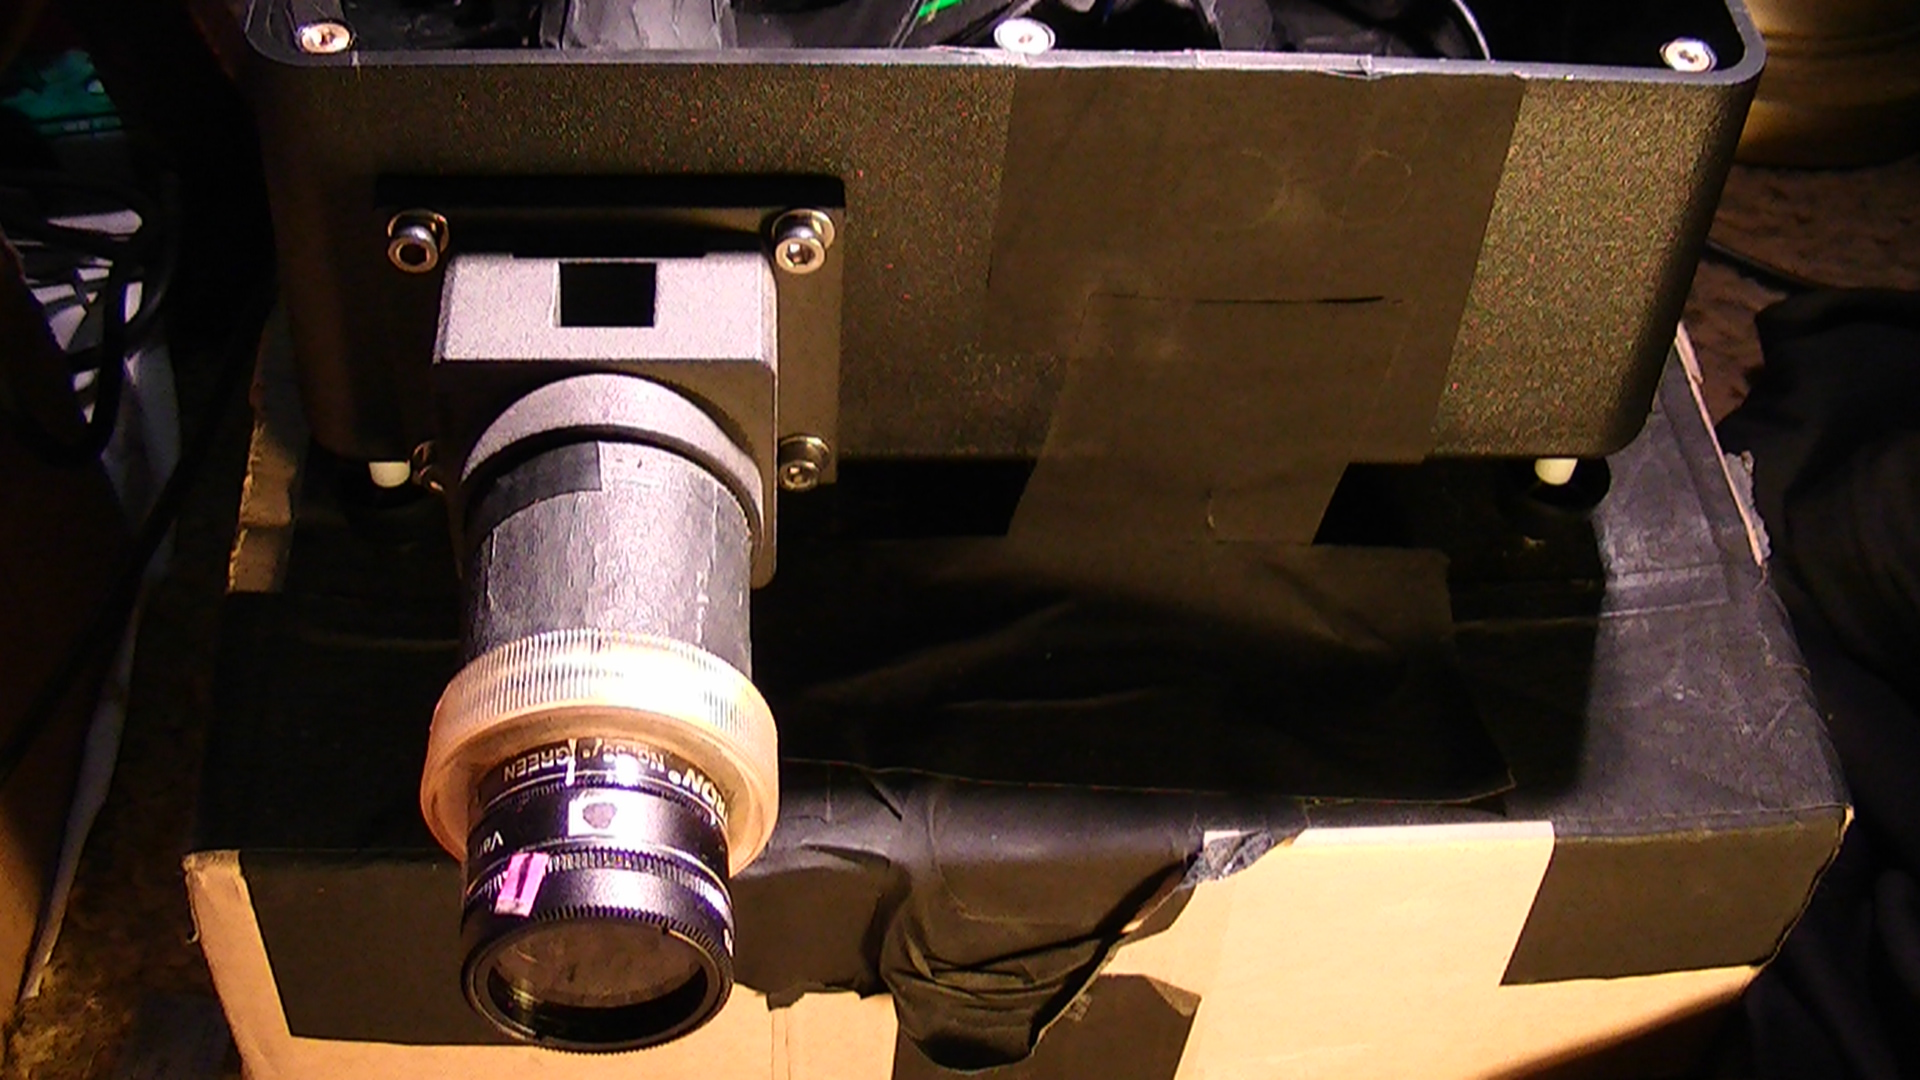
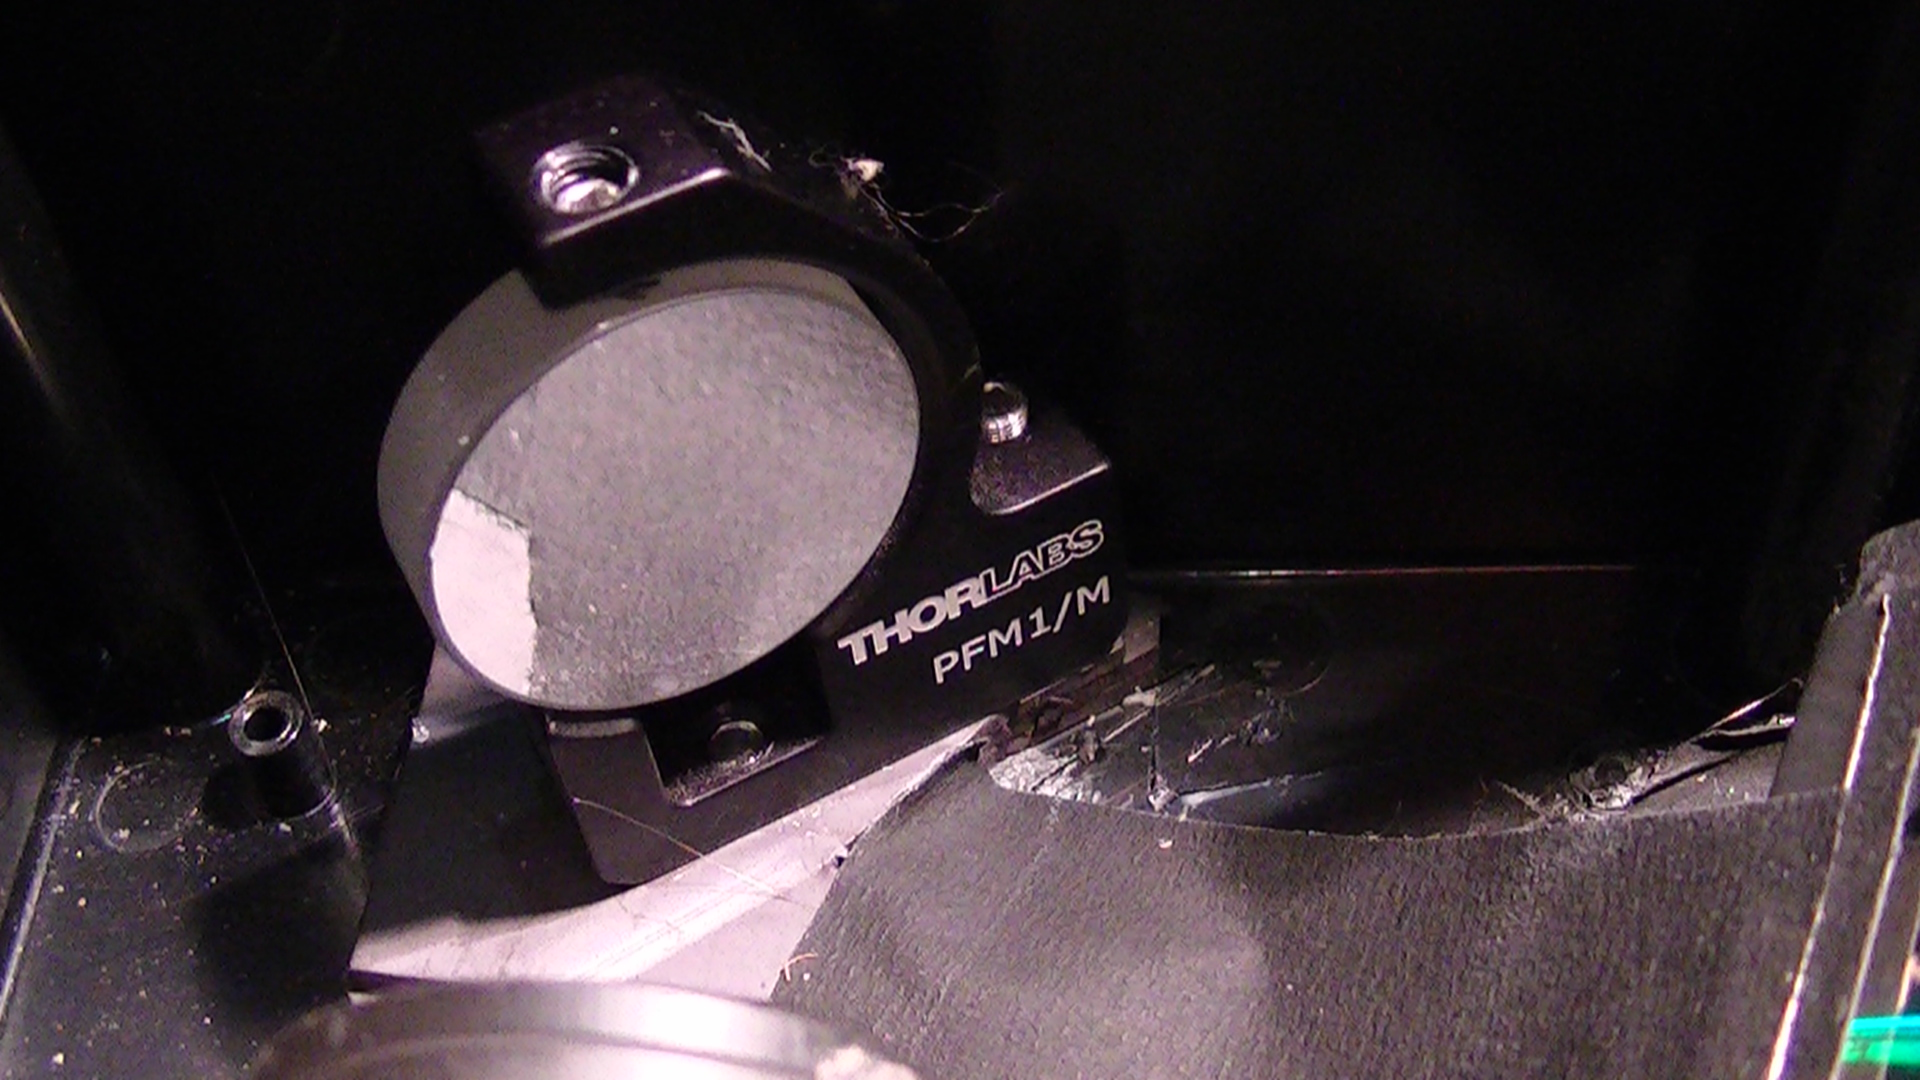
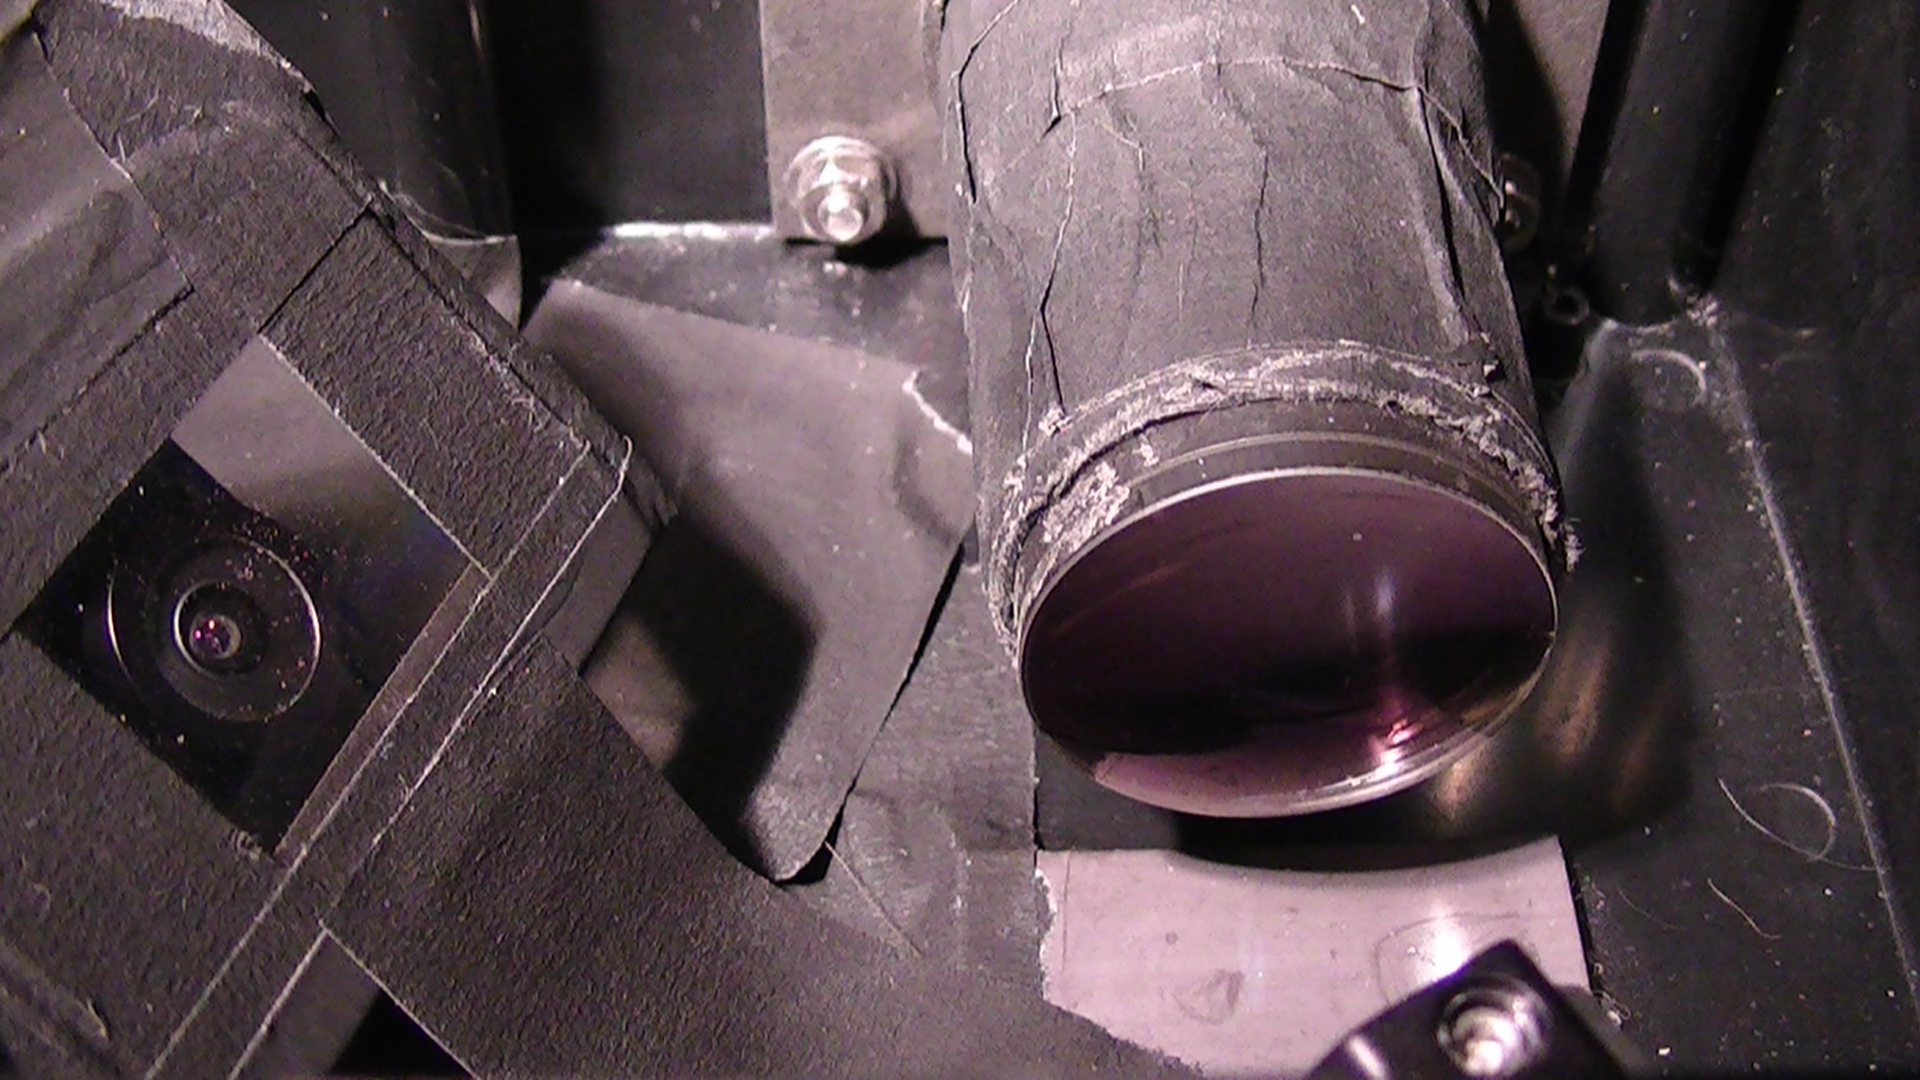
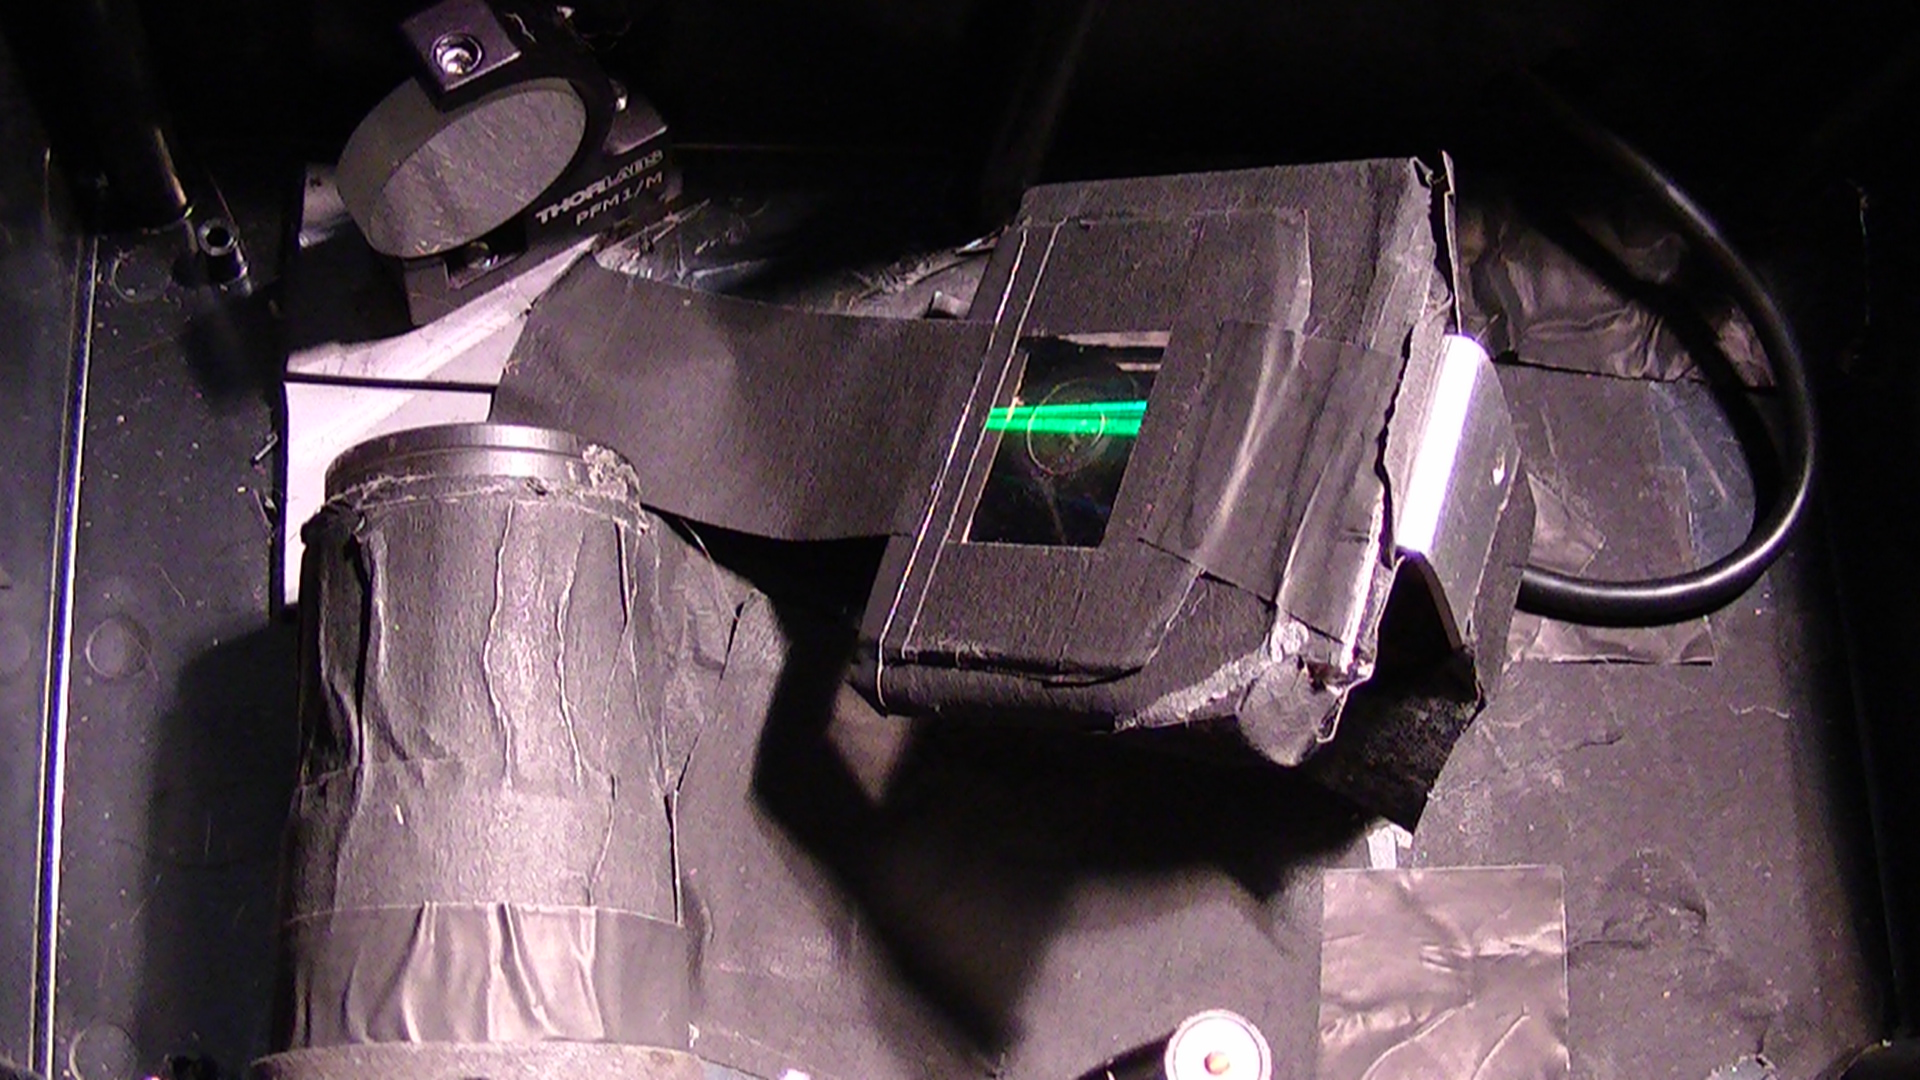
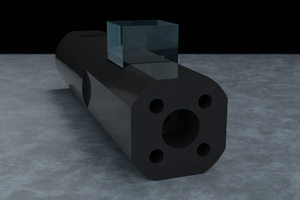
Laser collimation tube assembly;


The ZEN of simplicity
Making the Complex...Seem Simple
To make the experience fit your profile, pick a username and tell us what interests you.
We found and based on your interests.
*UPDATE* 01/10/2018 5:01PM
Specifications for the DAV5 V2.1 UV/VIS spectrometer:
( New spectrometer pic's coming soon)
new cmos webcam: ELP-USBFHD01M-L21
Sorry for the fuzzy pic...
Laser collimation tube assembly;
HD usbca,camera specsheet.pngThis is the spec sheet for the ELP 2 mega pixel cmos camera.Portable Network Graphics (PNG) - 60.41 kB - 12/25/2017 at 08:55 |
|
|
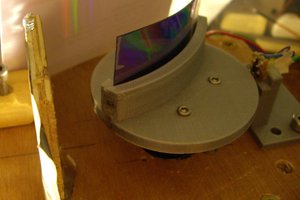
PIC_0888.JPGView#5 Front view of cuvette holder with quartz cuvette in place.JPEG Image - 808.58 kB - 12/25/2017 at 08:49 |
|
|
PIC_0867.JPGView#4 Back view of the 0.10mm slit mounted in the cuvette holder inlay.JPEG Image - 581.23 kB - 12/25/2017 at 08:47 |
|
|
PIC_0864.JPGView#3 3D printed collimation focusing tube assembly, houses the 32mm achromatic coated doublet focal lens and plano concave lens.JPEG Image - 487.29 kB - 12/25/2017 at 08:45 |
|
|
PIC_0861.JPGView#2 back view of 3D printed cuvette holder with 0.10mm mounted slit. The back plate on the cuvette holder has an inlay to accomodate the mounted slit.JPEG Image - 599.51 kB - 12/25/2017 at 08:43 |
|
|
Ok, a lot is going on here, so 1st my latest plots using the new Ocean Optics slit I purchased from Ebay. 200um $49.00 US. no too bad really, great service too. A quick recap on the calculations;
Rd - 1 X 200um X 1540 = 308
F = 532/308 = 1.72
Rd = 1.72nm
Resolution = 1.72nm
I'll verify this again through my 150mW laser but for now I have corrected a mistake on my part using the wrong slit width from before ( 100um, this was severly cutting my wavelength range and did not match my diffraction grating spacing.)
Here are the 1st set of plots:
Above Raw data captured on RSpec
Above Synthesized color spectrum representing my new wavelength range
Above actual Solux spectrum
Above Calibrated spectral plot
Above as you can clearly tell from this plot, the spectrum from the 100um slit has a far shorter wavelength range than the 200um spectrum. Notice the laws of physics at play here ( I get a longer wavelength range but give up a little resolution at certain wavelengths but make up for it in others, namely the full range of my dichrotic focal mirror 400 - 750nm.
Ok, in this plot I have included a scan from my 8-bit CCD detector, damn thing is full of bugs, need some help from people with far more experience in CCD's than me, but this was a good scan using a Tactical flashlight and the 200um slit width ( before I changed it to the cmos spectrometer.)
I cut off the CCD spectrum to fit this plot, the TCD1304 has 3647 pixels to play with the cmos has only 2048. The problem I'm having with the CCD is, exposure time, I can't get above 3ms and I can't figure out what to do about it, I have tried to re-calibrate the CCD, tweak to capture software and nothing works? I have also tried various filters, neutral grey, variable polarizing filters, the problem with filtering too much is you will eliminate some of the spectrum itself, so I am beside myself...
Is this because the CCD is 8 bit or does the capture software have to be more advanced in it's processing?
Please advise!
I'm pretty sure this is the limit for this piece of equipment, so I may have to change the V2.1 to V2.7 :) That was the original goal, knowing I was using a DVD as my diffraction grating. I will explain a little more later, so here are the latest plots:
This 1st plot shows my instrument response curve which I can implement in real time as I am shooting spectral frames, I was able to construct a response curve effectively because I was able to shut off white balance and gamma correction on the cmos camera.
This same procedure is also done for the 8-bit CCD detector.
Here is the raw spectral data for the Solux lamp before smoothing:
Now this is the raw data with the sample (Holmium oxide and the Solux lamp as reference spectrum,) you notice the reference spectrum is smoothed out because it was processed from the raw spectral data after correction from the instrument response curve.
Now this reference spectrum can be used for other absorption spectra as long as the same conditions are met, since this light source has a steady enough broadband intensity spectra.
And so this is our final product, a 2.70nm resolution calibration of our spectrometer using Holmium oxide as our calibration standard.
I will be updating all pics, both of the spectrometer and laser collimation tube assembly since it has changed since the last pics I posted.
@Ted Yapo he wanted to know; "Can you verify/estimate that this spectrum is close to a 6500K color temperature?"
And the answer is yes, in RSpec I just figured it out, so I'll just get right to it and then explain the concepts behind it afterwards.
Ok, there's a lot going on here, 1st is the Planck's spectral blue line, which is our "black body," this is our reference spectra @ 6500k. My CFL lamp has been calibrated to this reference and is accurate because my spectrometer has already been calibrated for instrument response.
To the far left you see the 2nd Y axis Refer. This is our ratio between red and blue light, because blue is our shorter wavelength which are hotter and red are longer wavelengths which are much cooler. Since we can use the computer to do the math we can use wavelength's as our measurements instead of blue and red filters.
We convert Angstroms to Nanometers and get 447nm for blue and 616nm for red, these are the calibration points. The program already did the calculations and found the ratio to be 1.050 but on my calculator I got 1.055? The difference between 6500k and 6160.
This is not written in stone mind you, but is still accurate because the temperature of any bulb will change somewhat ( called "drift") over time. just like the Sun does, it's temp (surface,) is around 5400K but changes because of many variables.
Above are both my 2300k and 6500k CFL bulbs, I didn't bother calculating the 2300k bulb as I felt it was irrelevant. Still a good comparison since both are at the same intensity. You notice the 6500k CFL's blue zone is much hotter than the 2300k's CFL. That's the manufacturer trying to simulate daylight...Ha!
Not that I'm giving a shameless plug to the Solux company, but their Halogen bulbs are far superior in these regards.
I hope this helped answer your question Ted, and anyone else out here that is interested in this subject :)
01/07/2018 4:39:PM
Final resolution tests for this series of alignment testing.
1st plot is the raw data file from RSpec scan 1a;
2nd plot is the Guassian intensity distribution in order to show our FWHM data;
Next plot is the final product cleaned up in my processing software Spectragryph 1.2.7;
As you might notice in the plot above, I included the un-calibrated spectrum so you can have a visual representation of "bandwidth," my spectrometer at the moment, has a spectral bandwidth of 27.2nm, typical bandwidths for lab grade equipment usually ranges from <20nm, with a resolution factor of not >1nm.
So, lets check out some math here and see if perhaps if its possible to achieve this with a cmos camera?
*note, I know I can do this with the 8-bit CCD using the TCD1304 chip, but right now it is in major re-design ( internal optical setup) yes, I am acquiescing to an Ocean Optics design for dispersion instead, only because "Flat-cat's" setup seemed to work better.
As you can see in the equations above, these are "theoretical" #'s, I already know my angle of incidence for my diffraction grating which is close to 27 deg and a focal distance of 100mm. Lets plug these #'s in and see what we get using my set up;
d = 1mm/1540gr X 10(6) = 649.35nm/gr
W = 100micrometers X 10(-3) = 0.10mm
F = 100mm
Rd = 649.35/100mm
Rd = 6.493
BP = 0.10 X 6.493
BP = 0.649 nm
Not the best in the world but certainly not the worst either, armed with this knowledge you can effectively choose the exact slit width to suit your needs.
The full presentation can be found here:
Well, using my homemade laser collimation tube assembly and a glass cuvette filled with 99.9% pure Isopropyl alcohol, I shot a <5mW laser thru it to get an idea of my spectrometer's real resolving power and here are the results;
This is the raw data captured from RSpec;
This is the FWHM data;
This is the calibrated spectrum;
RSpec has an advanced feature for processing your spectral image captures, you can split the spectral video into individual BMP frames, then it lets you pick which frames you want to keep and makes a new video from those new frames.
The results are a much cleaner and more precise spectral image as I will show you with my absorption scan of Holmium oxide below.
This is the raw data from RSpec showing the calibrated absorption peaks after processing 46 frames out of a total of 68.
The plot above shows both an original image capture with frame processing and the 2nd scan with frame processing, the difference is very clear and a lot more information can be squeezed out of your data.
I wanted to include this 3rd plot because I used my polarizing lens, opened @ 90%
Before dividing the sample by the reference
Updated; 12/31/2017 8:24:AM
Transmission % ( 3rd order regression RMS: 0.0843
UPDATE: 12/30/2017 4:25:AM
Raw data;
Png image of Holmium oxide spectrum;
Raw data both reference spectrum and sample spectrum;
Absorbance %;
Transmission %;
This figure is arrived at by averaging the 5 major peaks wavelength values; 1) 413.39
2) 447.9 3) 483.4 4) 534.67 5) 640.18 and inserting them into this equation;
1 X slit width X ln/mm (diffraction grating) = spectral band width
R = wavelength / spectral bandwidth
= Resolution
So, we work this equation for each of our peak wavelengths and average it out to get our spectral resolution.
Example;
1st peak; 413.39nm
1 X .10 X 1540 = 154
R = 413.39/ 154 =2.68
R = 2.68nm
We do this for the rest of our peaks and then average them out to get our final result
R = 3.2nm
:)
This is a how you calibrate your spectrometer, with a known certified standard like the one I use ( Holmium oxide #2034,) certified by the NIST. I have pics of it on my Raman spectrometer project, but I wanted to know what my calibrated spectral range is on this particular spectrometer and here are the results.
These are the 2 actual spectral images:
*Updated* 12/25/17 @ 2:34:PM
I re-scanned my Holmium oxide sample and re-calibrated it to get a sharper spectral image and got a better quadradic fit and "truer" data points:
The light source is my Solux 4700K broad band lamp.
Above is the raw data which is the reference (Solux lamp) and the sample (Holmium oxide sample)
These are the results after dividing the sample by the reference spectrum.
This is the data results from the division, to the left is the observed peaks (mine,) and the expected peaks which are the Holmium oxide standard peaks.
Not bad for an amature :)
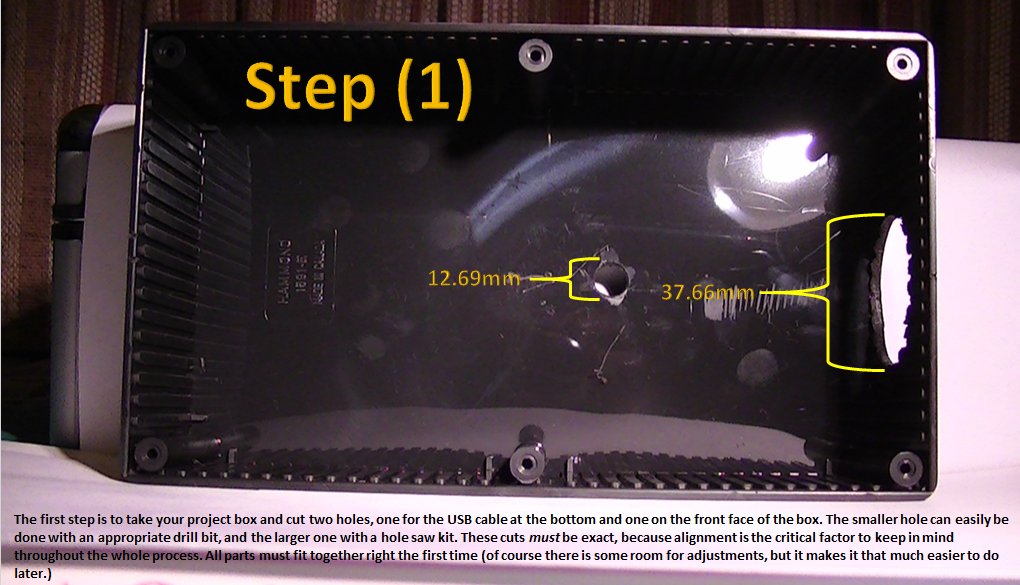
Here are the step by step instructions for building the spectrometer that I am using at this moment.
http://publiclab.org/notes/dhaffnersr/08-09-2016/build-instructions-for-the-dh-4-0-v4-spectrometer
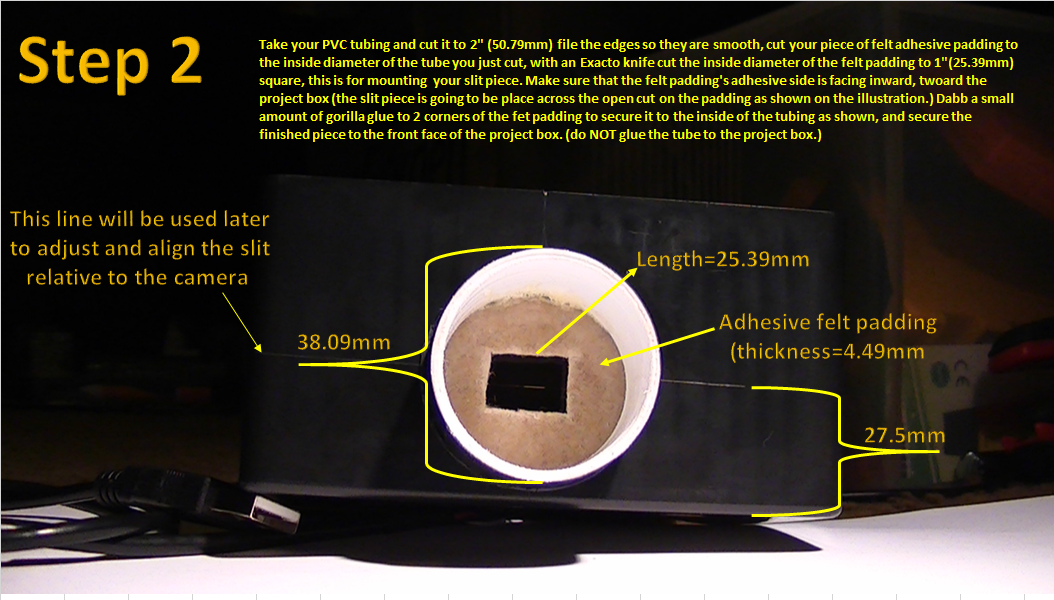
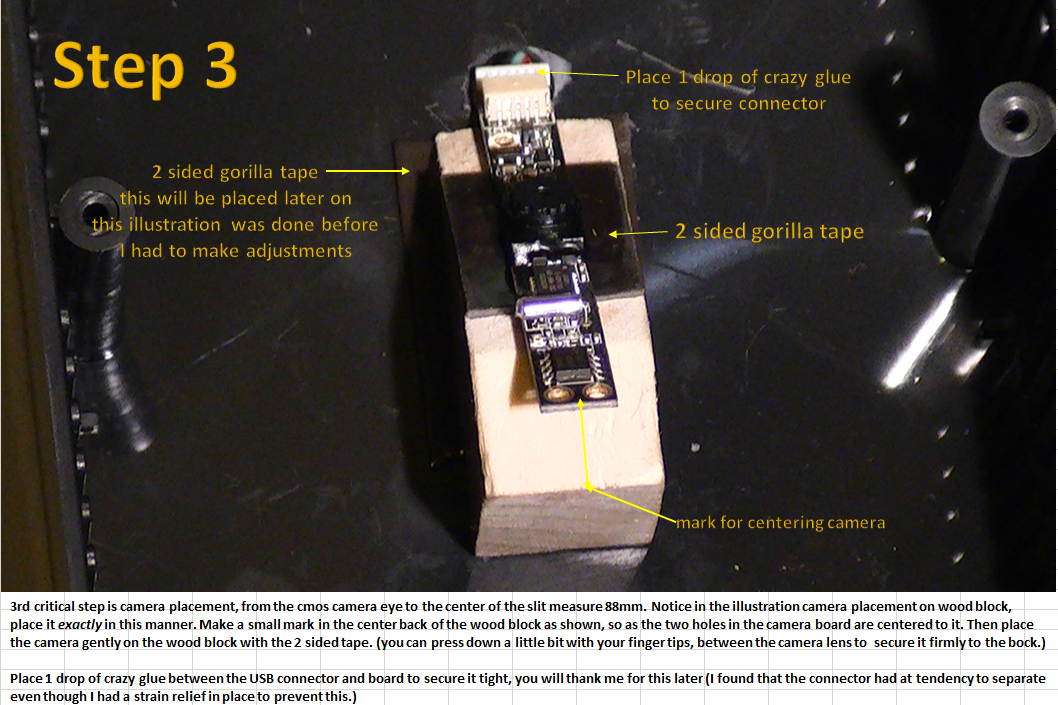
Create an account to leave a comment. Already have an account? Log In.
Become a member to follow this project and never miss any updates
By using our website and services, you expressly agree to the placement of our performance, functionality, and advertising cookies. Learn More
 Wriju
Wriju
 David H Haffner Sr
 andreas.betz