 David H Haffner Sr
UPDATE: 12/30/2017 4:25:AM
Raw data;
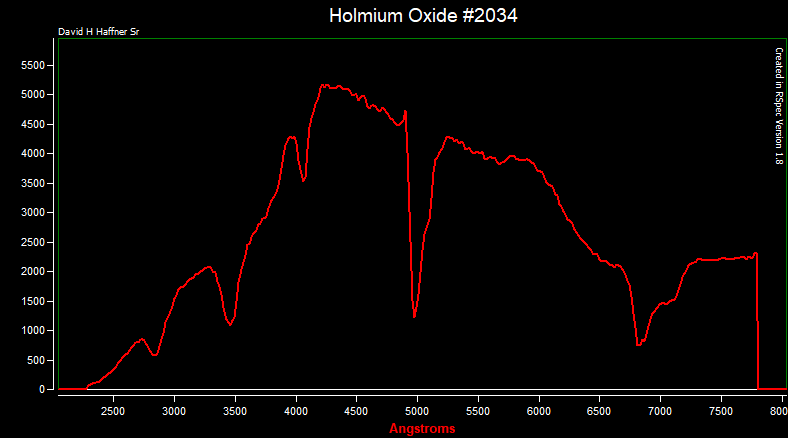
Png image of Holmium oxide spectrum;
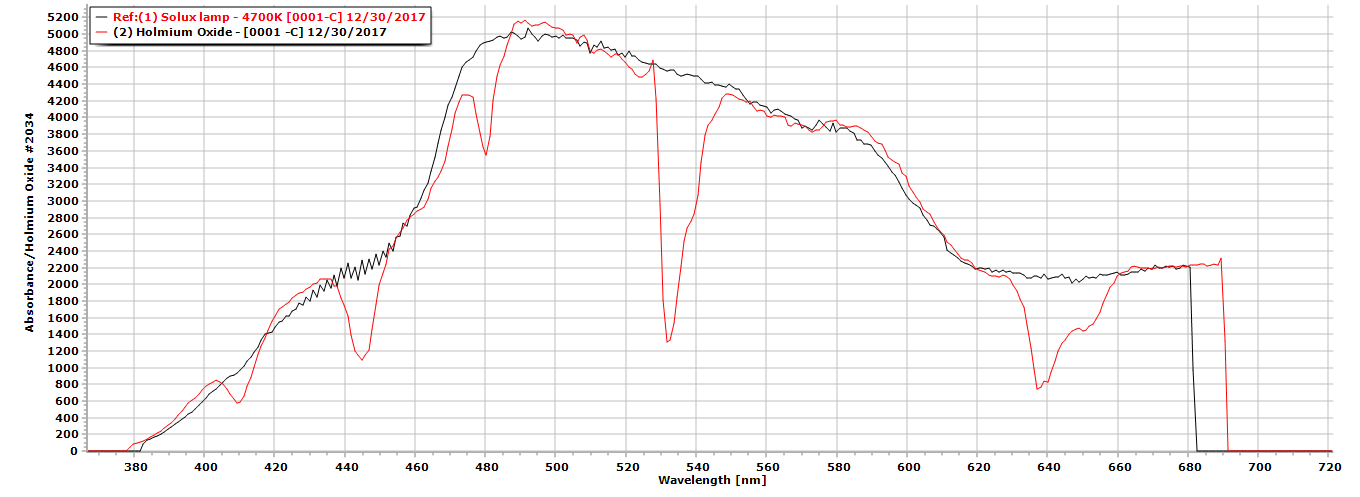
Raw data both reference spectrum and sample spectrum;
Absorbance %;

Transmission %;
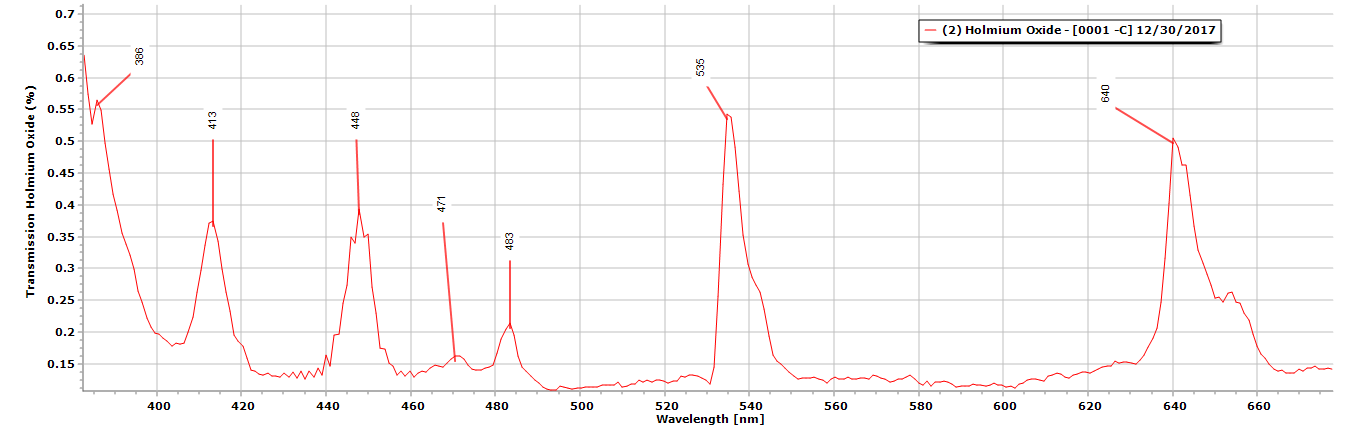
This figure is arrived at by averaging the 5 major peaks wavelength values; 1) 413.39
2) 447.9 3) 483.4 4) 534.67 5) 640.18 and inserting them into this equation;
1 X slit width X ln/mm (diffraction grating) = spectral band width
R = wavelength / spectral bandwidth
= Resolution
So, we work this equation for each of our peak wavelengths and average it out to get our spectral resolution.
Example;
1st peak; 413.39nm
1 X .10 X 1540 = 154
R = 413.39/ 154 =2.68
R = 2.68nm
We do this for the rest of our peaks and then average them out to get our final result
R = 3.2nm
:)
Discussions
Become a Hackaday.io Member
Create an account to leave a comment. Already have an account? Log In.