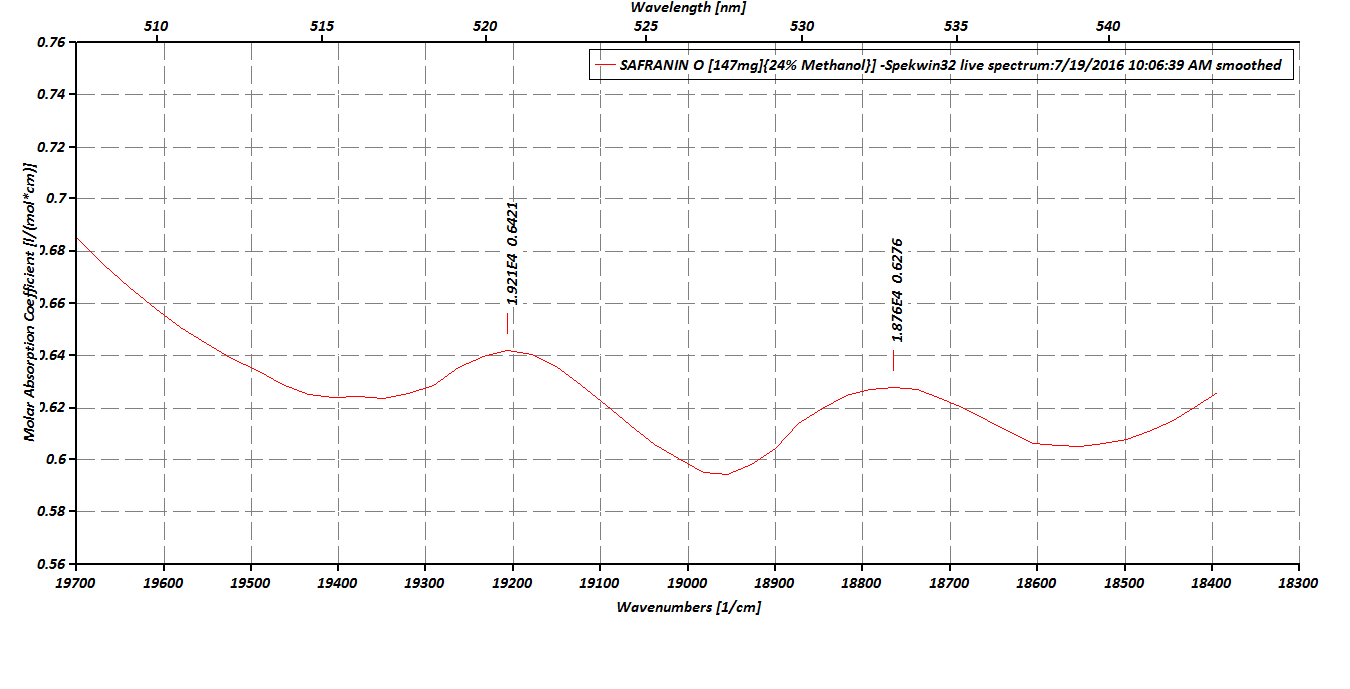
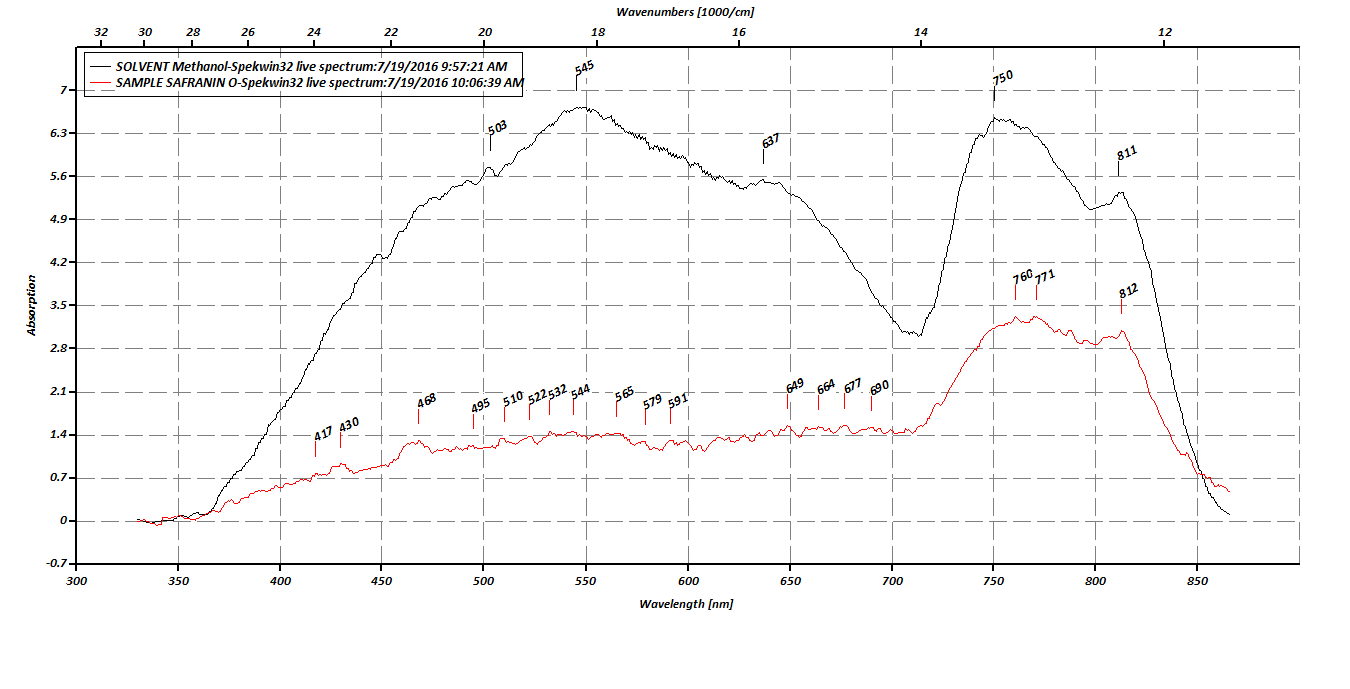
This is a fundamental tutorial using the Red dye Safranin O, to illustrate the steps for preforming absorption spectra, irregardless of whatever data processing software you are using or not.
I am using the Public Lab v2.5 Spectrometer to demonstrate these steps. The processing and capture software I used was Spekwin32 v172.2p5 proto type, although I know that Jeff @Warren and Dave @Stoft are working diligently to incorporate this feature into Spectral Workbench. I'm no graphic artist, so please bear with this presentation, I have made every effort to be as accurate as possible, but there can still be a margin of error.
I am presenting the basic set up here and will provide the link to the entire research note:


 David H Haffner Sr
Discussions
Become a Hackaday.io Member
Create an account to leave a comment. Already have an account? Log In.