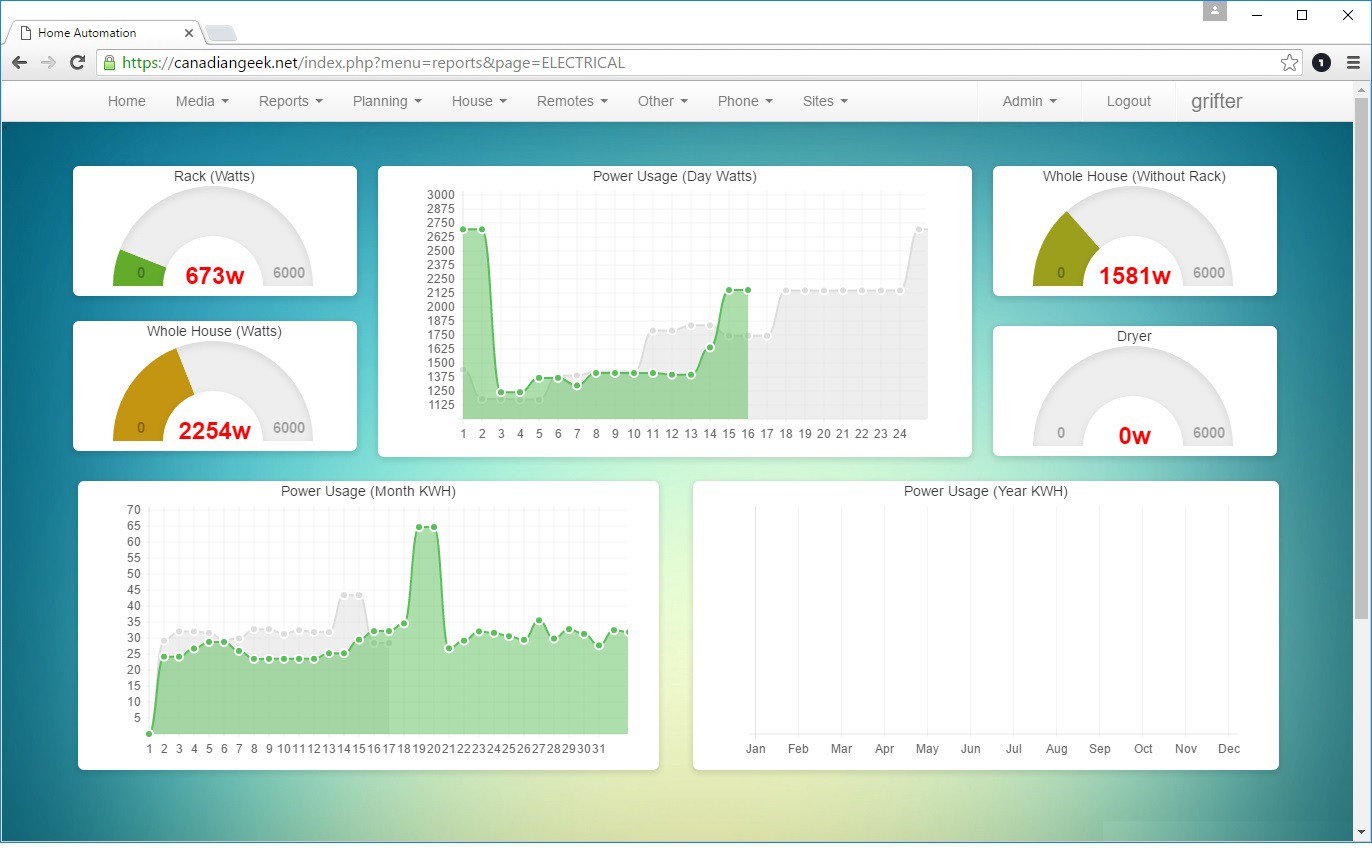
The reporting module has a series of graph plugins that can display any data logged to the database. Currently the reports cover
- Electricity usage
- Furnace Usage (how long it has run, daily, weekly, monthly, etc)
- Temperature graphs (inside vs outside)
- Water Usage (hot vs cold by time)
Discussions
Become a Hackaday.io Member
Create an account to leave a comment. Already have an account? Log In.