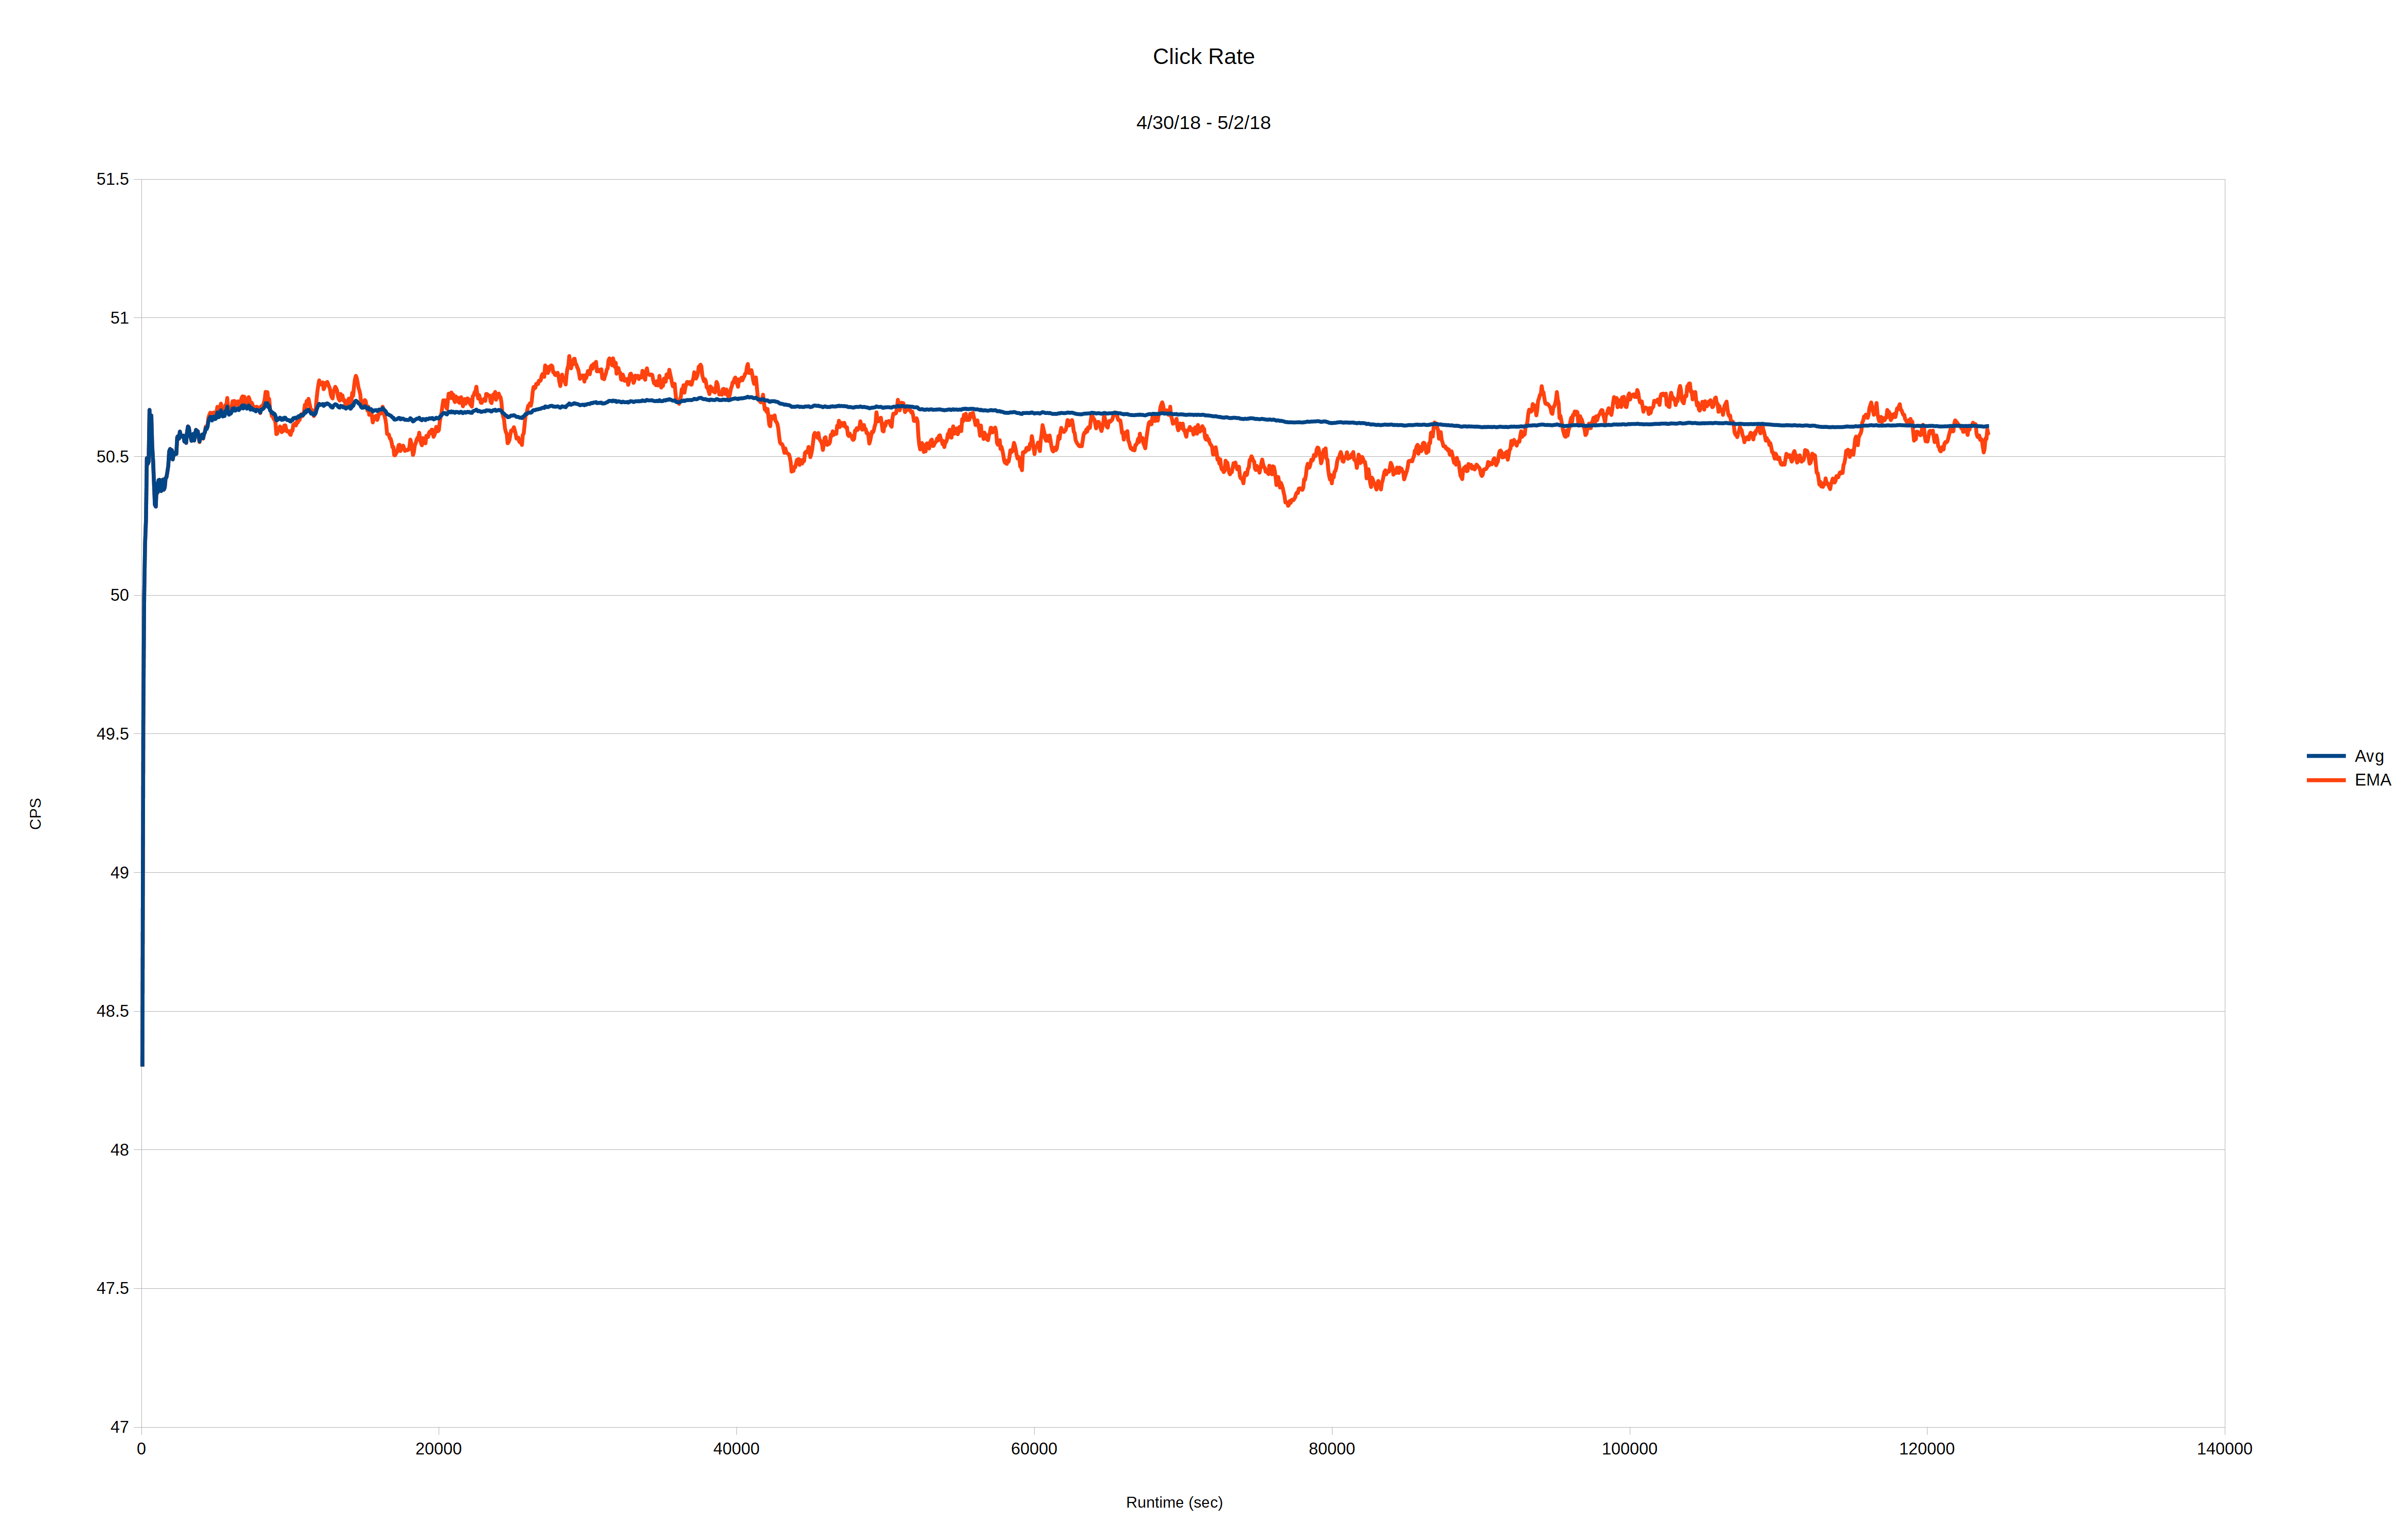
To test whether the slow decline in the click rate I saw in the several-hour run I talked about a few days ago, I did a much longer run using the same setup as last time. Here is the result:

As with the chart from the previous run, the blue line is the average number of clicks per second to that point in the run. The red line is the moving average with a decay of an hour. This run is ambiguous enough that I've decided to carry on with the experiment using a "hotter" 137Cs source Getting one could take a while, so in the meantime, I'll assume things will work out and plan to carry on with developing the code for the 1Hz timebase.
 Dave Ehnebuske
Discussions
Become a Hackaday.io Member
Create an account to leave a comment. Already have an account? Log In.