 Ben Hencke
With a bit of help from GNU Octave and an idea of which frequency bands are interesting, I can now play around with cross correlating the signals.
Here is the cross correlation output (xcorr) showing time offsets from negative on the left to positive on the right.
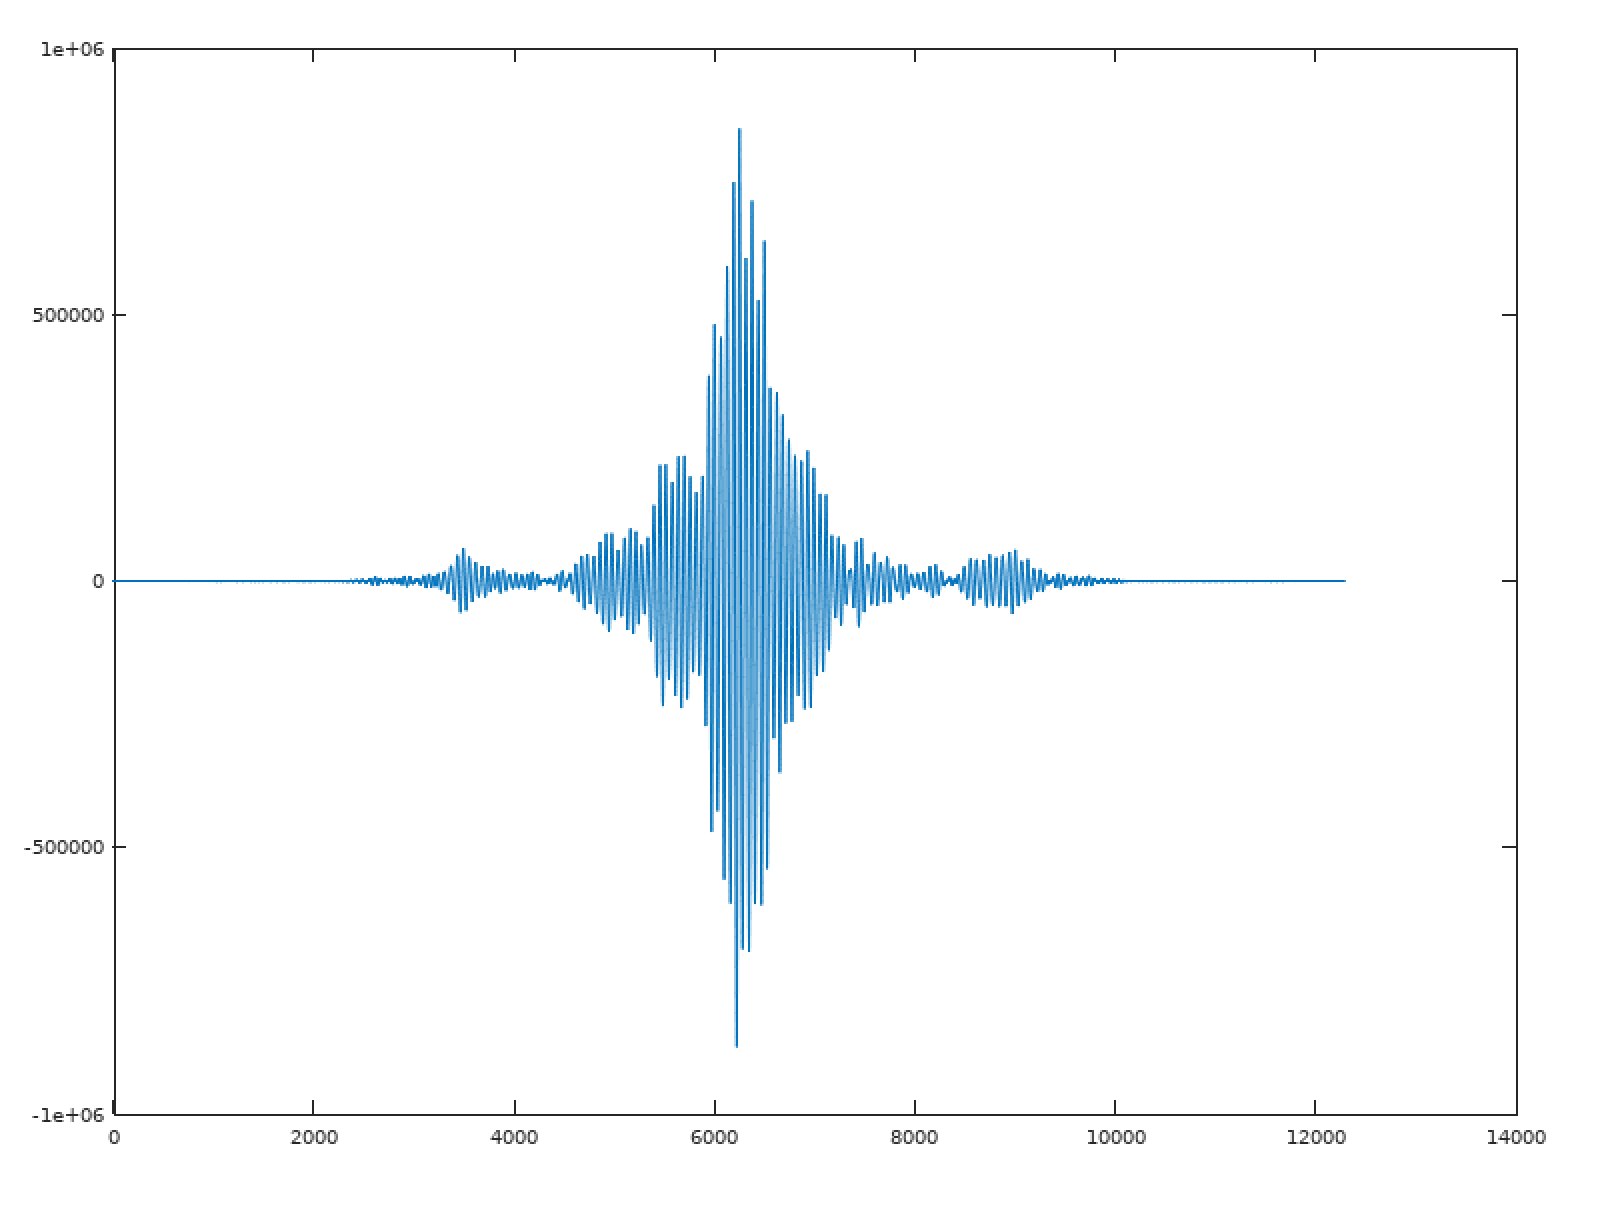
The interesting thing here is the positive peak. This indicates the delay where the signals most closely align.
To make things easier, I can make a function to find this delay:
function ret = findDelay(a,b)
  [R,lag] = xcorr(a,b);
  [v,i] = max(R);
  ret = i - length(a);
endfunction
To get an idea of what that looks like when applied back to the signals, I can plot the unaligned and aligned signal by shifting the second by the delay.
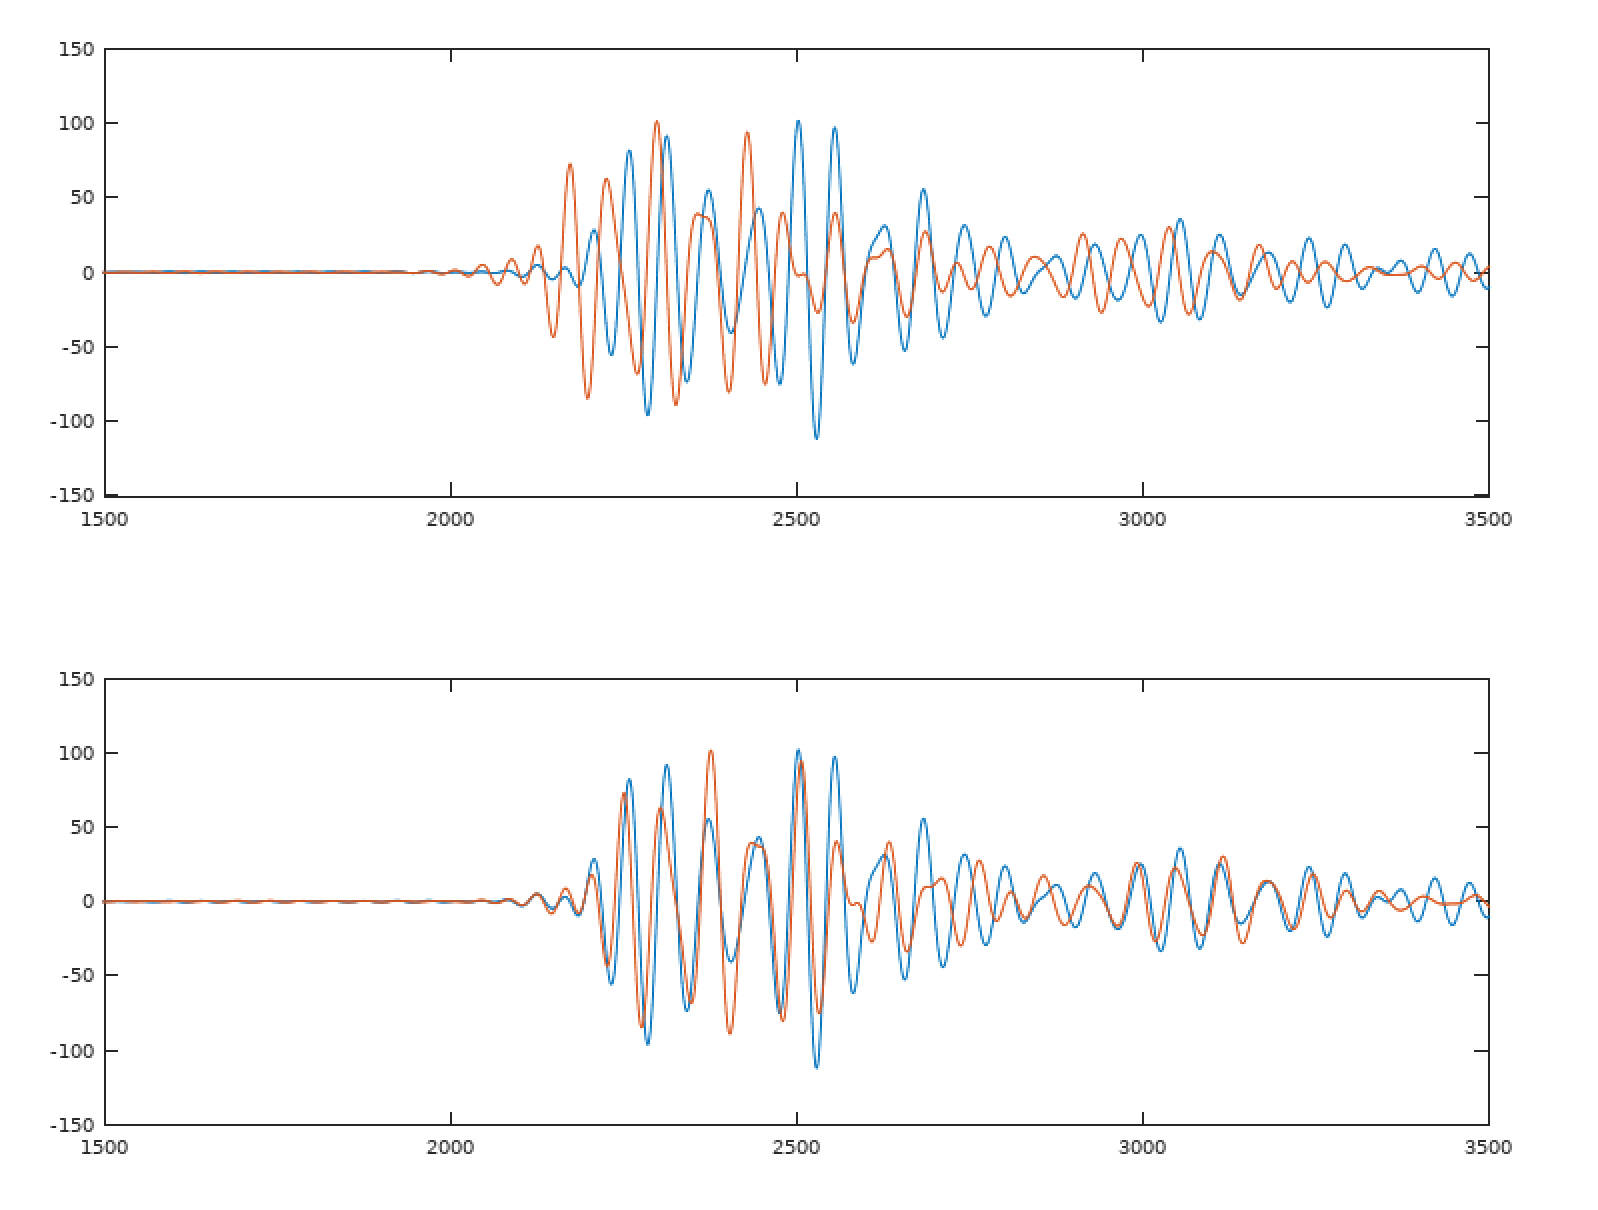
Looks pretty good!
Now theoretically this will work great, but to calculate all of this on the STM32 will be a lot of number crunching. Each channel needs to be filtered, which is currently 6k samples per channel, and a FIR filter of sufficient size needs to be created. Octave has me covered there too, and this article has everything I need to know about designing these filters. It will be an accuracy/CPU time trade-off.
Next I need to cross-correlate the signals, though I don't really need or want the full result, I only need the peak and the delay of the peak. Still, that is a lot of vector dot products to calculate. Maybe I can cheat and check at a lower resolution, find a rough match, then fine tune it.
Discussions
Become a Hackaday.io Member
Create an account to leave a comment. Already have an account? Log In.