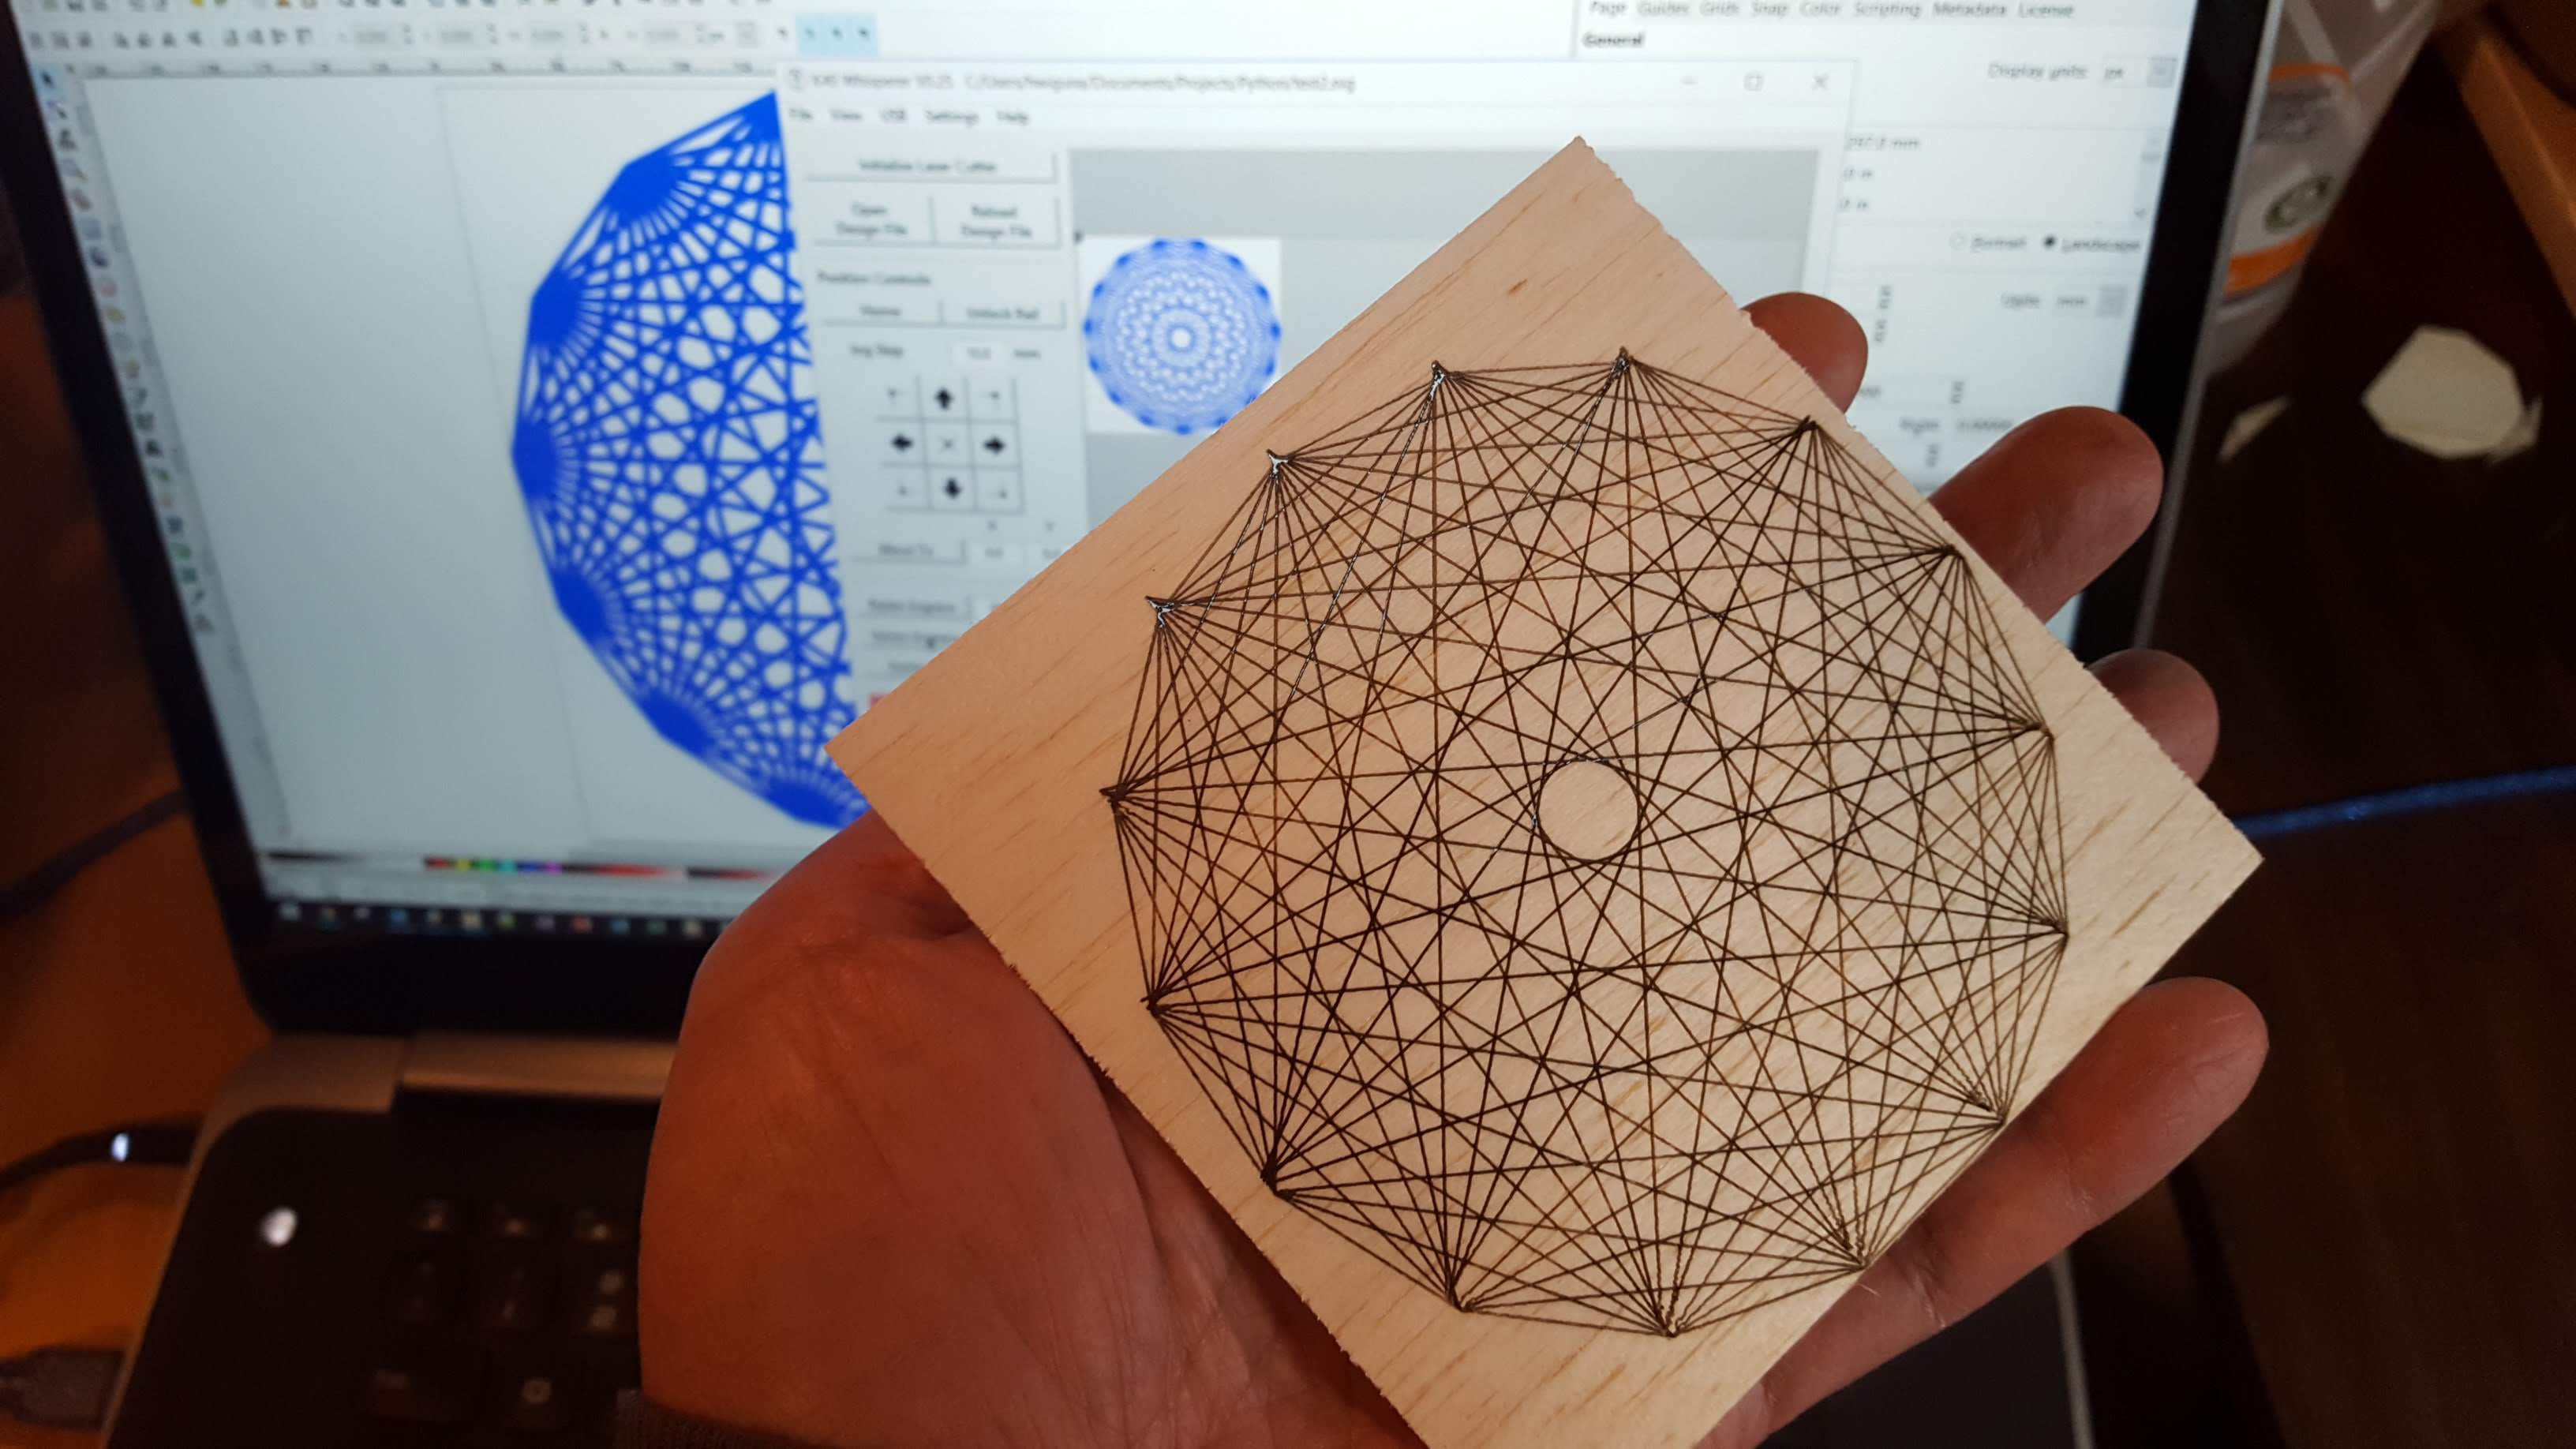
import svgwrite
import math

dwg = svgwrite.Drawing('test.svg', profile='tiny',width='100px',height='100px')

a = 0
n = 15
x0=50
y0=x0
r=x0
for i in range(0, n-1):
    a = 3.14*2 * i / n
    x = x0 + math.sin(a)*r
    y = y0 + math.cos(a)*r
    b=0
    for j in range(i+1, n):
        b = 3.14*2 * j / n
        x2 = x0 + math.sin(b)*r
        y2 = y0 + math.cos(b)*r
        print(i,j)
        dwg.add(dwg.line((x, y), (x2, y2), stroke=svgwrite.rgb(0, 0, 255, '%')))

dwg.save()
 Hari Wiguna
Discussions
Become a Hackaday.io Member
Create an account to leave a comment. Already have an account? Log In.