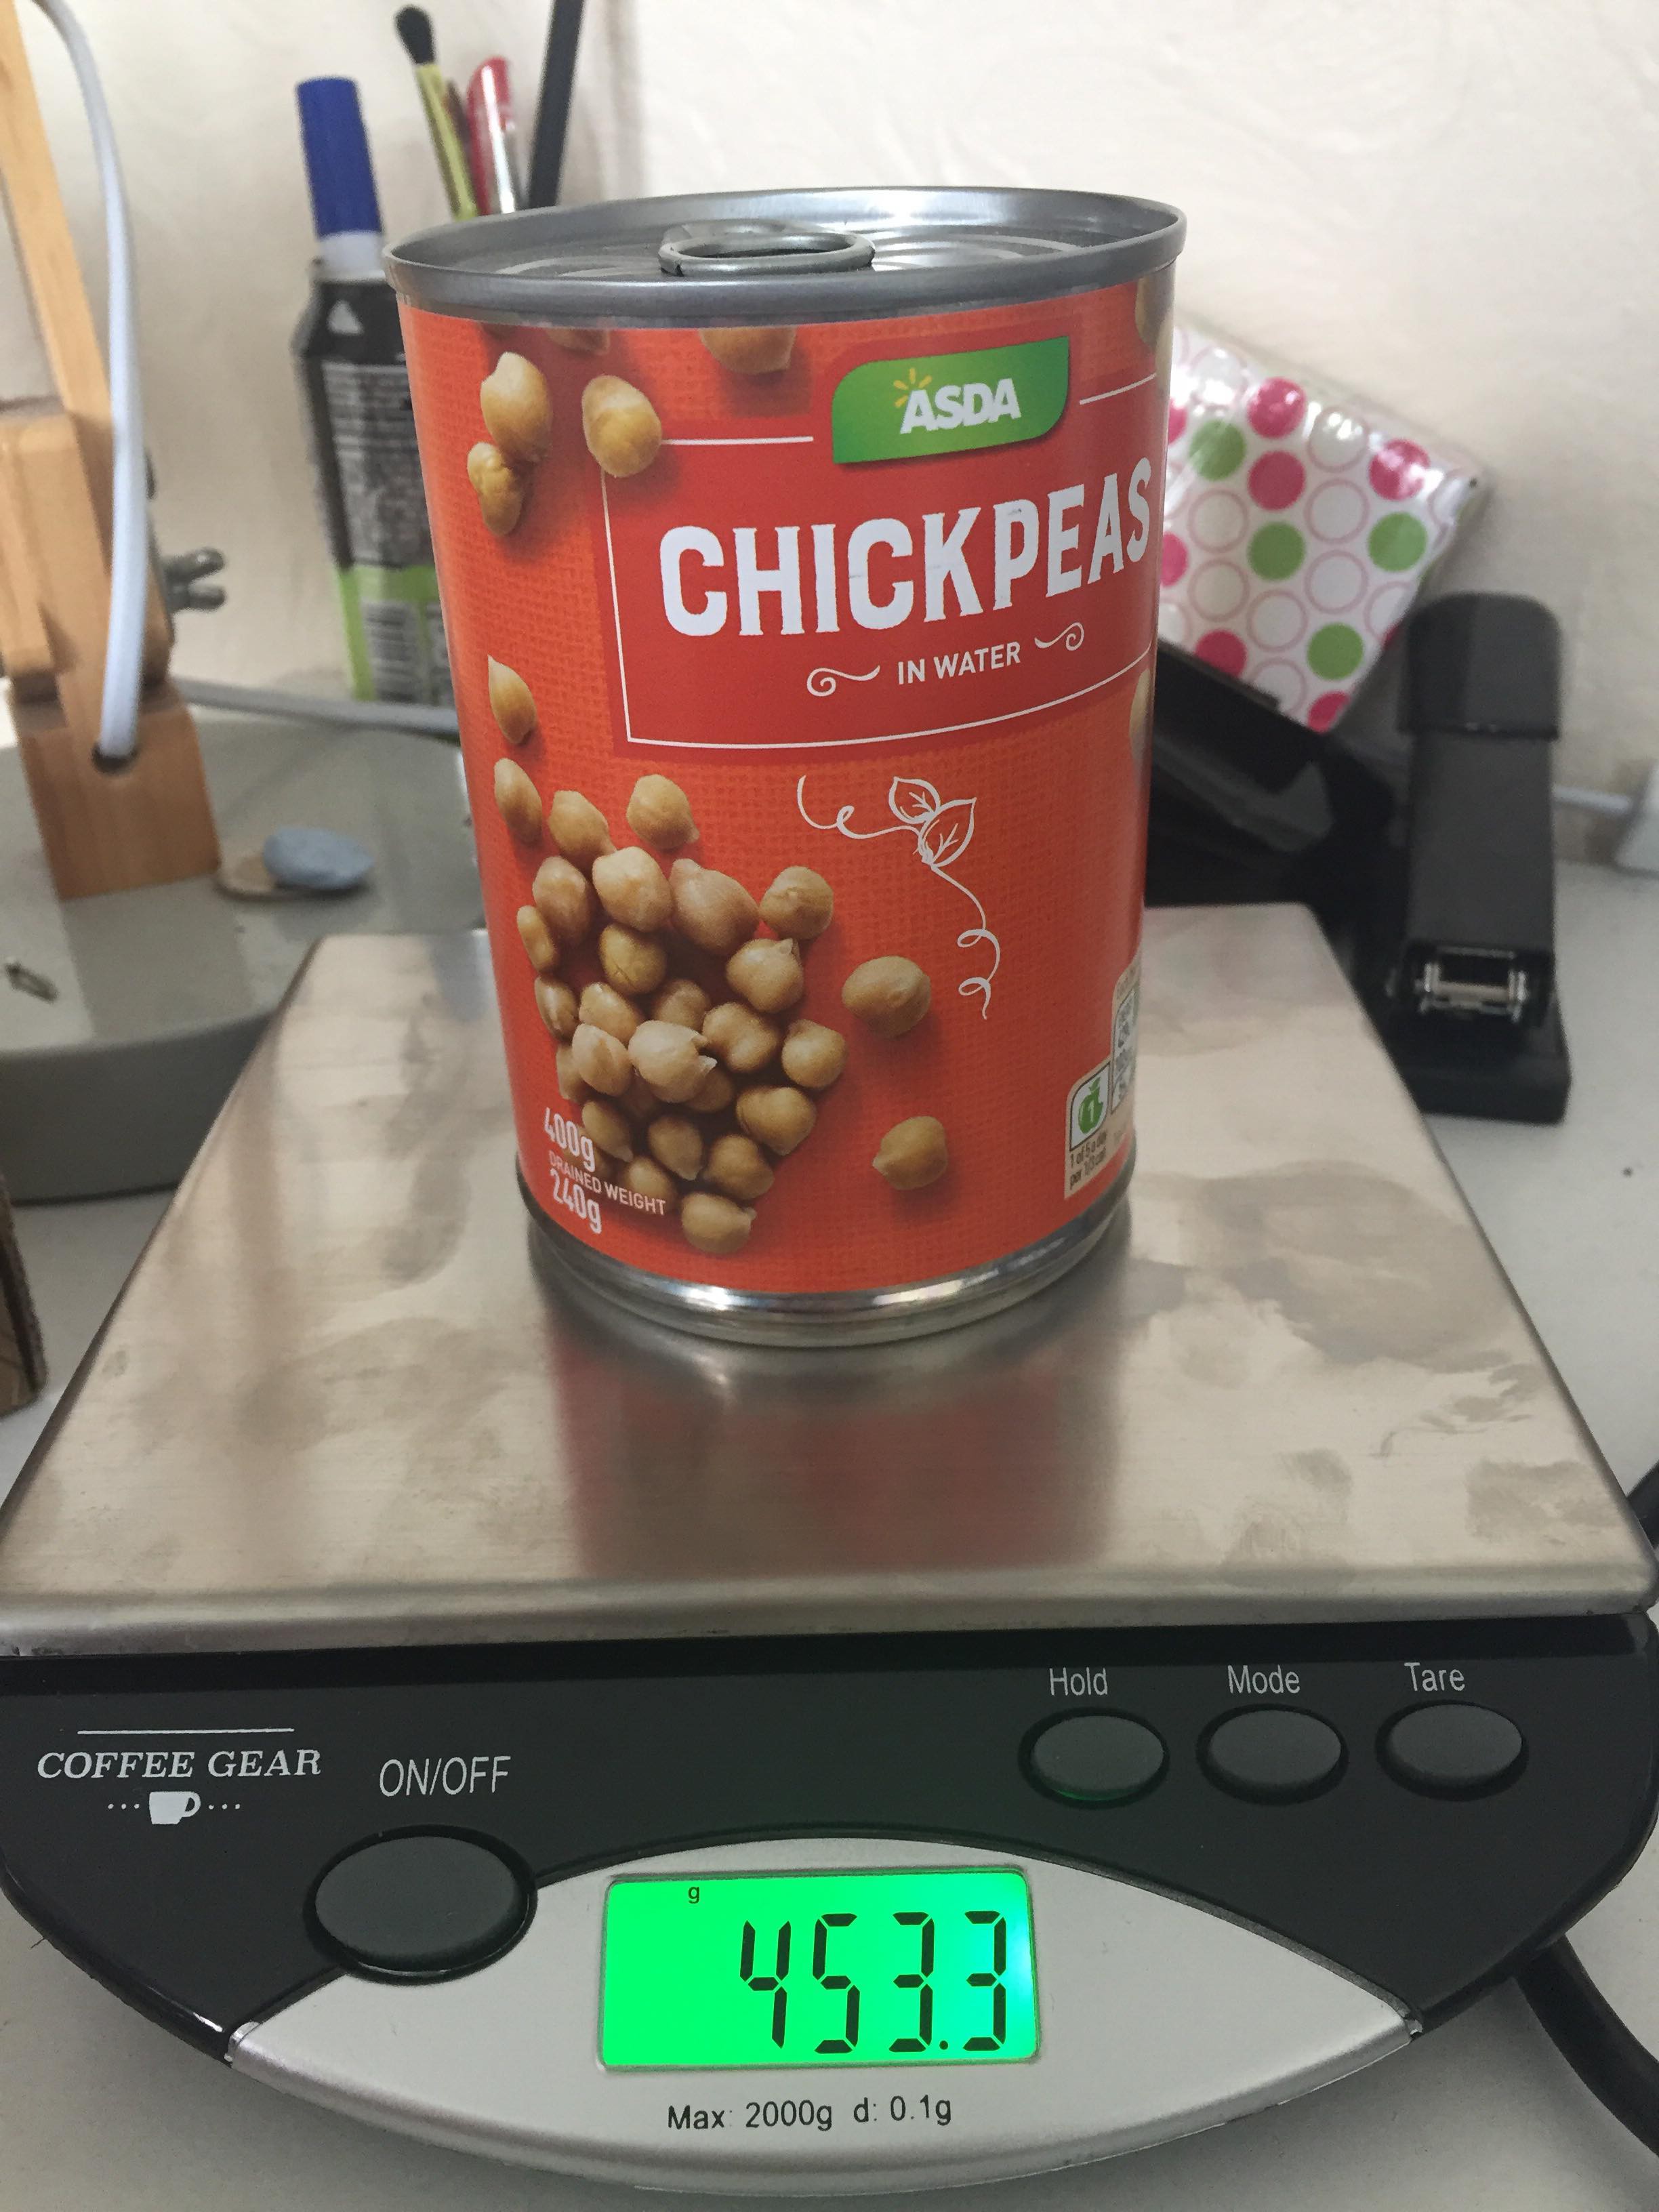
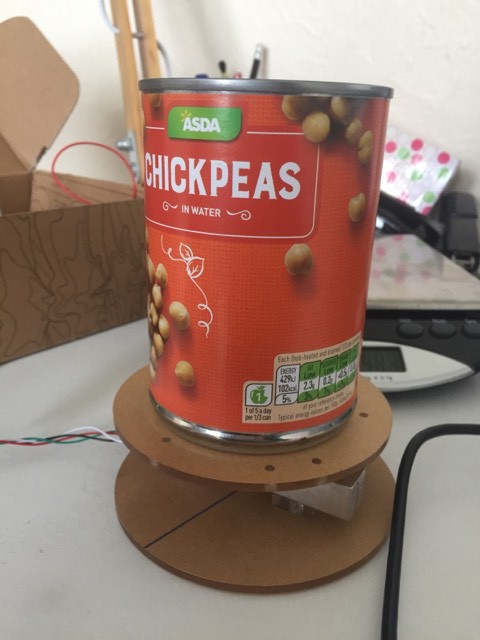
In order to gain a better understanding how accurate my load cell was at measuring weights. Firstly, I found the weight of various items (one example was a can of chickpeas) on a commercial weighing scales as seen below.
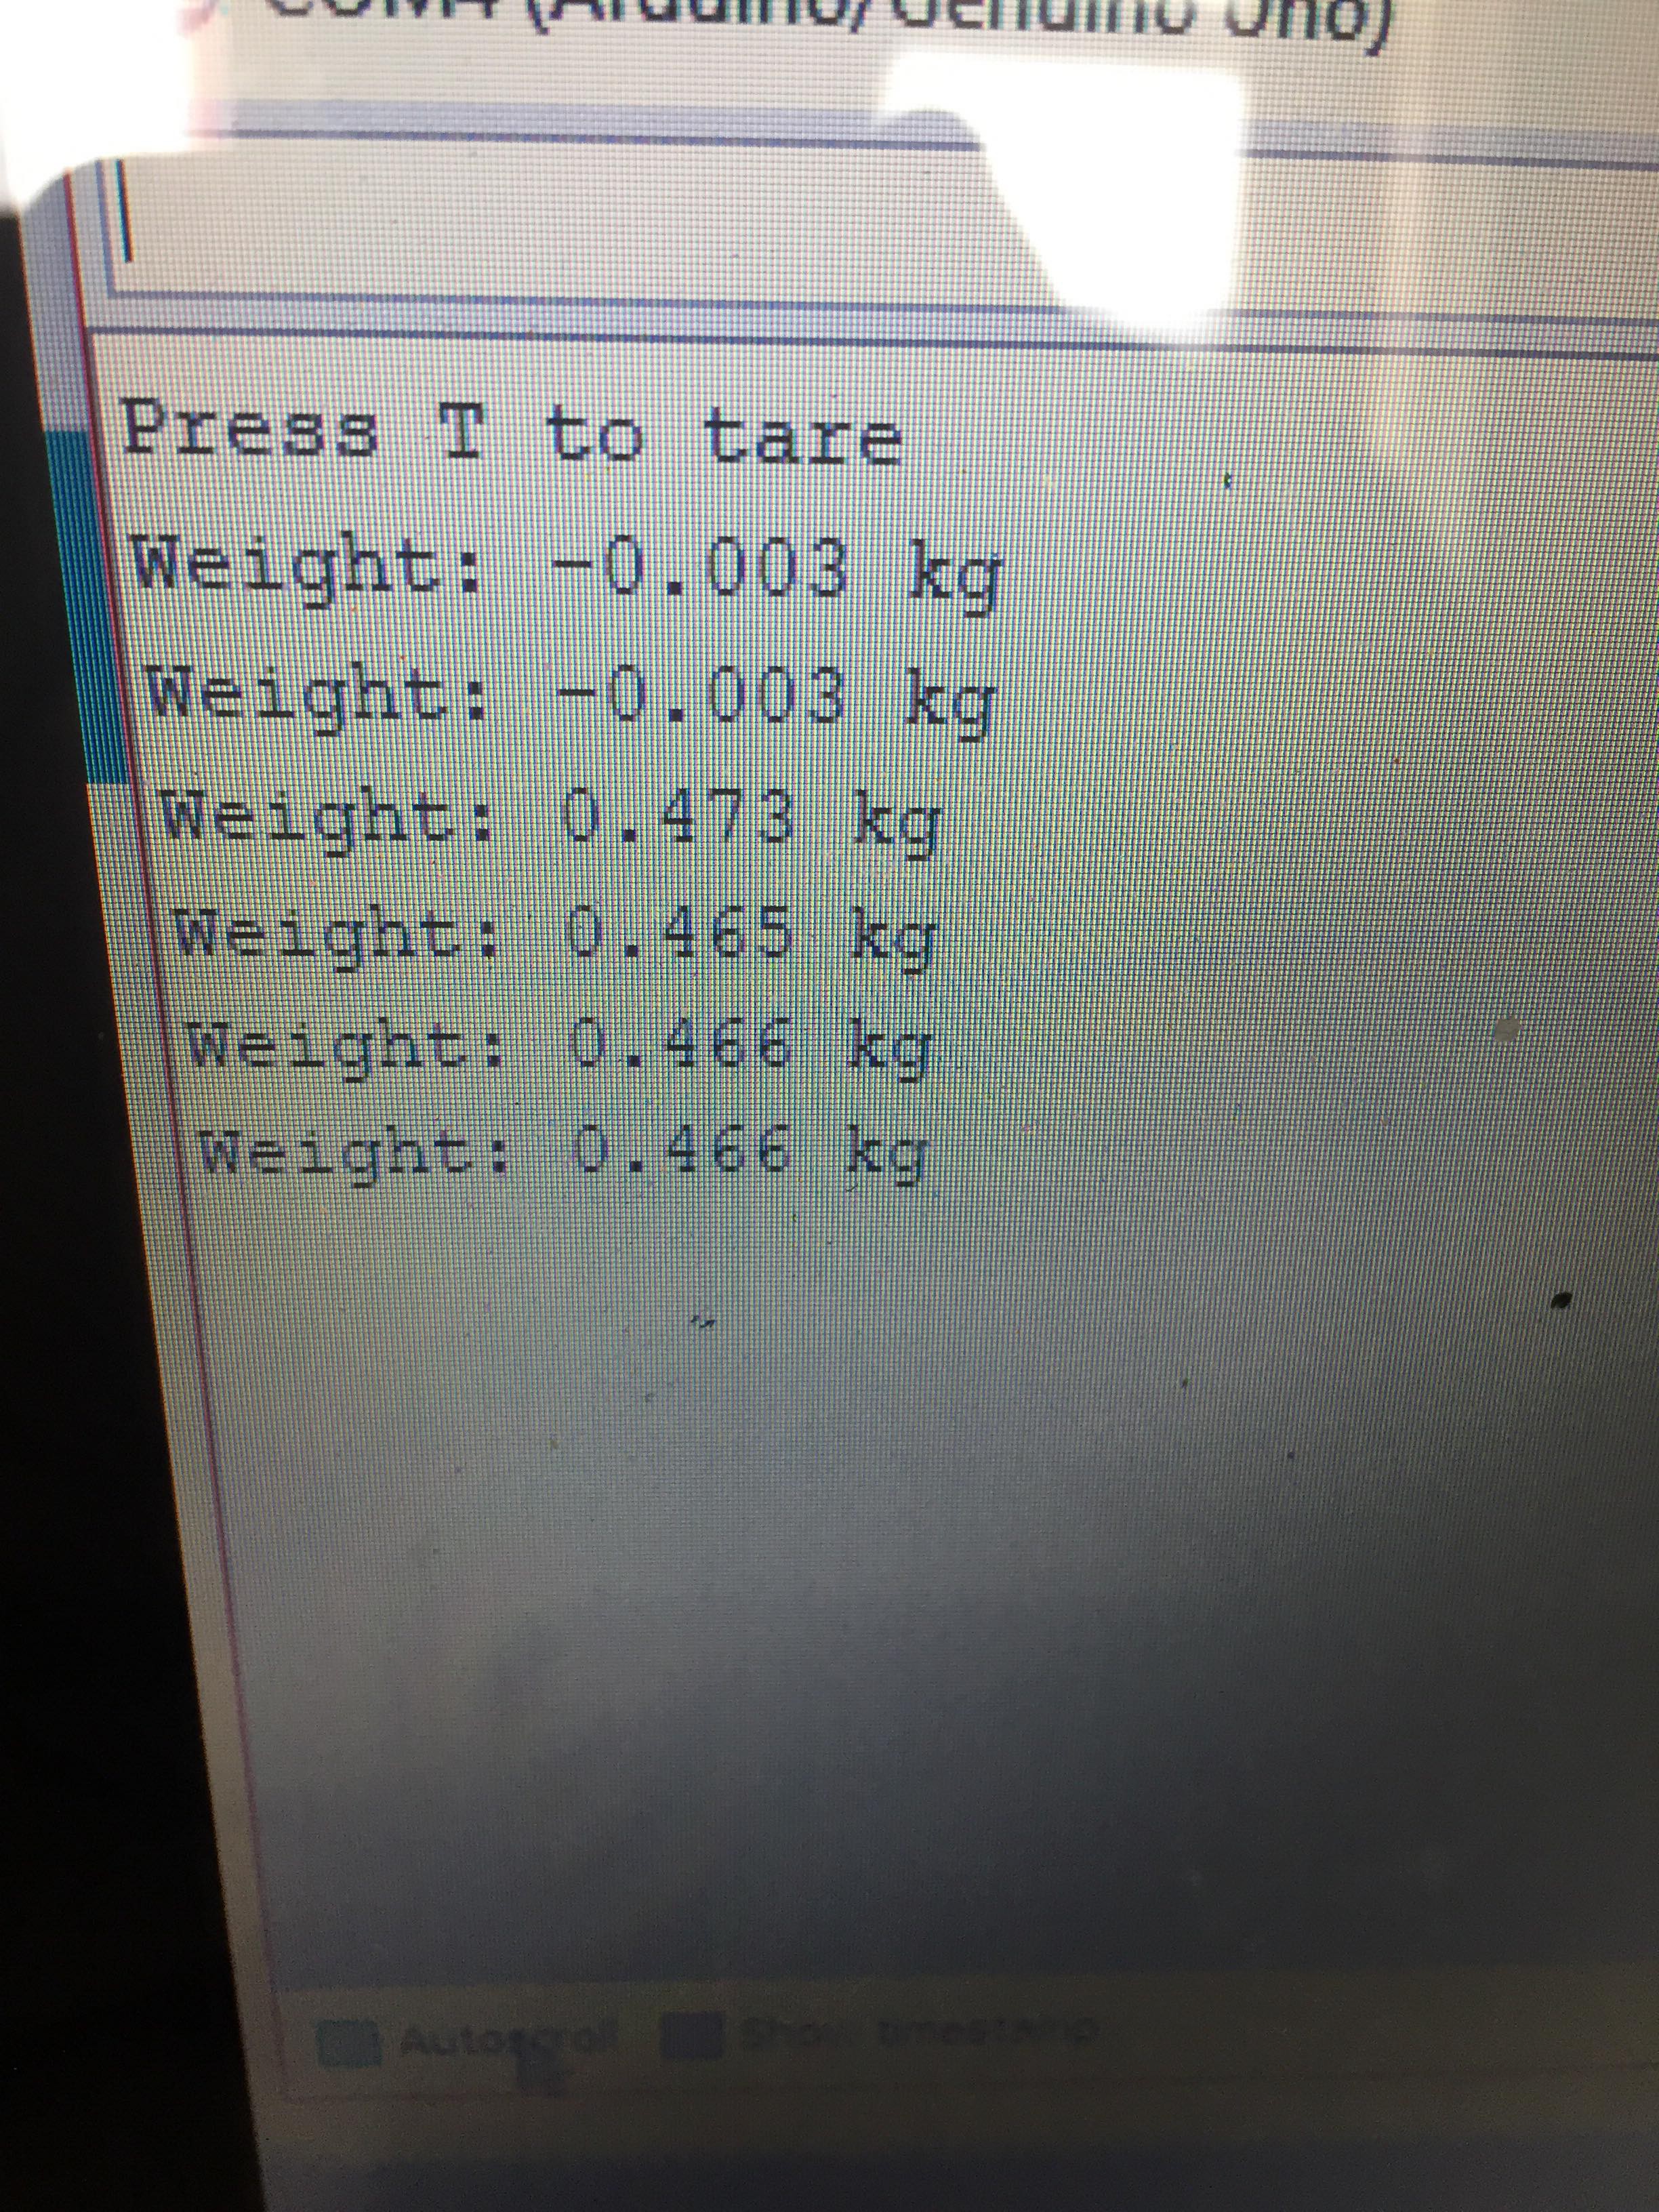
I then measured the same item on the load cell and recorded the weight that was displayed on the serial monitor of the Arduino IDE.
 Using this data and data I collected using other items of various weights, I was able to calculate an average standard deviation which I used to create the normal distribution curve as shown below. Apologies, for the low quality images of the serial monitor and graph as I just took a photo of the computer screen.
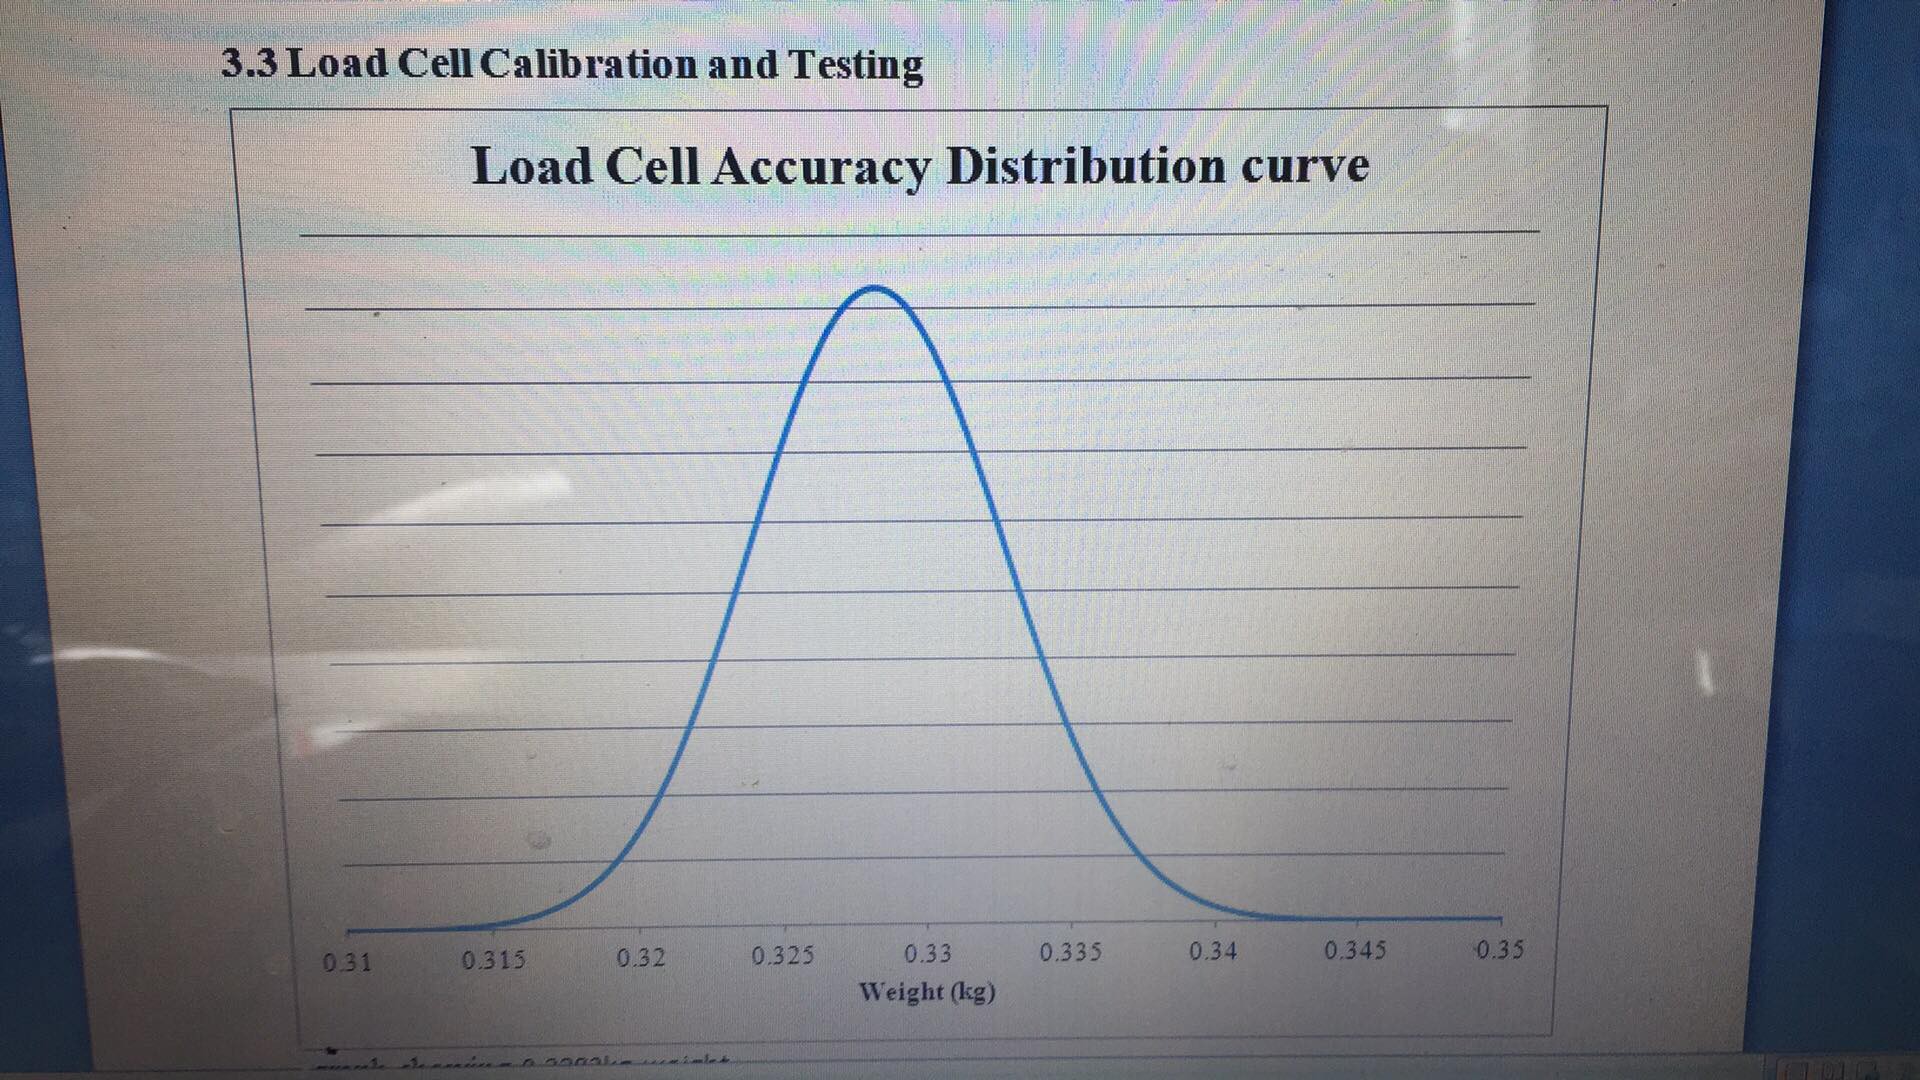
This graph will be used in my final report to allow me to comment on the accuracy of the load cells and whether the errors would affect my device.
Discussions
Become a Hackaday.io Member
Create an account to leave a comment. Already have an account? Log In.