My focus at the moment is on the endpointer, because I can bruteforce its parameters for the signal processing a lot faster than when I use the complete dictation graph. I added a endpointer.py script to the github repo which should initialize it properly. I'm using a research paper which I believe details the endpointer used in the models as a guide, so I swapped to using log-Mel filterbank energies instead of the plain power spectrum as before.
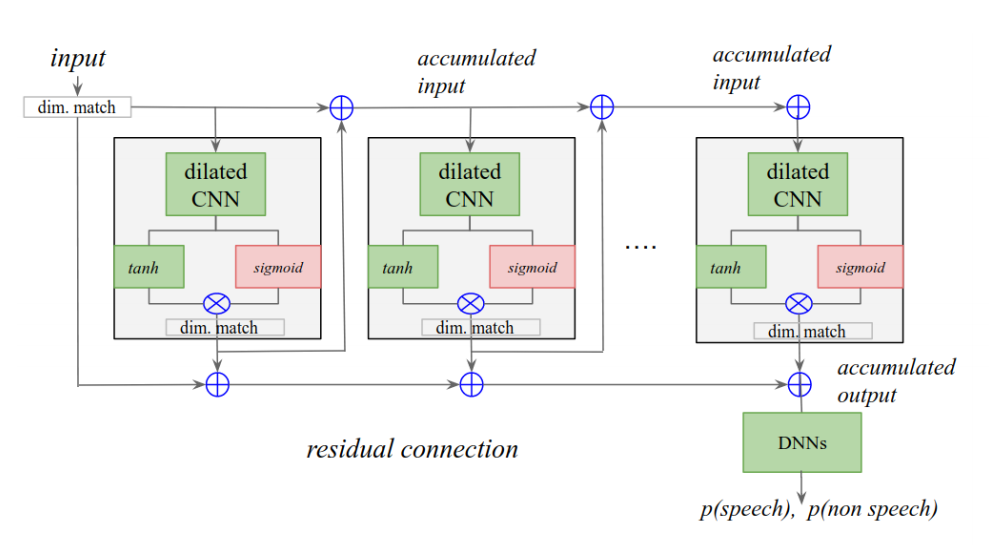
I believe the endpointer net outputs two probabilities: p(speech) and p(non speech) as given in this diagram from the paper:

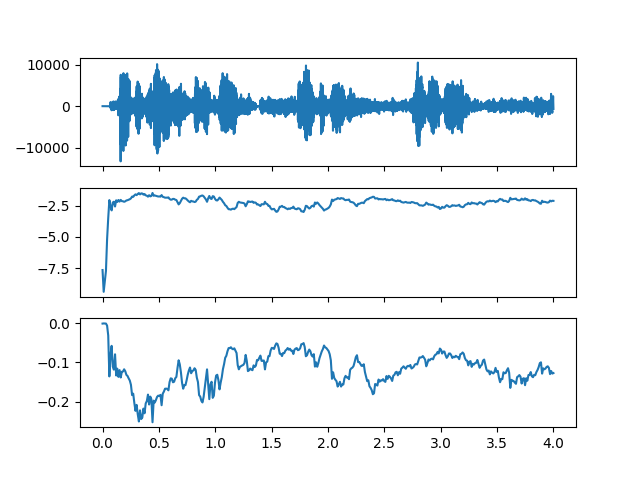
The results from the endpointer.py are still a bit underwhelming:

so some more experiments are needed. I'll update this log when there are more endpointer results.
UPDATE:
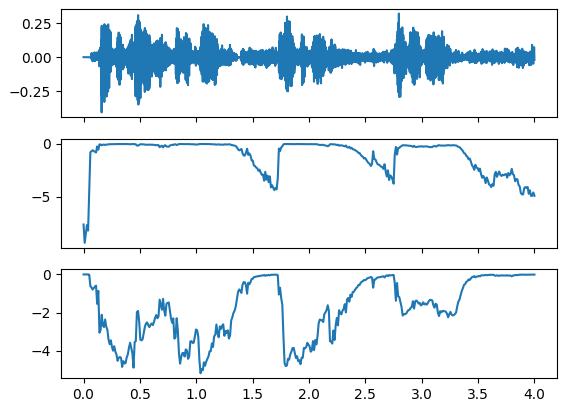
Thanks to awesome work being done by thebabush in the github repo, the endpointer gives very good results now! The most relevant changes are the normalisation of the input by 32767, and the change of the upper bound of the log mel features from 7500Hz to 3800Hz. This gives excellent results:

The top plot is the wav file with some utterances, the middle is p(speech) and the bottom is p(non speech), both with 0 being high probability. (Or the other way around, actually not sure of the absolute meaning of the values)
 biemster
Discussions
Become a Hackaday.io Member
Create an account to leave a comment. Already have an account? Log In.