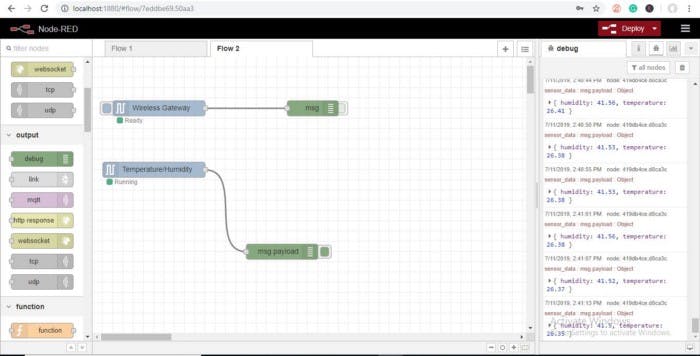
Things used in this project
- IoT Long Range Wireless Temperature Humidity Sensor with power source Battery Or External DC.
- Zigmo/Router for PC
- PC/Laptop with an OS installed or Any IoT Embedded Device.
Story
Introducing NCD’s Long Range IoT Industrial wireless vibration and temperature sensor, boasting up to a 2-mile range the use of a wi-fi mesh networking structure. Incorporating a precision 16-bit vibration and temperature sensor, this device transmits incredibly accurate vibration and temperature records at consumer-described durations.
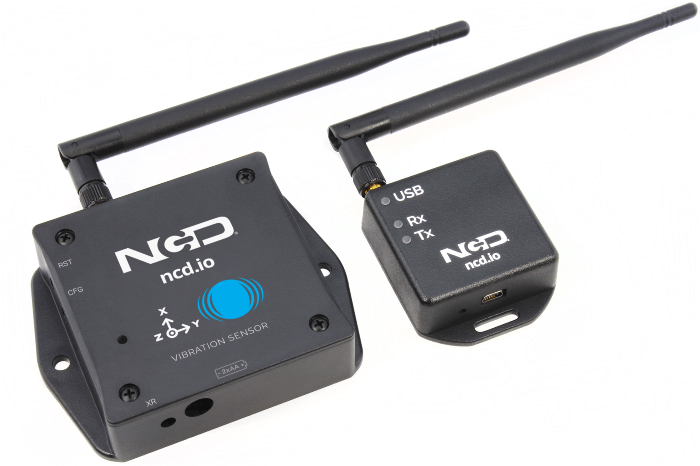
For the duration of Power-Up, this vibration sensor learns “normal” base-line vibration from the monitored device. This base-line vibration is subtracted from regular sampled vibration readings to improve applicable vibration data. Preferably, the monitored device must be off even as the sensor is mastering. Once the sensor stabilizes and starts sending information, the device/equipment being monitored can be powered on. This business IoT wireless vibration sensor samples 3-axis of vibration data for 100ms after which calculate RMS, maximum, and minimal vibration readings. This sensor combines these records with temperature data in a data packet and transmits the result to modems and gateways in the wireless variety. Once the transmission is complete, the vibration sensor is going lower back to sleep, therefore minimizing power consumption.
Powered by using just 2 AA batteries and operational life of 500,000 wireless transmissions, a ten years battery life can be expected relying on environmental conditions and the data transmission interval. Optionally, this sensor may be externally powered, making it a perfect choice for wireless vibration monitoring device for industrial equipment. With an open communication protocol, this sensor transmits hardware-encrypted data that may be included with just about any control system or gateway. Data can be transmitted to a laptop, a raspberry pi, to Losant IoT cloud, Microsoft® azure® IoT, and an embedded gadget all at the equal time. Sensor parameters and wireless transmission settings can be modified using LabView® tracking software on a computer pc.
Long-Range Wireless Mesh Modem with USB Interface
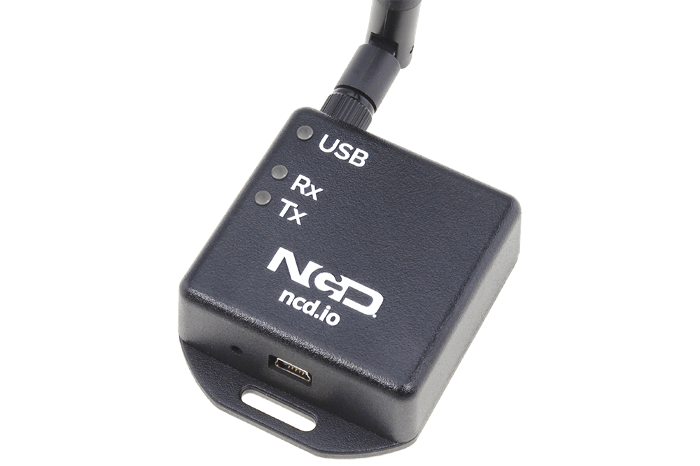
Setting up Node-Red.
The sensor and Zigmo/Router come pre-programmed and work out of the box. In this section, we will set up a sensor and Zigmo link and start receiving data on our PC.
Resources Required
- IoT Long Range Wireless Vibration and Temperature Sensor with power source Battery Or External DC.
- Zigmo/Router for PC
- PC/Laptop with an OS installed or Any IoT Embedded Device
Steps to install NODE-RED
Now that you have sensors running, we need a way to do something useful with that data.
- First of all, you’ll have to install Node-RED.
- Once that’s done, you’ll need to enter your command line, or Power Shell for Windows users, navigate to the directory Node-RED is installed in.
- Now type “npm i ncd-red-wireless node-red-dashboard“. This will install the nodes required to receive data from your wireless sensors and you can start Node-RED once this is done.
- To start node server write node-red in the command prompt or terminal and press enter.
Setting up the nodes
Assuming at this point you’ve started up Node-RED, you should be able to open a browser and navigate to http://localhost:1880, this will open up the flow builder that is the heart of the Node-RED experience.
Steps to build the flow
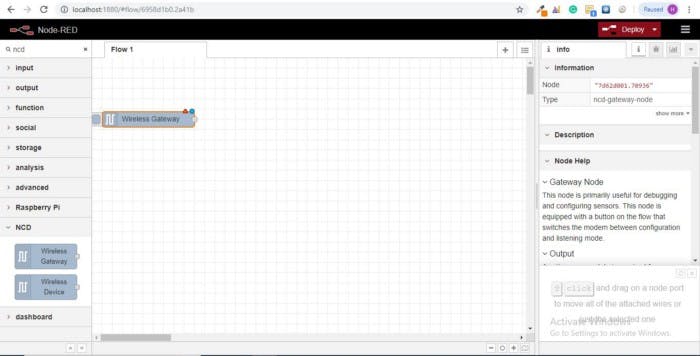
- At this point you’ll be viewing a large blank flow with a long list of nodes on the left-hand side, this sidebar is called the palette.
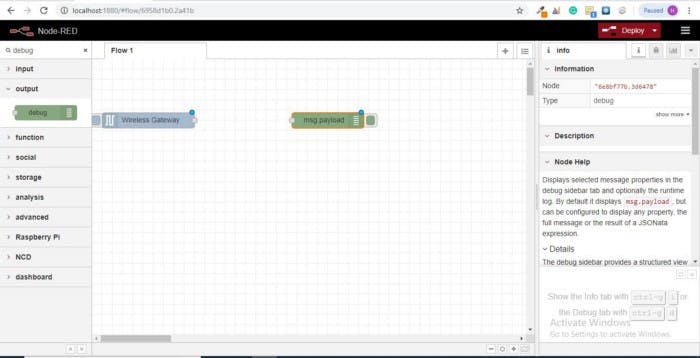
- Go ahead and drag a Wireless Gateway node over to your flow canvas to get started.
- ncd-red-wireless Provides the nodes that manage the serial connection, parse incoming sensor data, filter it by specific parameters, and allow you to configure the wireless sensors.
Finding your wireless sensors
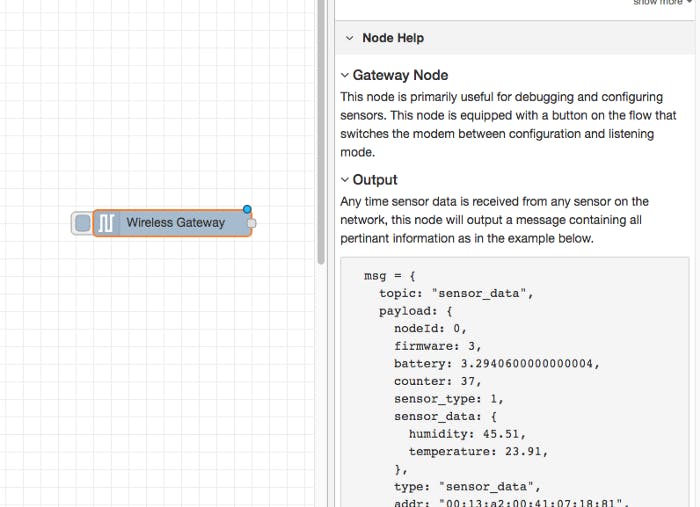
Once you’ve added the node you’ll be able to view the info tab, which contains information about the node’s functionality, this tab is well-populated for most node-red packages and contains valuable information, many times you will not need to view any other documentation outside of the info tab, so keep it in mind while you are building your flows if you have a question about how a node works. The next thing we need to do is configure the node, when you first add it you’ll notice that there is a small triangle on the top right corner next to a blue dot, the triangle indicates that the node needs additional configuration, the blue dot indicates that the node has not yet been deployed as part of the flow.
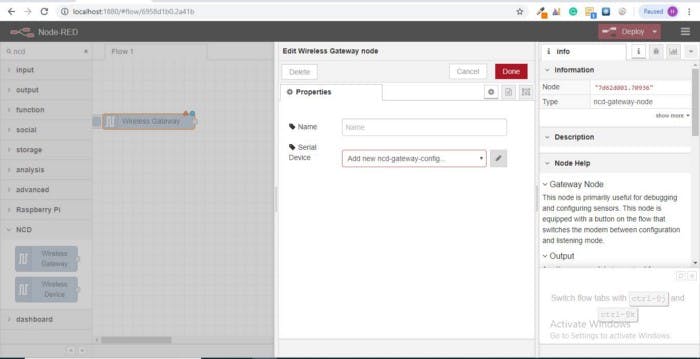
- Double click on the node to open up the configuration options.
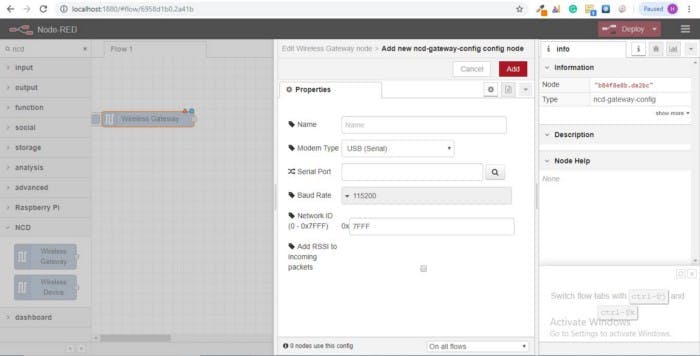
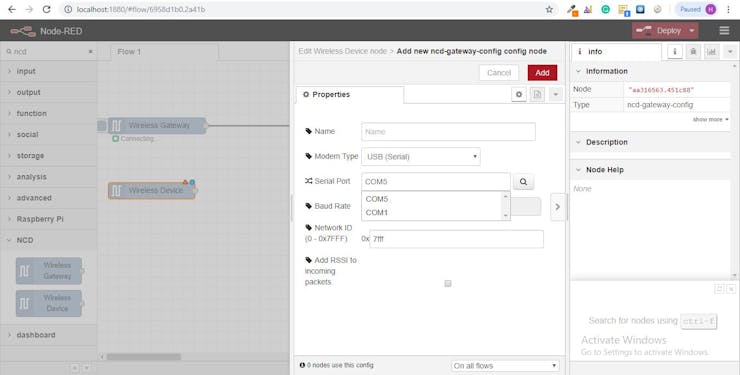
- Click on the pencil icon next to the Serial Device field to configure your USB router, this will open a second configuration panel that only has a few options.
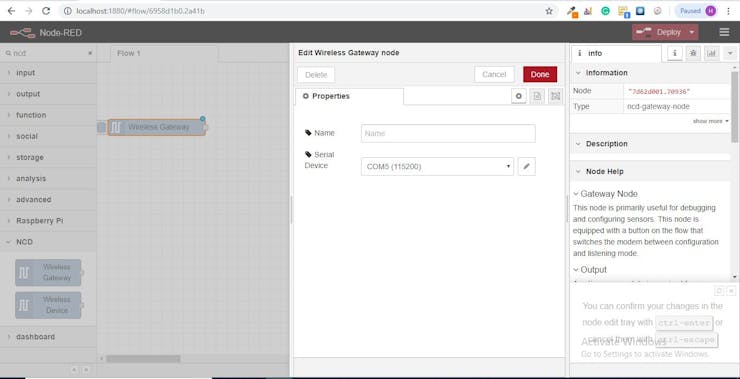
- Click on the magnifying glass next to the Serial Port field and select the port that corresponds with your router, then click the “Add” button on top. The Serial Device field will now be populated based on that selection, and you can click “Done”, you now have direct access to your wireless sensors! To view the data coming in.
- Now go back to your palette and type “debug” into the search field at the top, grab one of these nodes and drag it to the right of your Wireless Gateway.
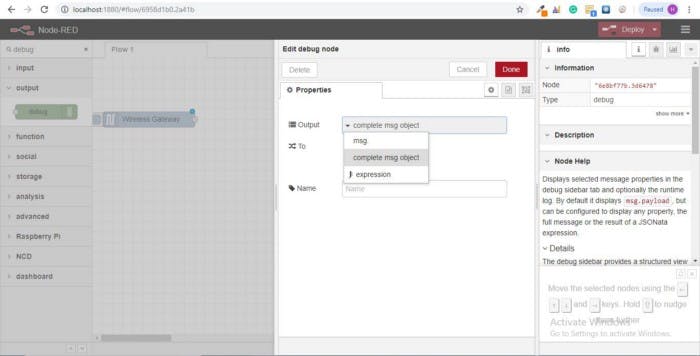
- Double click on it and change “msg.” to “complete msg object” click done.
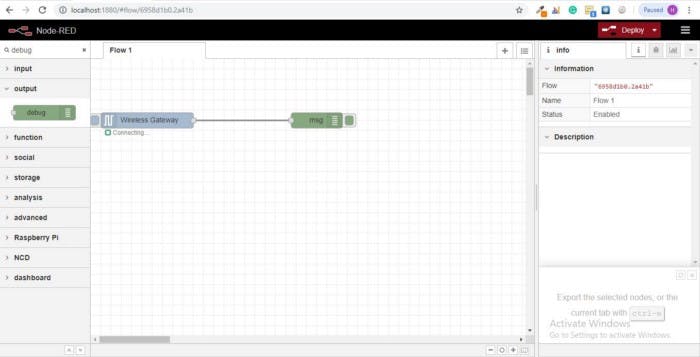
- Now draw a line between the two nodes, and click “Deploy” on the top right of the window...
Working with the data
Now out of your wireless sensors data is gathered and it is output to the “debug” tab, this “debug tab” is placed within the right sidebar subsequent to the information tab. To see the information are available in to hit the reset button. In node-red records is surpassed among nodes in a JSON packet. When the msg object comes into the debug tab you may make bigger it to view the overall list of information that comes with it. This is extraordinarily useful in case you need to quickly see which sensors are checking in. The other issue this node gives is an easy way to interchange your router to the network identity that devices in configuration mode document on, simply hit the button on the left of the node and the tool will switch to the configuration network, hit it once more to return it to listening mode. Once we get the wi-fi tool nodes set up, they may be set to routinely configure a sensor whilst it enters configuration mode, so it’s always available to maintain such gateway nodes present at the flow for speedy configuring a device.
Adding the wireless sensors
we need to separate wireless sensor records domestically in order that we are able to display it, we could use a switch node to split out the messages from the gateway based totally on the mac address with or sensor type, but as I referred to, the wireless nodes truly incorporate extra functionality for configuring the sensors, so we’ll start with them to give you an extra entire image of how those structures can work. In case you haven’t already seen packets coming in from both of your sensors, cross in advance and hit the reset button on the only that hasn’t stated. While a sensor assessment in thru any serial device configuration node, the mac address and kind of sensor is cached in a pool so we are able to quickly find it for the duration of this next step.
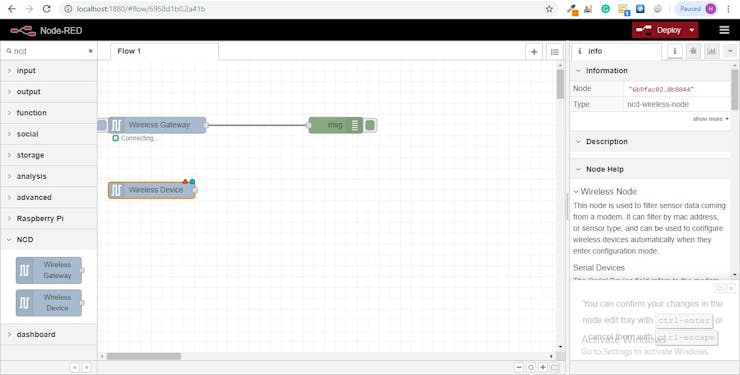
- Grab a Wireless Node from the palette and drag it onto the flow, double click on it to get it configured.
- Select the serial device from the drop-down that you used for the Wireless Gateway, now click the magnifying glass next to “Mac Address” and select one of the available options.
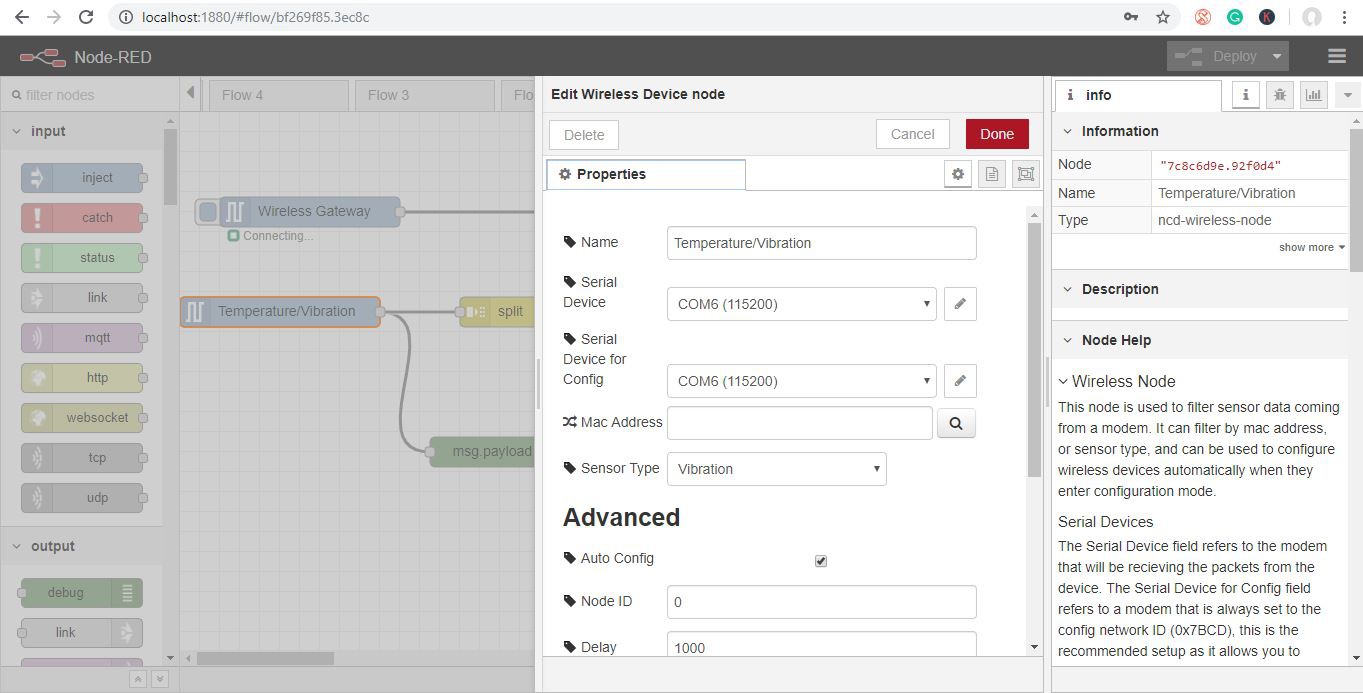
You’ll notice this automatically sets the sensor type for you, you can also give it a name to make it easier to identify. As noted in the info tab, the Serial Device for Config field is optional, and we won’t worry about it right now. The node you have just added effectively works as a filter on incoming sensor data, only passing through data for the mac address, or sensor type if no mac address is present.
- Now go back to your palette and type “debug” into the search field at the top, grab one of these nodes and drag it to the right of your Wireless Gateway.
- Double click on it and click done.
Displaying up the Vibration/Temperature
These nodes for the wireless sensors output a msg object with all of the same information as the Wireless Gateway node, just in a slightly different format, the Sensor Data itself is sent in the msg.payload, which is what most nodes use to interact with the msg itself.
- Grab a “split” node from the palette, and place it to the right of the Vib/Temp node.
- Double click and check the box under Object that says “Copy key to”, this will split the msg into multiple objects, one for each property in the payload, and set the topics for those new msgs to the property names.
- Now add a “switch” node, this will allow us to send each msg to a specific part of the flow, one to handle RMS, and one to Max, one to Min and one to temperature.
- In the first field change “payload” to “topic”, Click on the “==” and select “matches regex”, in the field next to it type “rms_.”, this means “match a string that contains rms_ followed by any character (.) as many characters as are available (*).
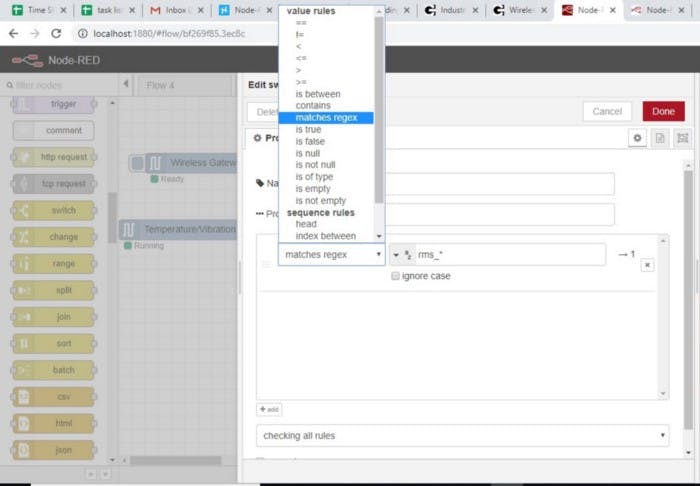
- Click on add button to add a new row and follow the last step, replacing “rms” with “max”, and then one more time with “min” and at last one more row for temperature type “temperature” next to the “==”. This will split our incoming payloads into 4 sections to be routed to ui, each containing the appropriate values for all 3 axes and temperature.
- Next let’s add a “chart” from the palette for RMS, copy it two times for MAX and MIN and also add “gauge” for temperature.
- Now double click on first chart node and set the Group to “[Current]Vibration” and set the Label to RMS as shown in the picture.
- Now double click on second chart node and set the Group to “[Current]Vibration” and set the Label to MAX as shown in the picture.
- Now double click on third chart node and set the Group to “[Current]Vibration” and set the Label to MIN as shown in the picture.
- Next for the gauge node set the Label to “Temperature”, and the Value format to “{{value | number:2}}”, and the Units to “Celsius” you can alter the range to the minimum and maximum expected temperature, I’m using 0 and 50.
- Now draw wires from the Vibration/Temperature node to the split node, from the split node to the switch node, and from the switch node’s first (top) output to the RMS Chart node, and from the switch node’s second output to the MAX chart, and from the switch node’s third output to the Min chart, and from the switch node’s fourth output to the temperature gauge.
- Once that’s done click deploy.
NODE-RED DASHBOARD
Provides the ability to create a UI using the flow builder, provides charts, graphs, and a number of other visual elements we can use to display data, along with nodes to trigger a flow using user input. We will use some of these nodes to display the telemetry from your wireless sensors.
- Let’s check it out! There is a tab on the top right that says “Dashboard”
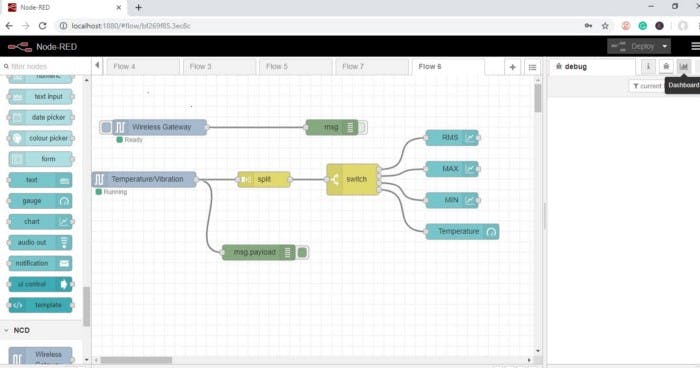
- On the top right of that tab is the little “new window” icon, click on it to view your UI.

It is likely that the gauges aren’t displaying any information, because no sensor data has been reported since you deployed the flow, click the reset button on your temperature/humidity sensor to force it to check-in and your gauges should jump up. You should now have real-time data displaying!
NODE-RED DASHBOARD OUTPUT
- Now as the value of vibration and temperature increases and decreases new data available inside the various variable.
- RMS/MAX/MIN Output
- MAX/MIN Output
Temperature Output

Node-Red_JSON_Flow:
[{"id":"bf269f85.3ec8c","type":"tab","label":"Flow 6","disabled":false,"info":""},{"id":"8dcd9546.097c08","type":"ncd-gateway-node","z":"bf269f85.3ec8c","name":"","connection":"81e57a1c.8fbd68","x":130,"y":100,"wires":[["ec8397bc.e484b8"]]},{"id":"ec8397bc.e484b8","type":"debug","z":"bf269f85.3ec8c","name":"","active":false,"tosidebar":true,"console":false,"tostatus":false,"complete":"true","targetType":"full","x":460,"y":100,"wires":[]},{"id":"7c8c6d9e.92f0d4","type":"ncd-wireless-node","z":"bf269f85.3ec8c","name":"Temperature/Vibration","connection":"c5c43fa.e50d0c","config_comm":"932dbcf.8c1574","addr":"","sensor_type":"8","auto_config":true,"node_id":0,"delay":"1000","destination":"0000FFFF","power":4,"retries":10,"pan_id":"7FFF","change_enabled":"","change_pr":"0","change_interval":"0","cm_calibration":"60.6","bp_altitude":"0","bp_pressure":"0","bp_temp_prec":"0","bp_press_prec":"0","amgt_accel":"0","amgt_mag":"0","amgt_gyro":"0","impact_accel":"0","impact_data_rate":"4","impact_threshold":25,"impact_duration":1,"activ_interr_x":1,"activ_interr_y":2,"activ_interr_z":4,"activ_interr_op":8,"filtering":0,"data_rate":5,"time_series":0,"reading_type":1,"x":100,"y":200,"wires":[["146f79c6.a8c8d6","a3f3783d.775518"]]},{"id":"146f79c6.a8c8d6","type":"debug","z":"bf269f85.3ec8c","name":"","active":true,"tosidebar":true,"console":false,"tostatus":false,"complete":"false","x":320,"y":340,"wires":[]},{"id":"a3f3783d.775518","type":"split","z":"bf269f85.3ec8c","name":"","splt":"\\n","spltType":"str","arraySplt":1,"arraySpltType":"len","stream":false,"addname":"topic","x":330,"y":200,"wires":[["324100a6.279ad"]]},{"id":"324100a6.279ad","type":"switch","z":"bf269f85.3ec8c","name":"","property":"topic","propertyType":"msg","rules":[{"t":"regex","v":"rms_*","vt":"str","case":false},{"t":"regex","v":"max_*","vt":"str","case":false},{"t":"regex","v":"min_*","vt":"str","case":false},{"t":"eq","v":"temperature","vt":"str"}],"checkall":"true","repair":false,"outputs":4,"x":500,"y":200,"wires":[["c4c9112d.a5b43"],["6fd6f7a4.b1d228"],["ebcb4081.be1bf"],["b167be6b.432f3"]]},{"id":"c4c9112d.a5b43","type":"ui_chart","z":"bf269f85.3ec8c","name":"","group":"1d658fe9.d49d4","order":1,"width":"12","height":"6","label":"RMS","chartType":"line","legend":"true","xformat":"HH:mm:ss","interpolate":"bezier","nodata":"","dot":true,"ymin":"0","ymax":"200","removeOlder":"5","removeOlderPoints":"","removeOlderUnit":"60","cutout":0,"useOneColor":false,"colors":["#1f77b4","#aec7e8","#ff7f0e","#2ca02c","#98df8a","#d62728","#ff9896","#9467bd","#c5b0d5"],"useOldStyle":false,"outputs":1,"x":690,"y":120,"wires":[[]]},{"id":"6fd6f7a4.b1d228","type":"ui_chart","z":"bf269f85.3ec8c","name":"","group":"1d658fe9.d49d4","order":2,"width":"6","height":"6","label":"MAX","chartType":"line","legend":"true","xformat":"HH:mm:ss","interpolate":"bezier","nodata":"","dot":false,"ymin":"0","ymax":"200","removeOlder":"5","removeOlderPoints":"","removeOlderUnit":"60","cutout":0,"useOneColor":false,"colors":["#1f77b4","#aec7e8","#ff7f0e","#2ca02c","#98df8a","#d62728","#ff9896","#9467bd","#c5b0d5"],"useOldStyle":false,"outputs":1,"x":690,"y":180,"wires":[[]]},{"id":"ebcb4081.be1bf","type":"ui_chart","z":"bf269f85.3ec8c","name":"","group":"1d658fe9.d49d4","order":3,"width":"6","height":"6","label":"MIN","chartType":"line","legend":"true","xformat":"HH:mm:ss","interpolate":"bezier","nodata":"","dot":false,"ymin":"","ymax":"","removeOlder":"5","removeOlderPoints":"","removeOlderUnit":"60","cutout":0,"useOneColor":false,"colors":["#1f77b4","#aec7e8","#ff7f0e","#2ca02c","#98df8a","#d62728","#ff9896","#9467bd","#c5b0d5"],"useOldStyle":false,"outputs":1,"x":690,"y":240,"wires":[[]]},{"id":"b167be6b.432f3","type":"ui_gauge","z":"bf269f85.3ec8c","name":"","group":"1d658fe9.d49d4","order":4,"width":0,"height":0,"gtype":"gage","title":"Temperature","label":"Celsius","format":"{{value | number:2}}","min":0,"max":"50","colors":["#00b500","#e6e600","#ca3838"],"seg1":"","seg2":"","x":710,"y":300,"wires":[]},{"id":"81e57a1c.8fbd68","type":"ncd-gateway-config","z":"","name":"","comm_type":"serial","ip_address":"","tcp_port":"2101","port":"COM6","baudRate":"115200","pan_id":"7fff","rssi":false},{"id":"c5c43fa.e50d0c","type":"ncd-gateway-config","z":"","name":"","comm_type":"serial","ip_address":"","tcp_port":"2101","port":"COM6","baudRate":"115200","pan_id":"7fff","rssi":false},{"id":"932dbcf.8c1574","type":"ncd-gateway-config","z":"","name":"","comm_type":"serial","ip_address":"","tcp_port":"2101","port":"COM6","baudRate":"115200","pan_id":"7fff","rssi":false},{"id":"1d658fe9.d49d4","type":"ui_group","z":"","name":"Vibration","tab":"b885bf5f.d5f31","disp":true,"width":"12","collapse":false},{"id":"b885bf5f.d5f31","type":"ui_tab","z":"","name":"Current","icon":"dashboard"}]
 Rajbir Singh
