 Tim Rightnour
It's been at least a year since I fired this thing up. The short answer is, absolutely, yes.
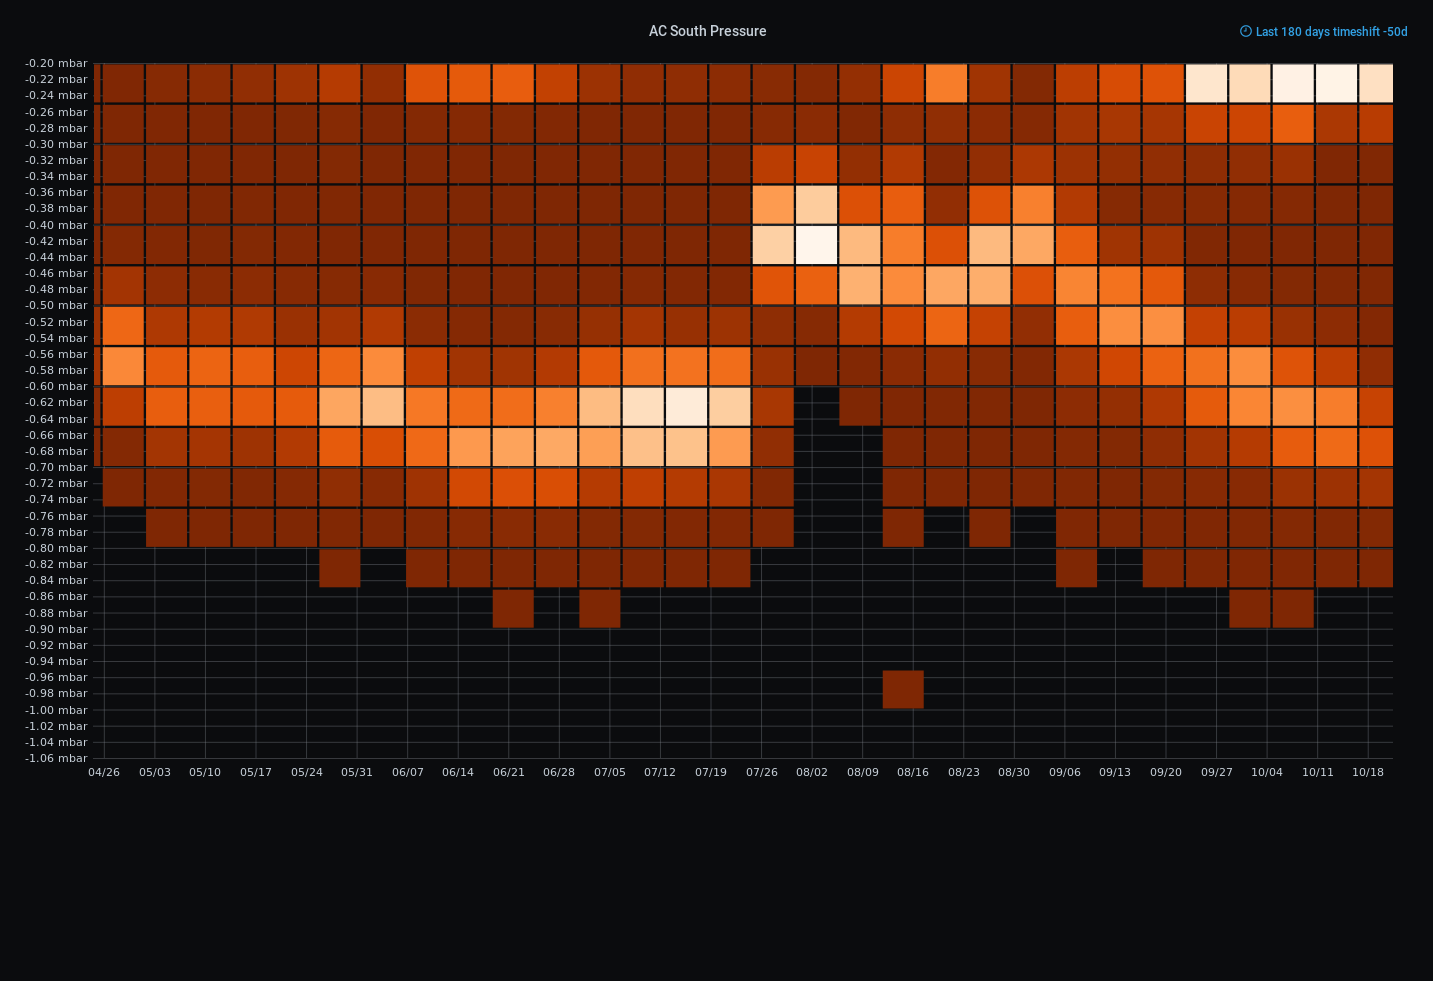
If we take a look at the histogram below (which I found is the best way to visualize this data) we can see how it trends towards higher and higher readings, until we hit the point around 0.8 or so, which it should definitely have been replaced just before.
So basically, if I watch this graph, I can see when the filter should be replaced. And it's pretty accurate. I have been examining the filter visually during the period, and the graph basically matches it.
I ended up building one more of these sensors, but basically just attached 2 BME280's and then wired them in ESPHome, super simple. Need to install that in one of my other units. But short answer is, I'm more or less happy with this!
Discussions
Become a Hackaday.io Member
Create an account to leave a comment. Already have an account? Log In.