The reflectometer has two GUIs. Each of them has a different usecase and therefore their usage slightly differs. One is a part of the firmware in the reflectometer, the other one is an Octave script which runs on a computer. Please remember that the reflectometer can run without computer or the Octave GUI.
The part of GUI in firmware
When the reflectometer is used without computer, it is meant to be used for detecting faults on cables hidden in walls and solving similar problems. Therefore, the GUI is minimalist. No menus, no options, no way to play with the reflectometer. It's meant to do its job and not more. It tells you about its current state, gives you commands during autocalibration and then allows you to run a measurement.
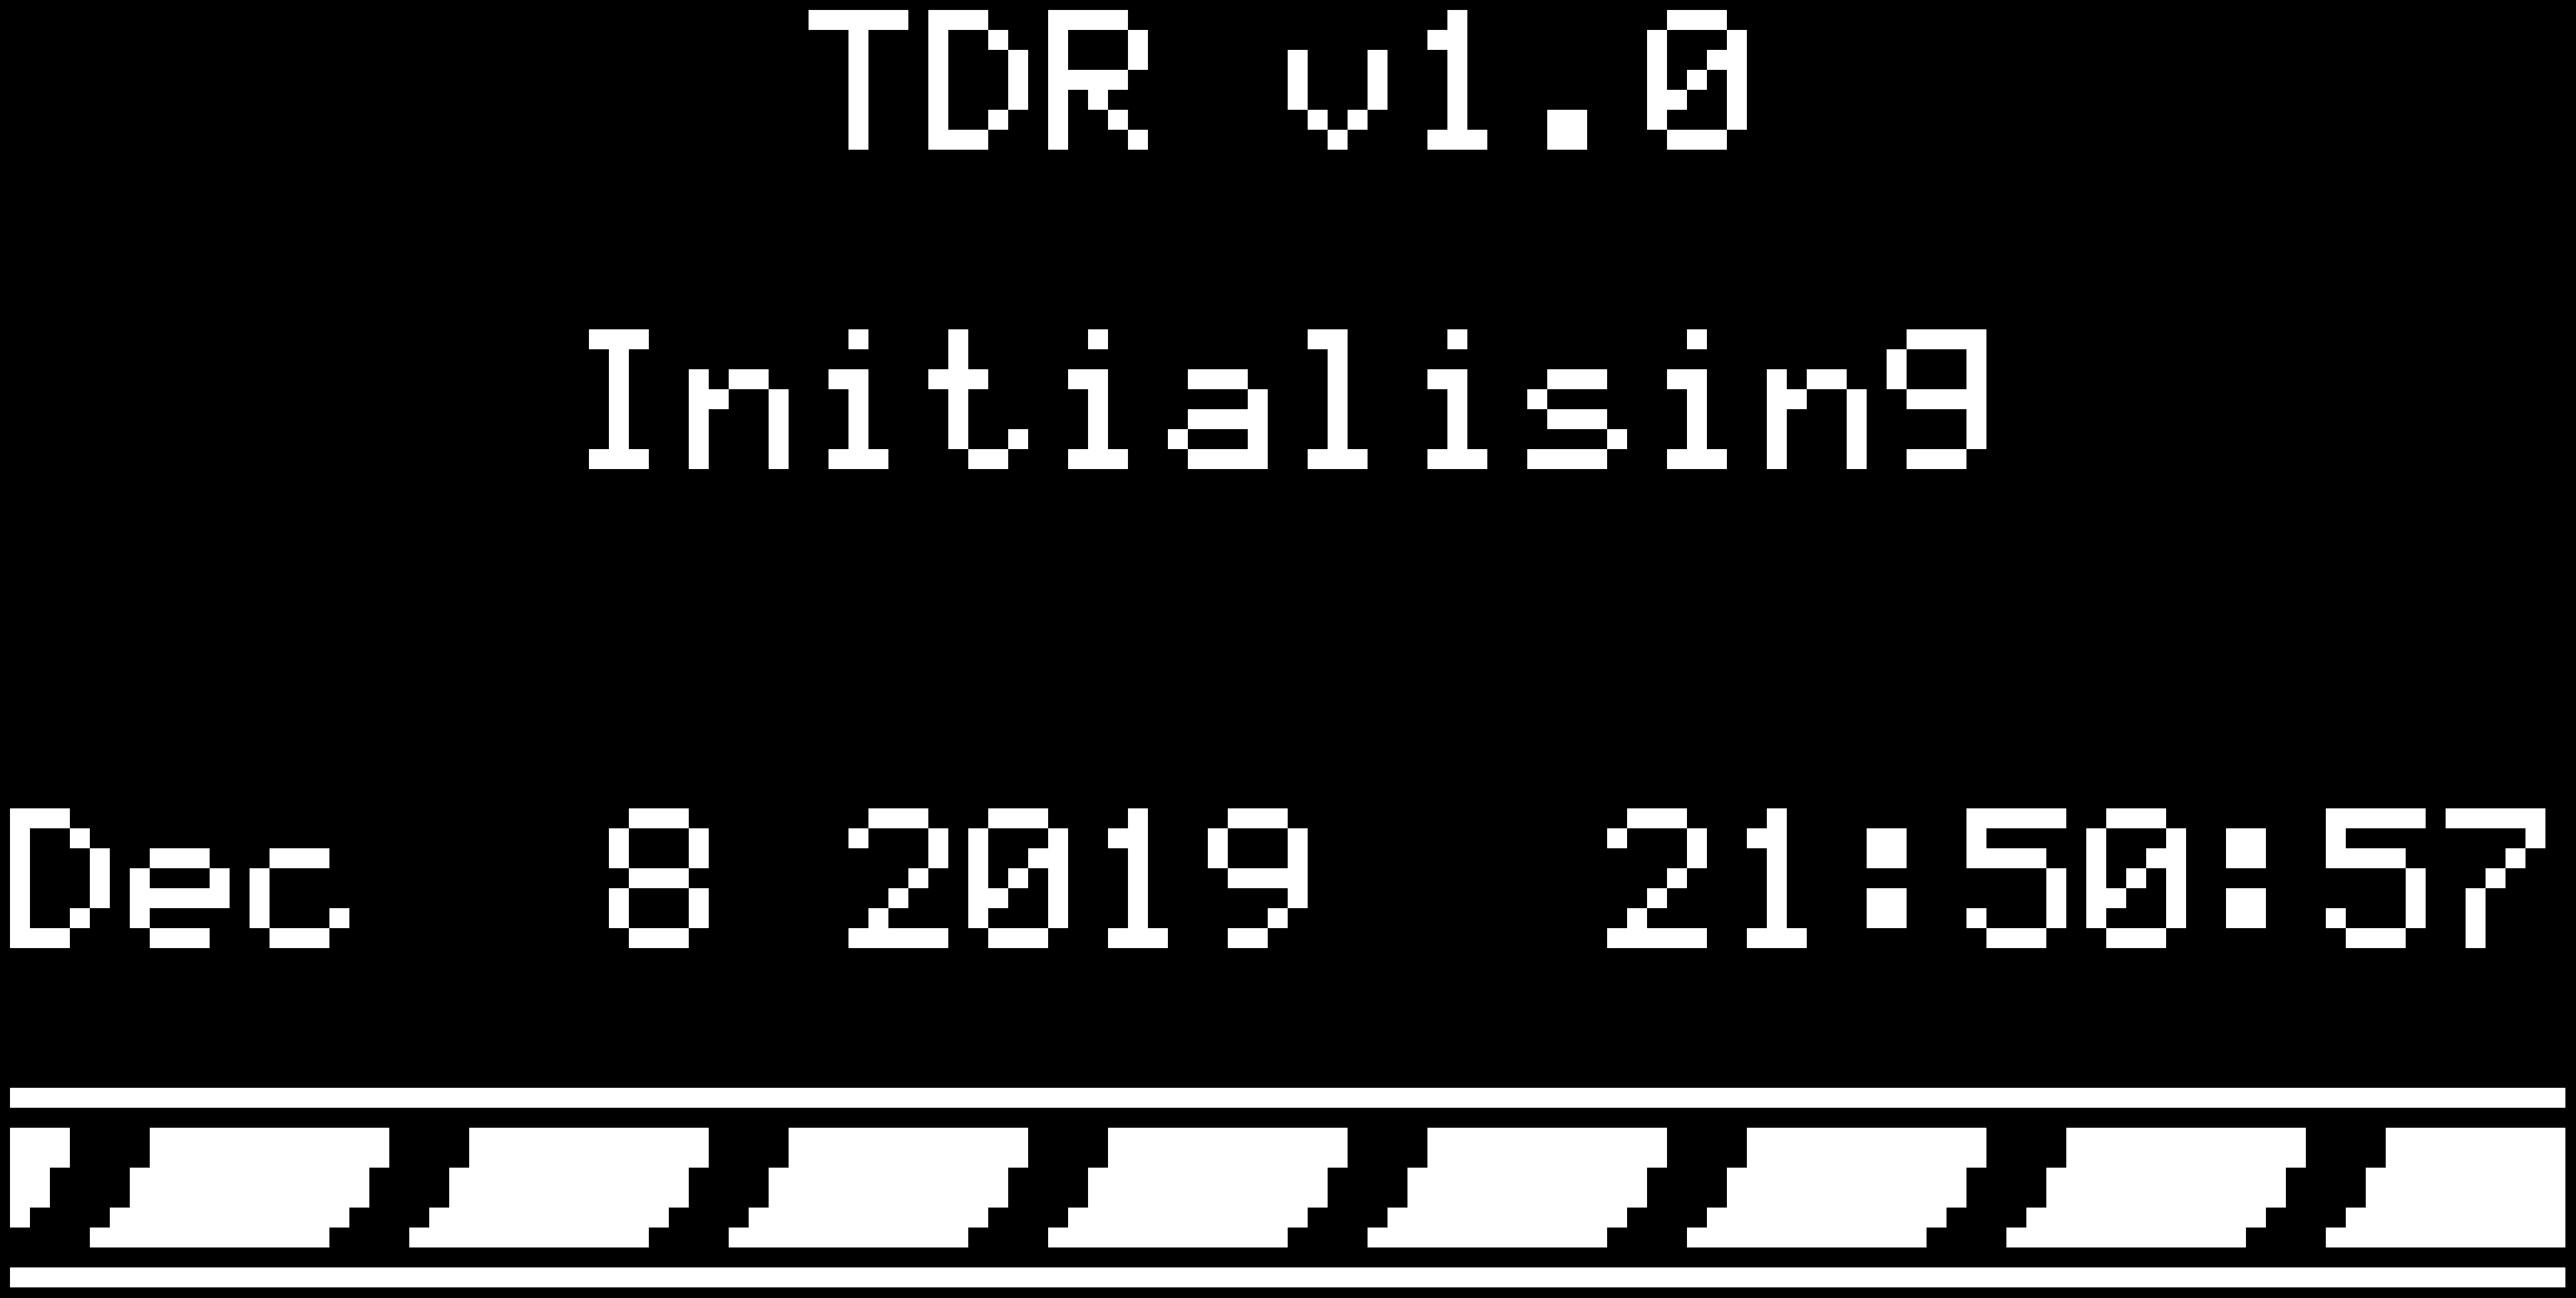
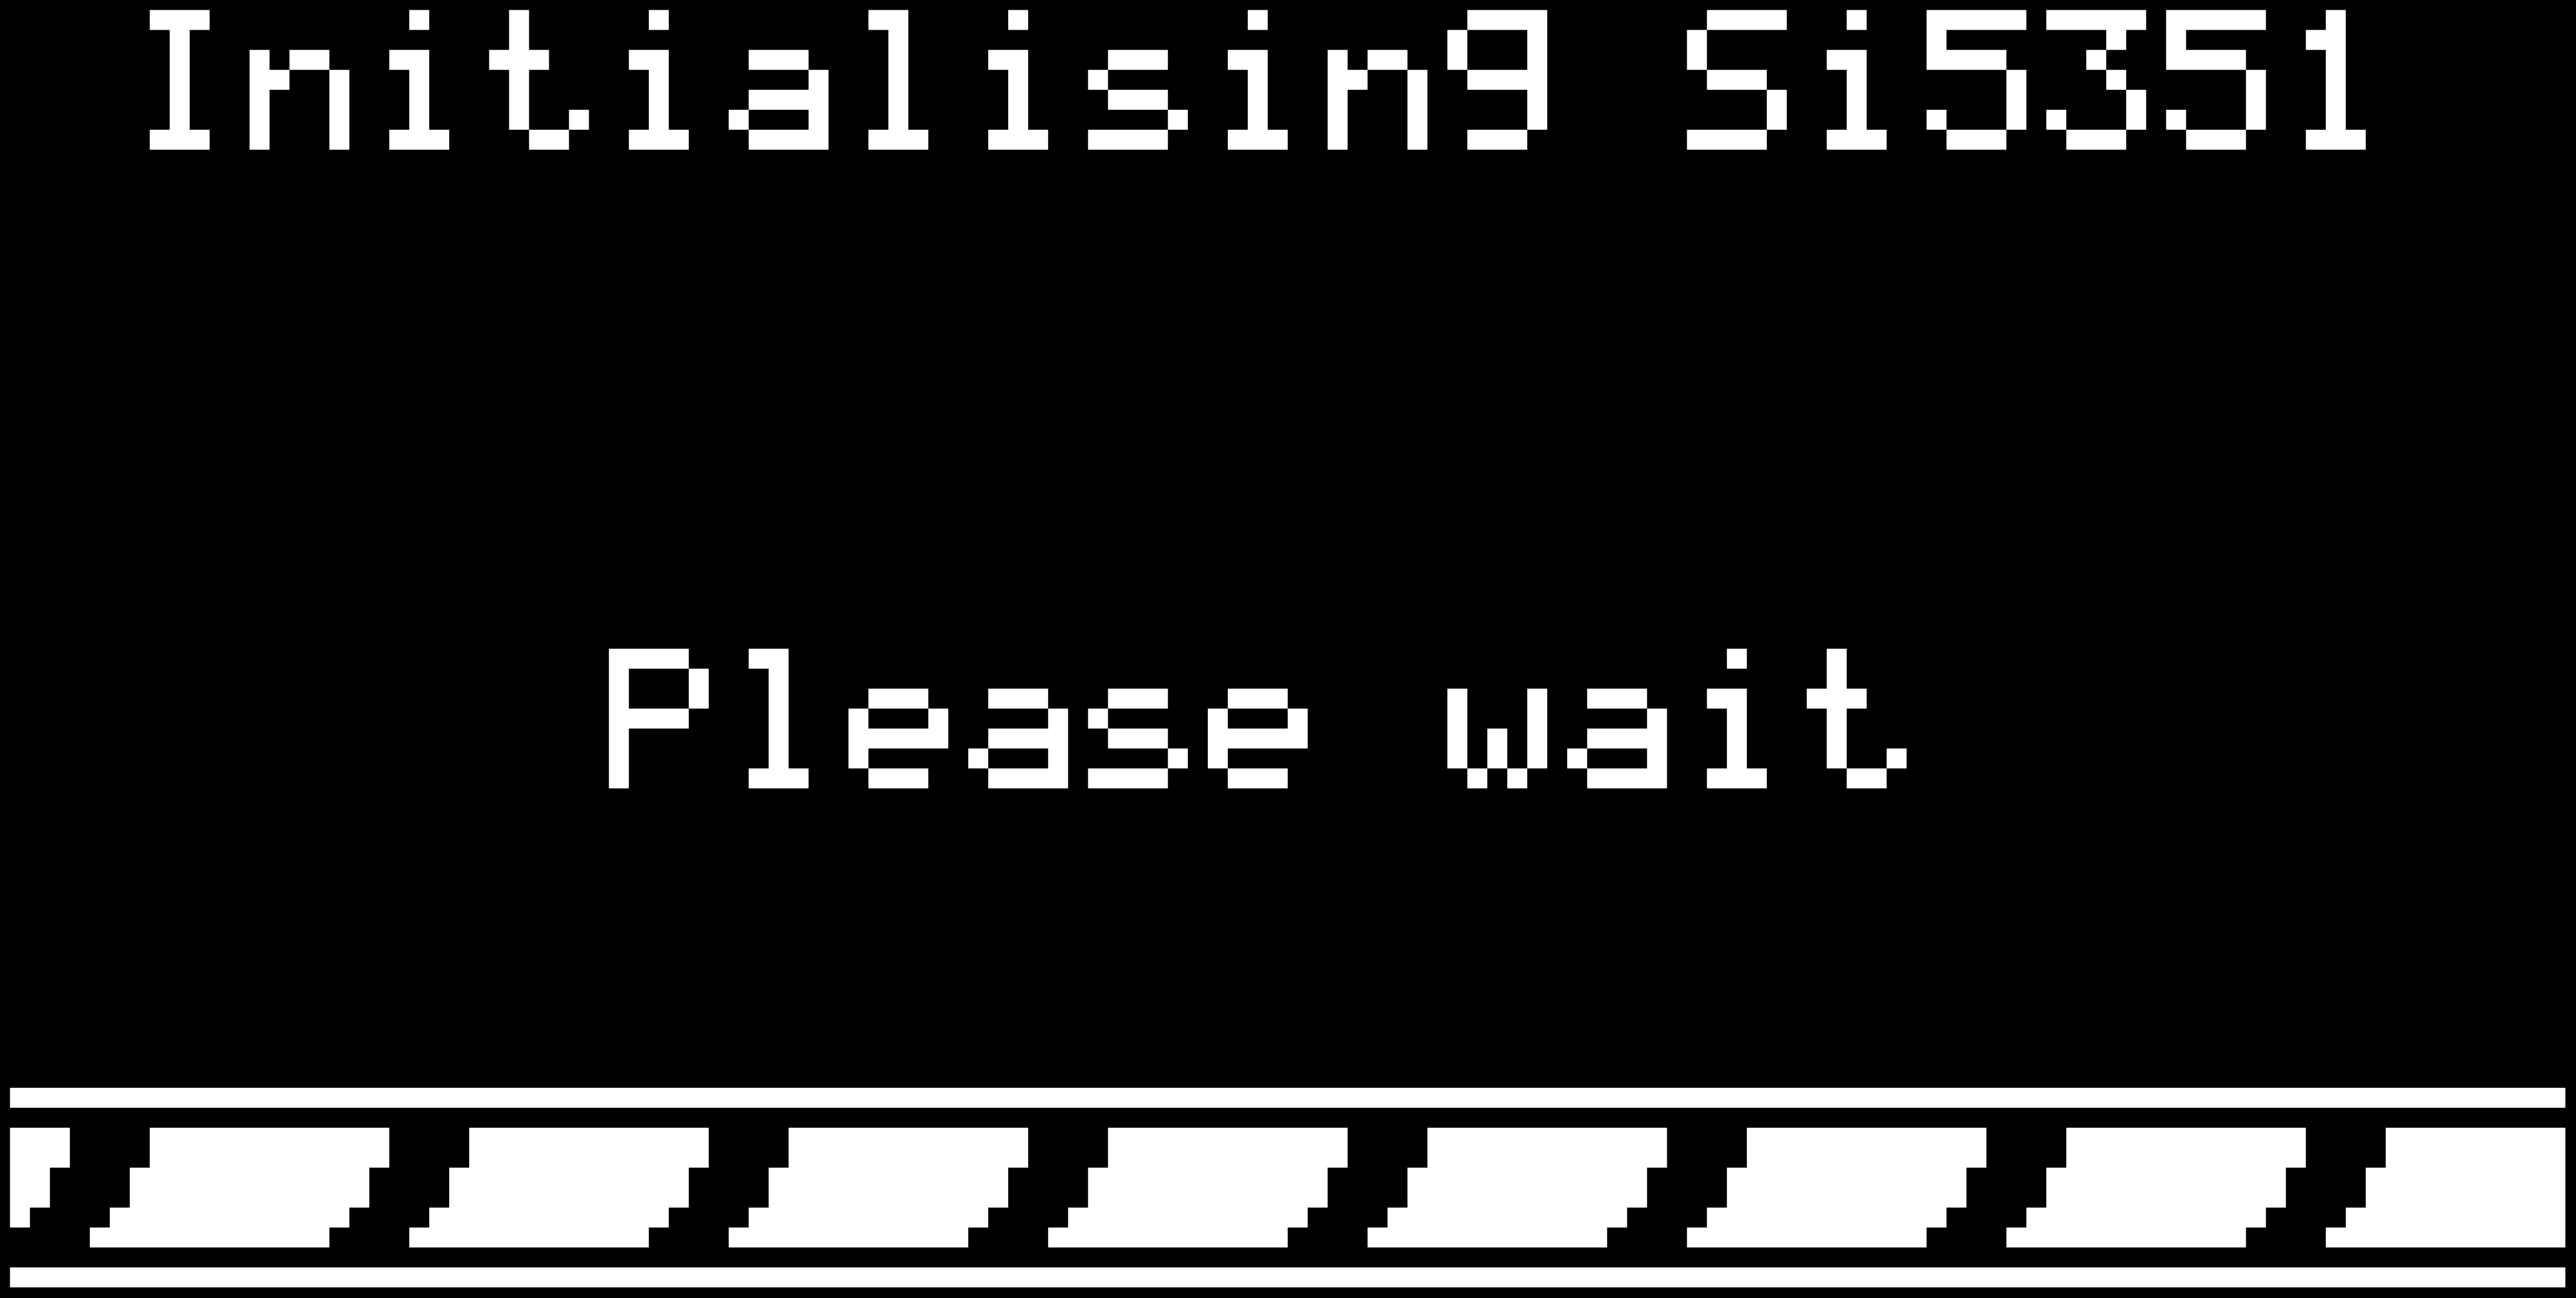
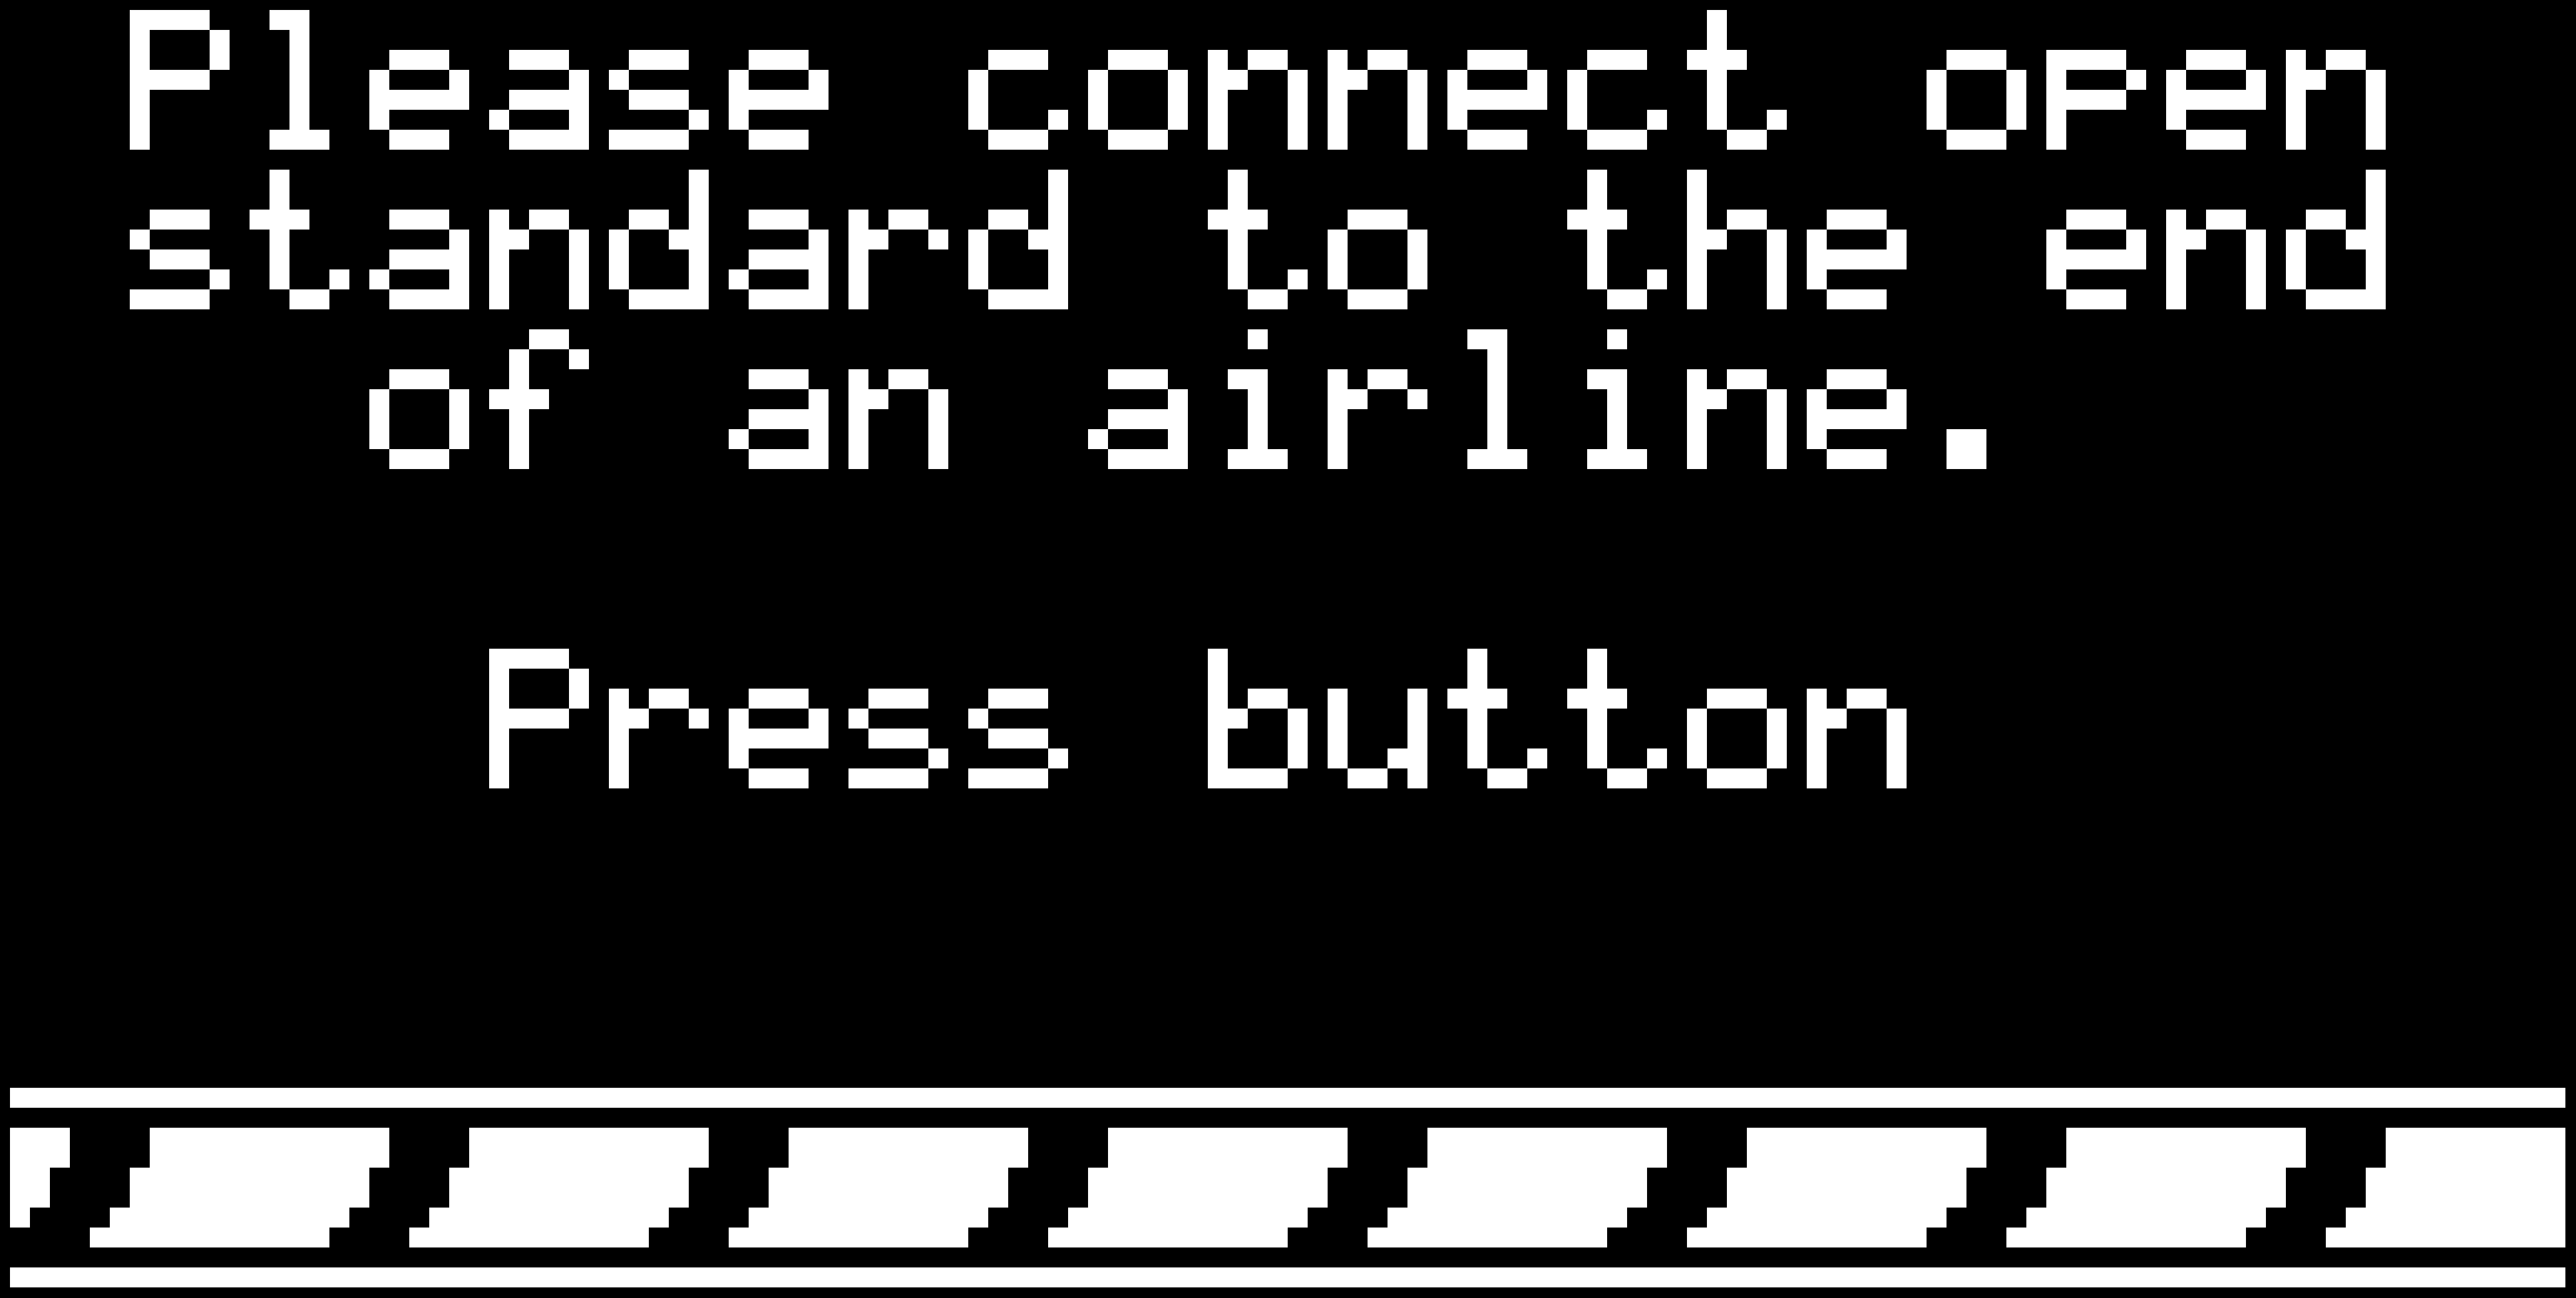
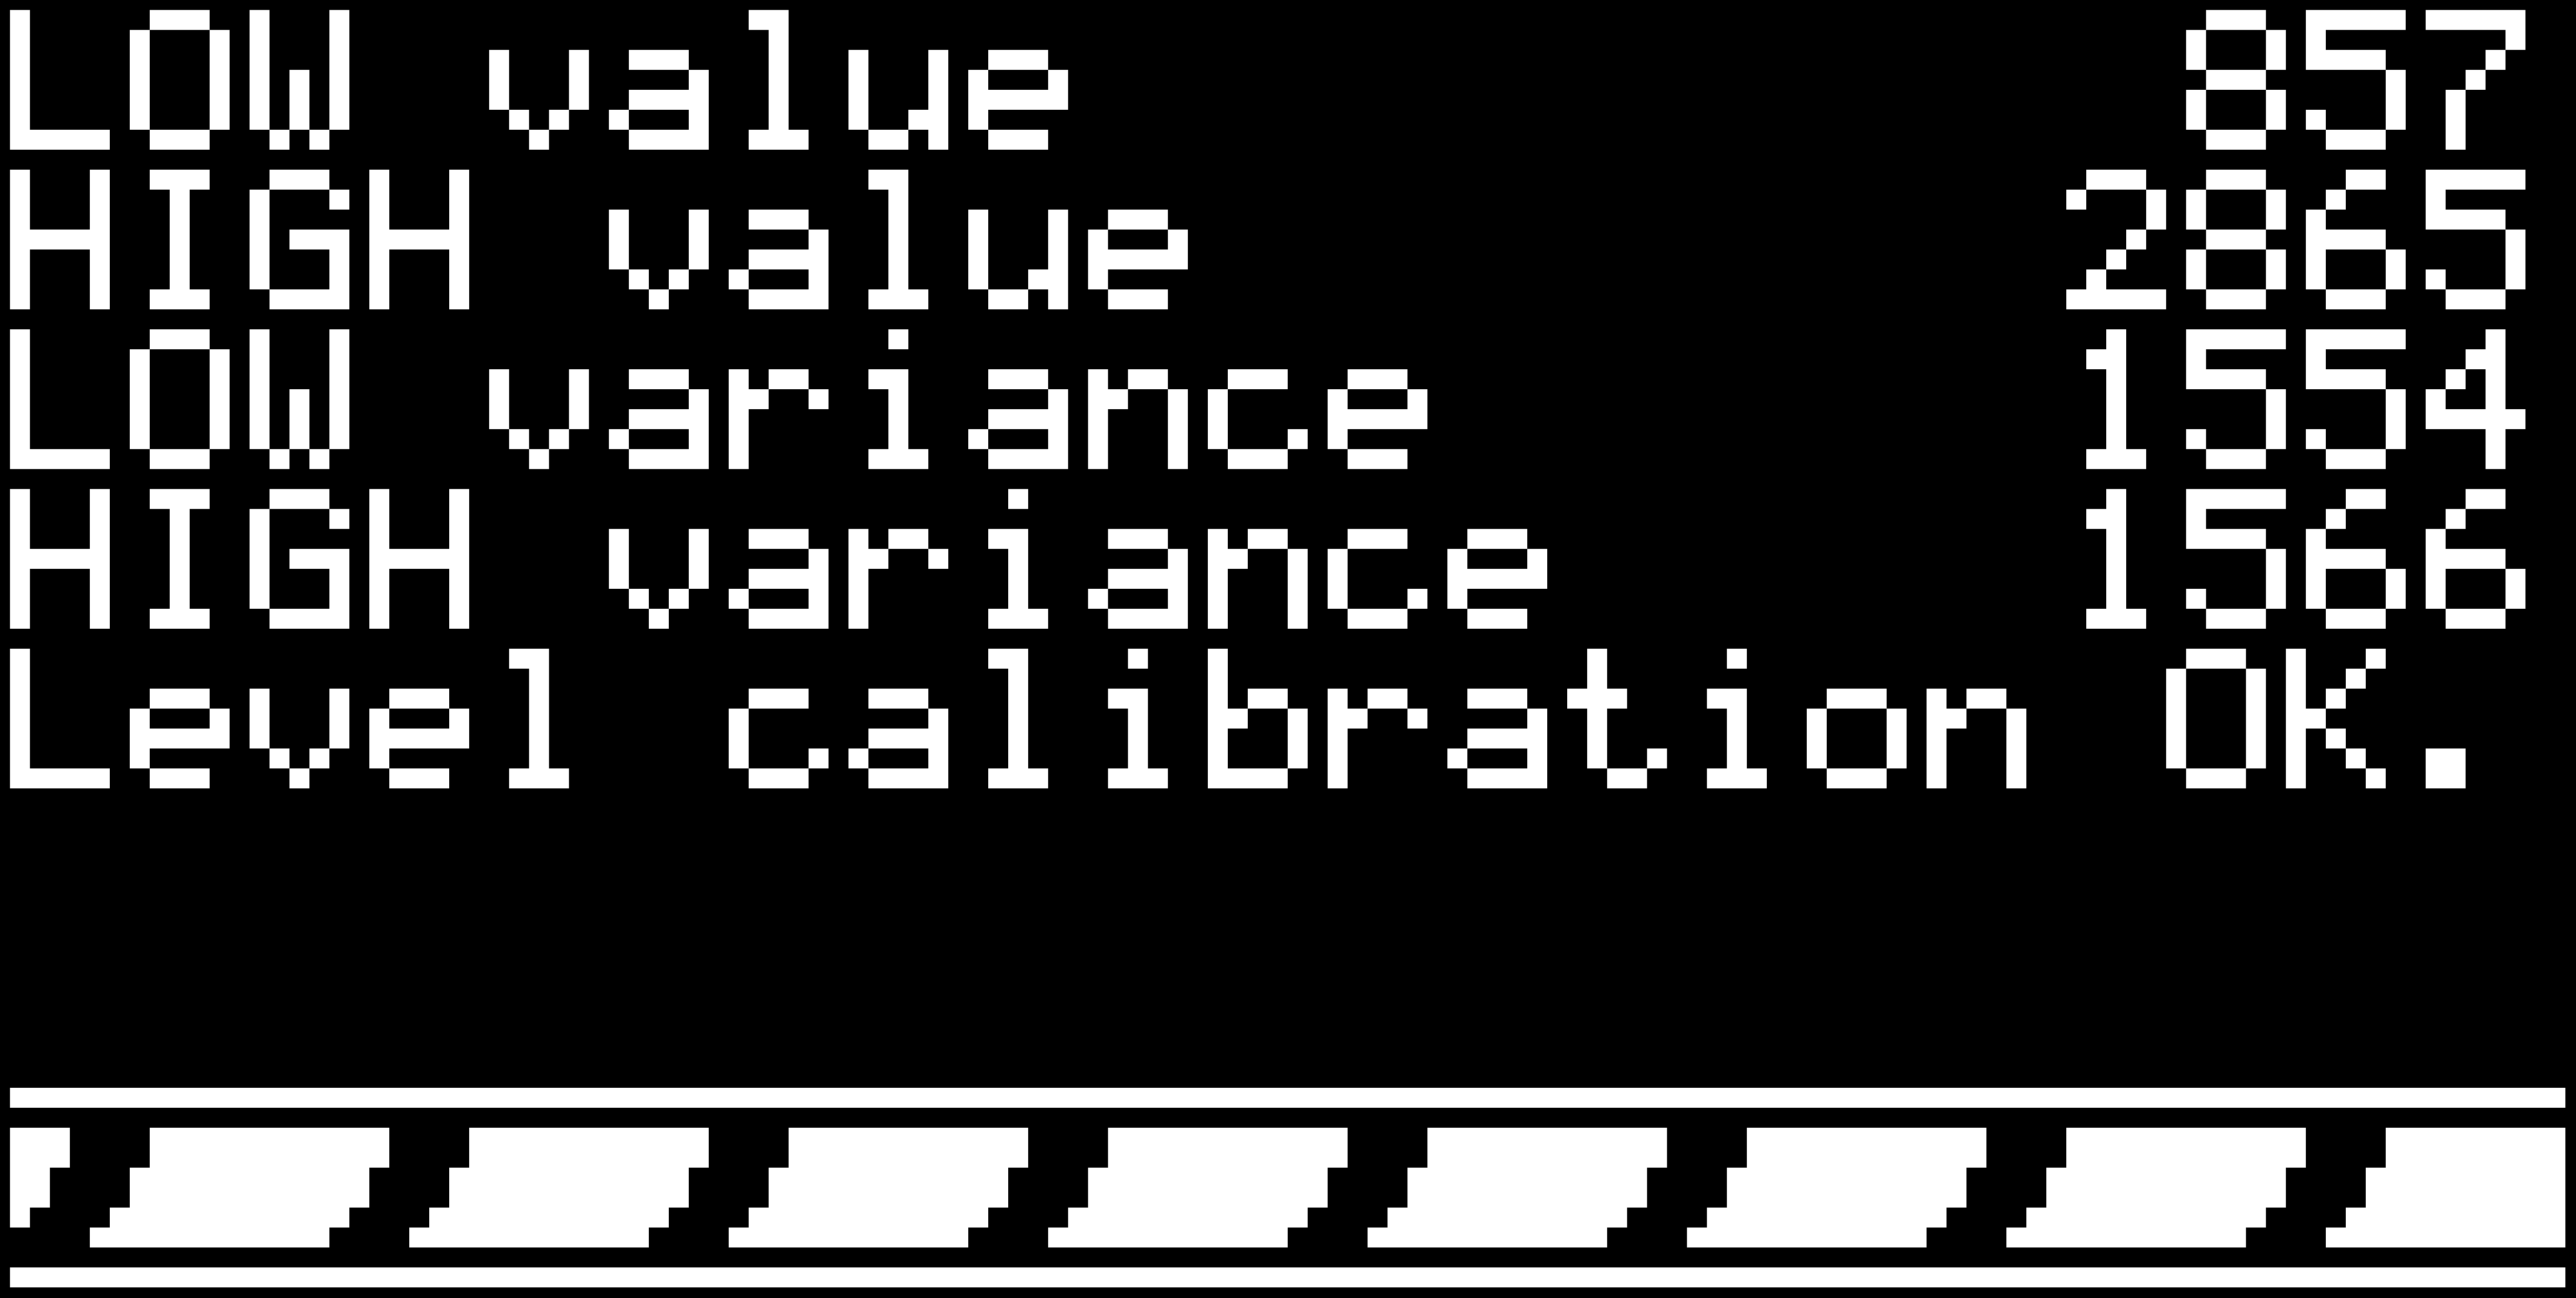
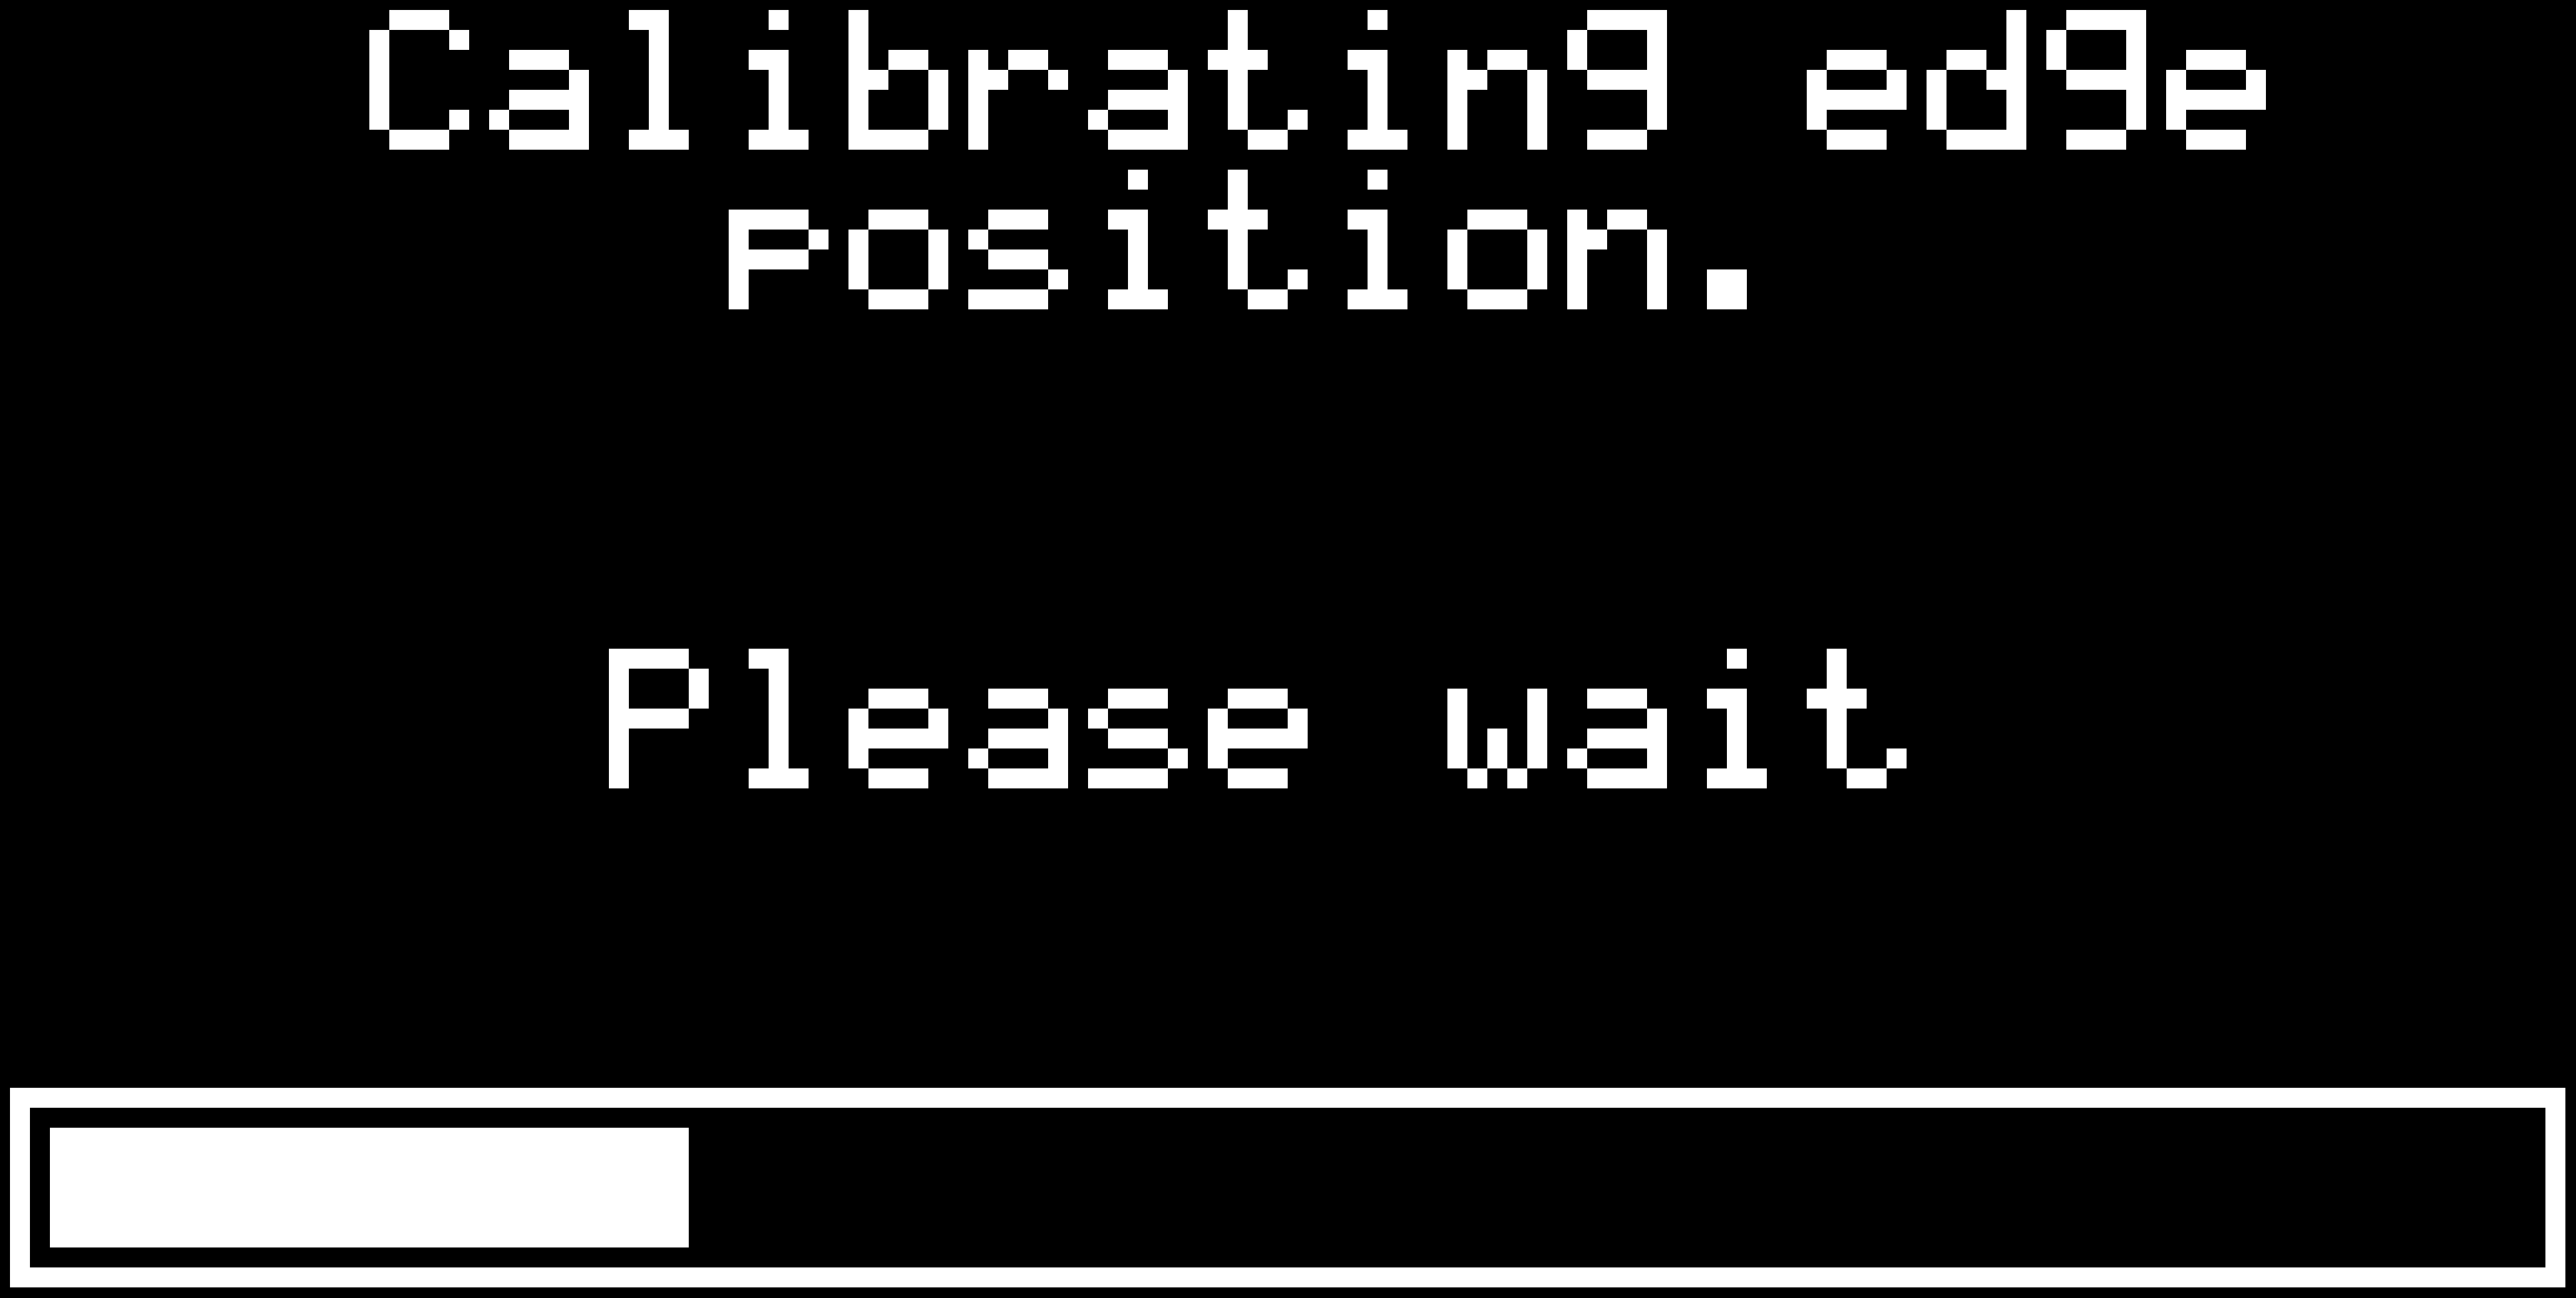
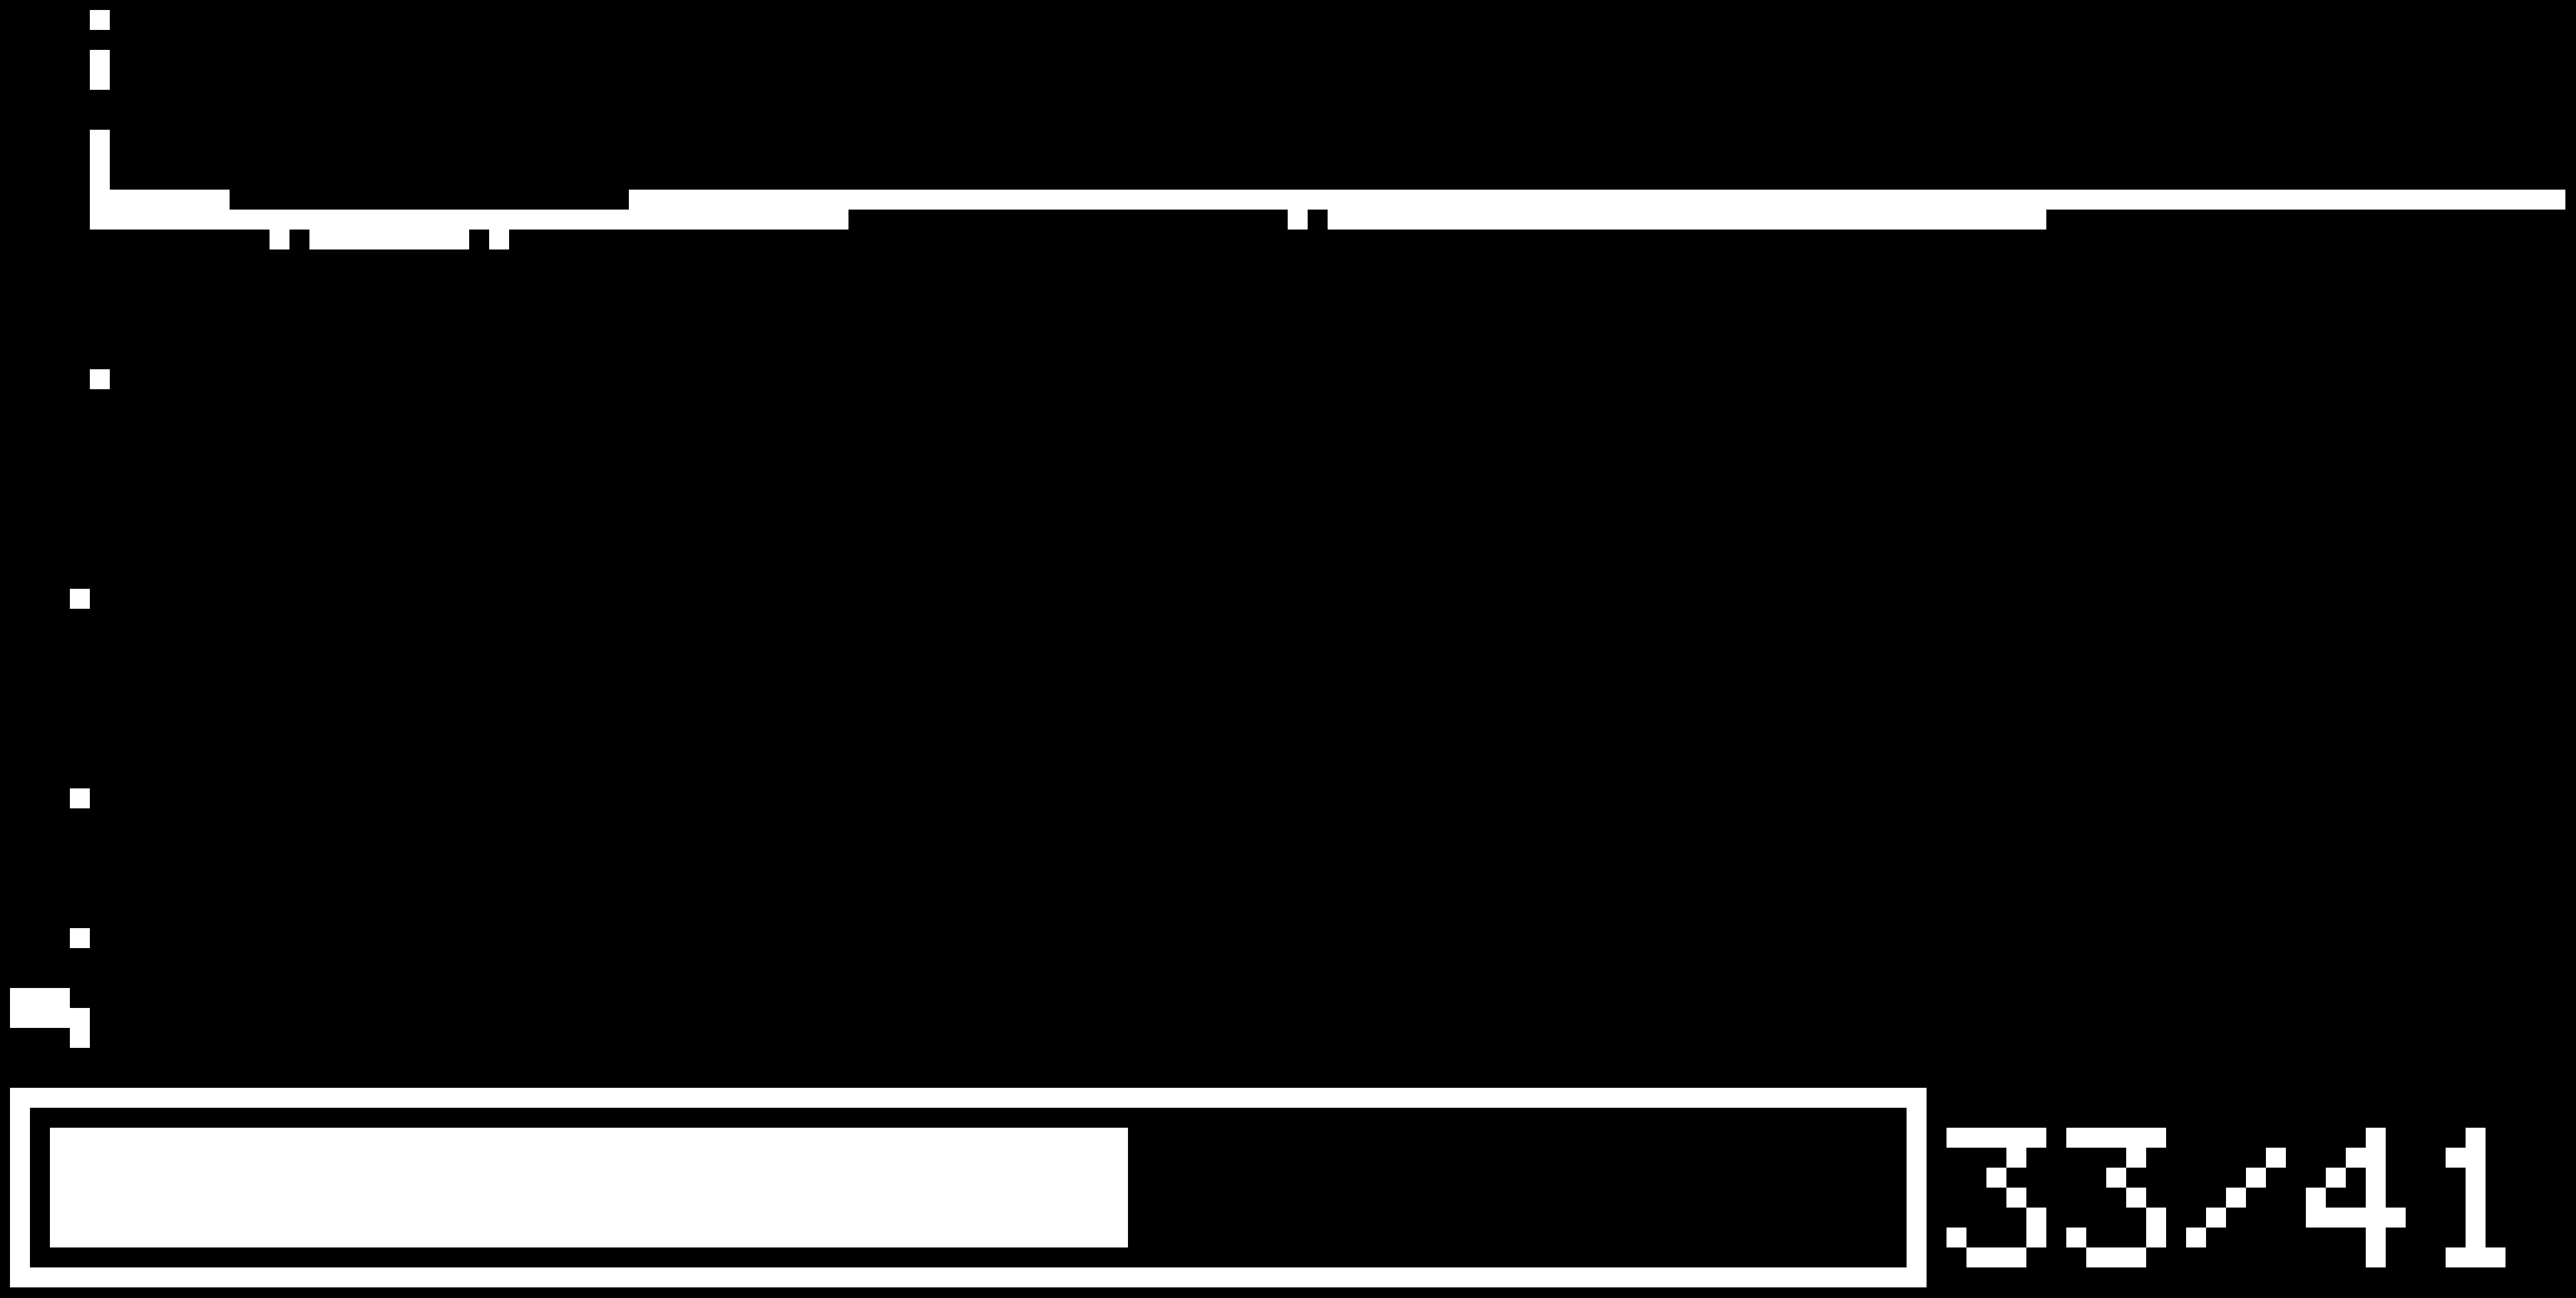
When the measurement is done, you will be presented with the measured data. The GUI zooms in the data so that each pixel equals one sample (the smooth zooming effect is quite nice) and then scrolls from the beginning of the measured data up to the first found discontinuity, waits there for a while, then shows you the measured reflection coefficient and the position of the discontinuity in the cable. The position is given in picoseconds, because the reflectometer knows nothing about the cable including the phase velocity in the cable. So it's up to you to calculate the spatial position of the discontinuity.
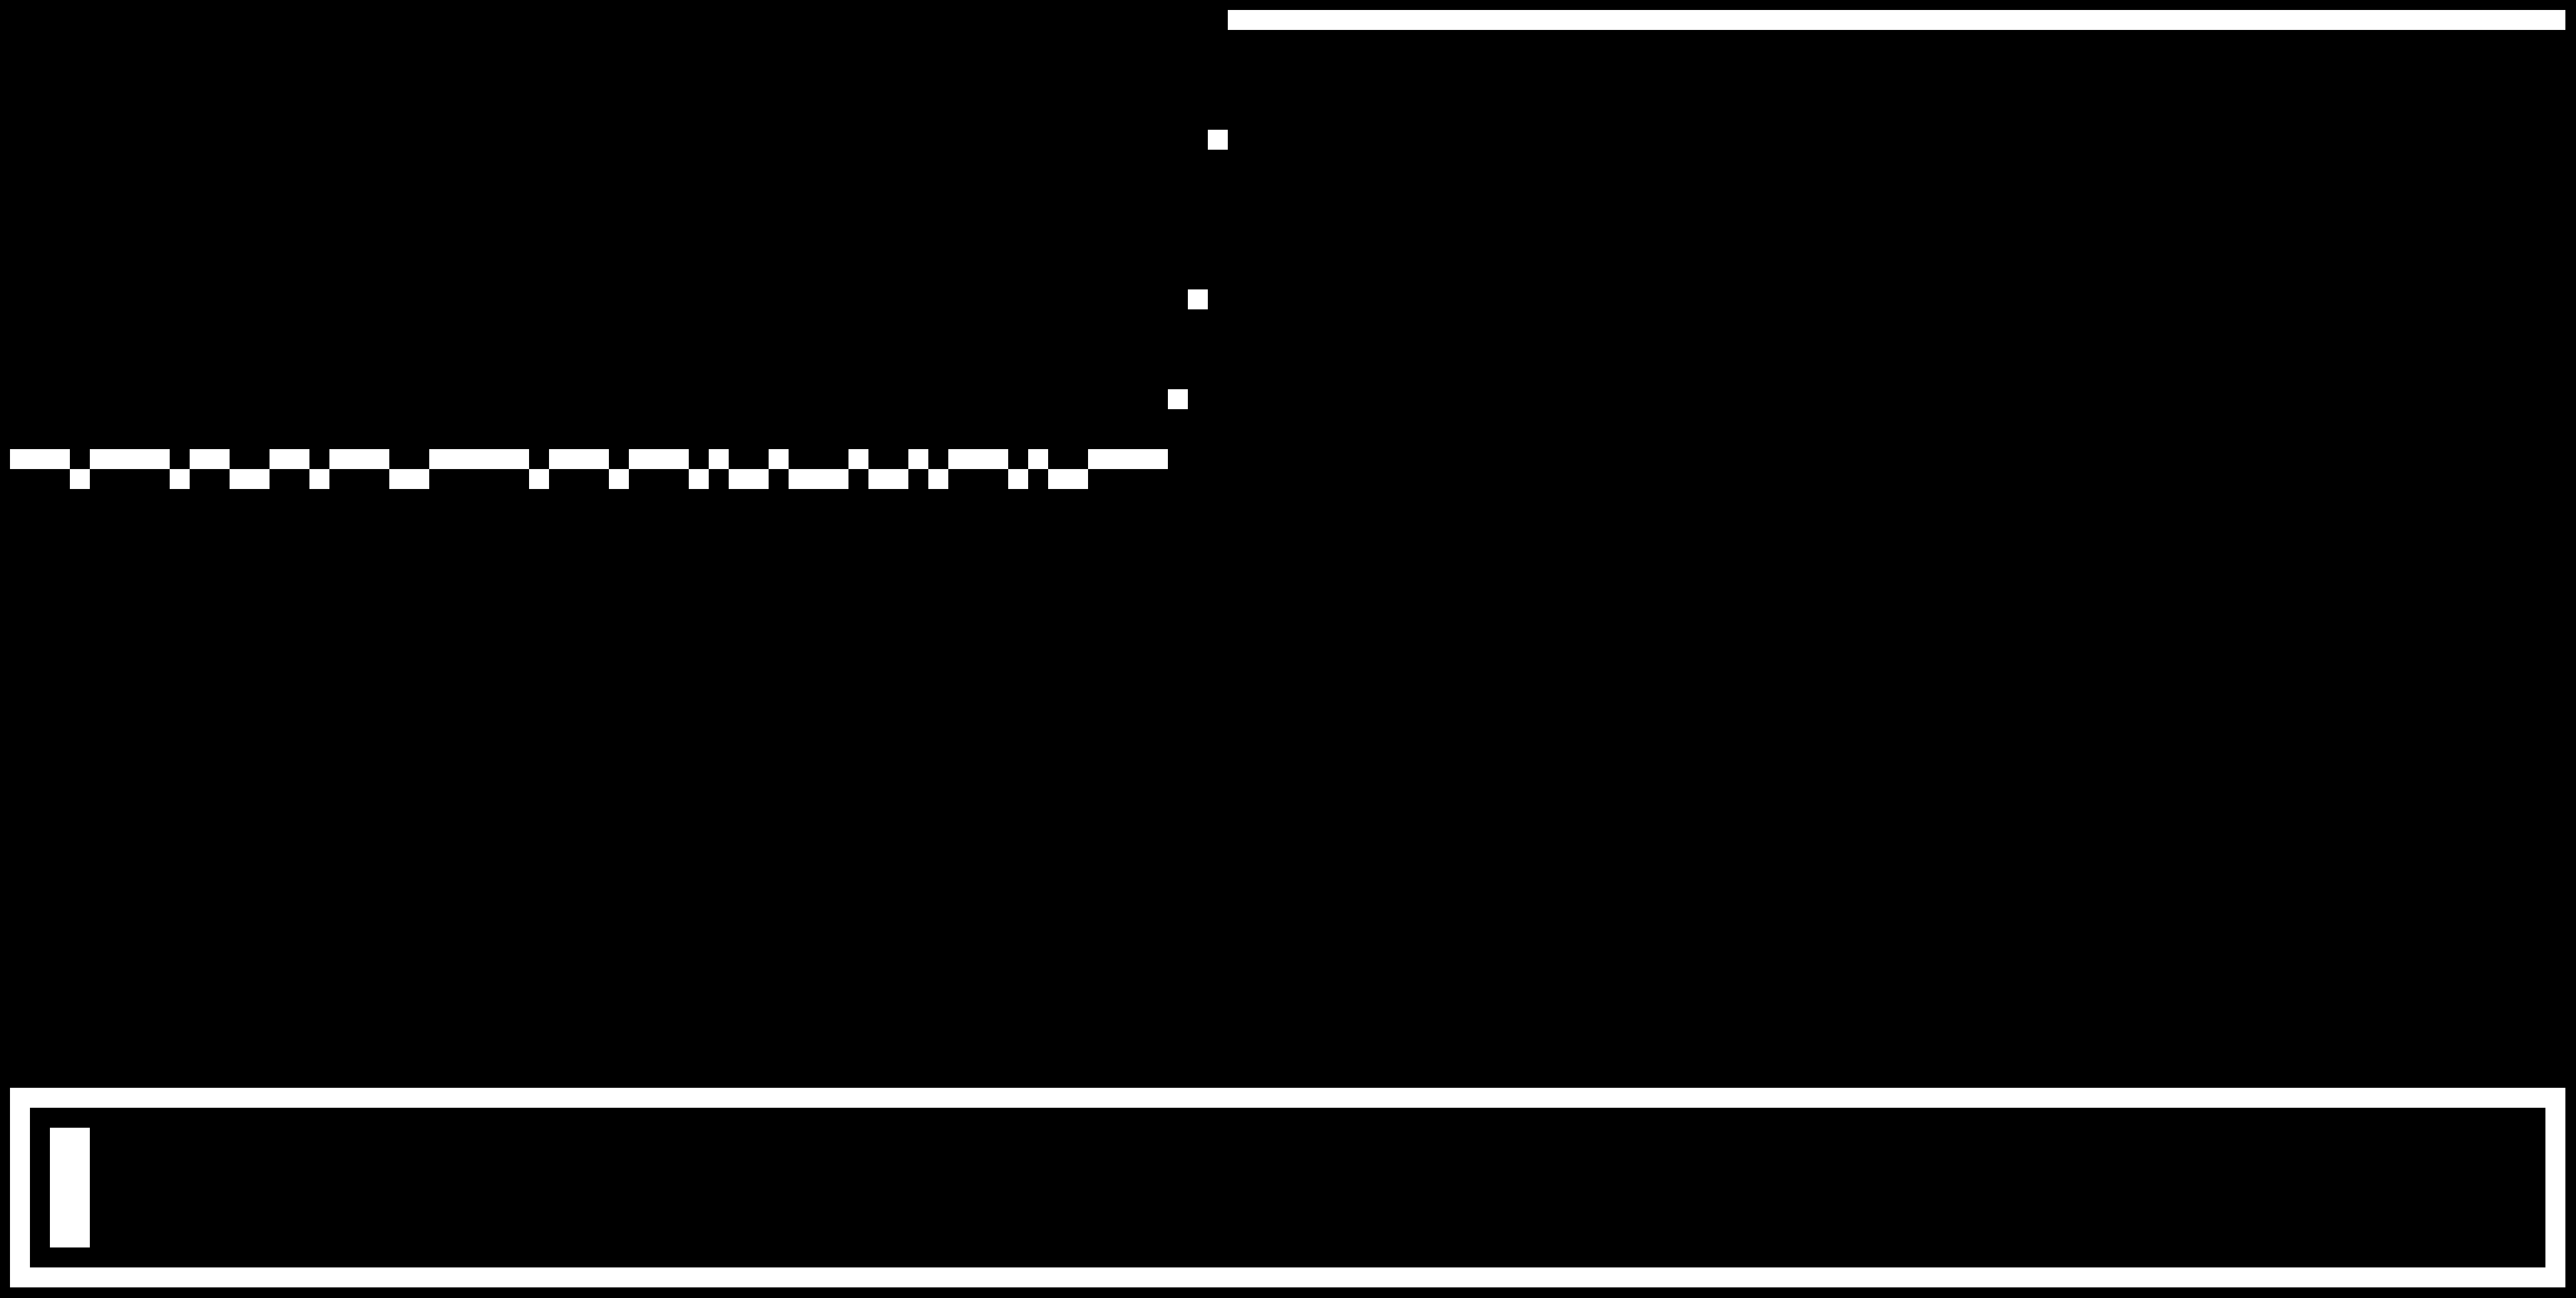
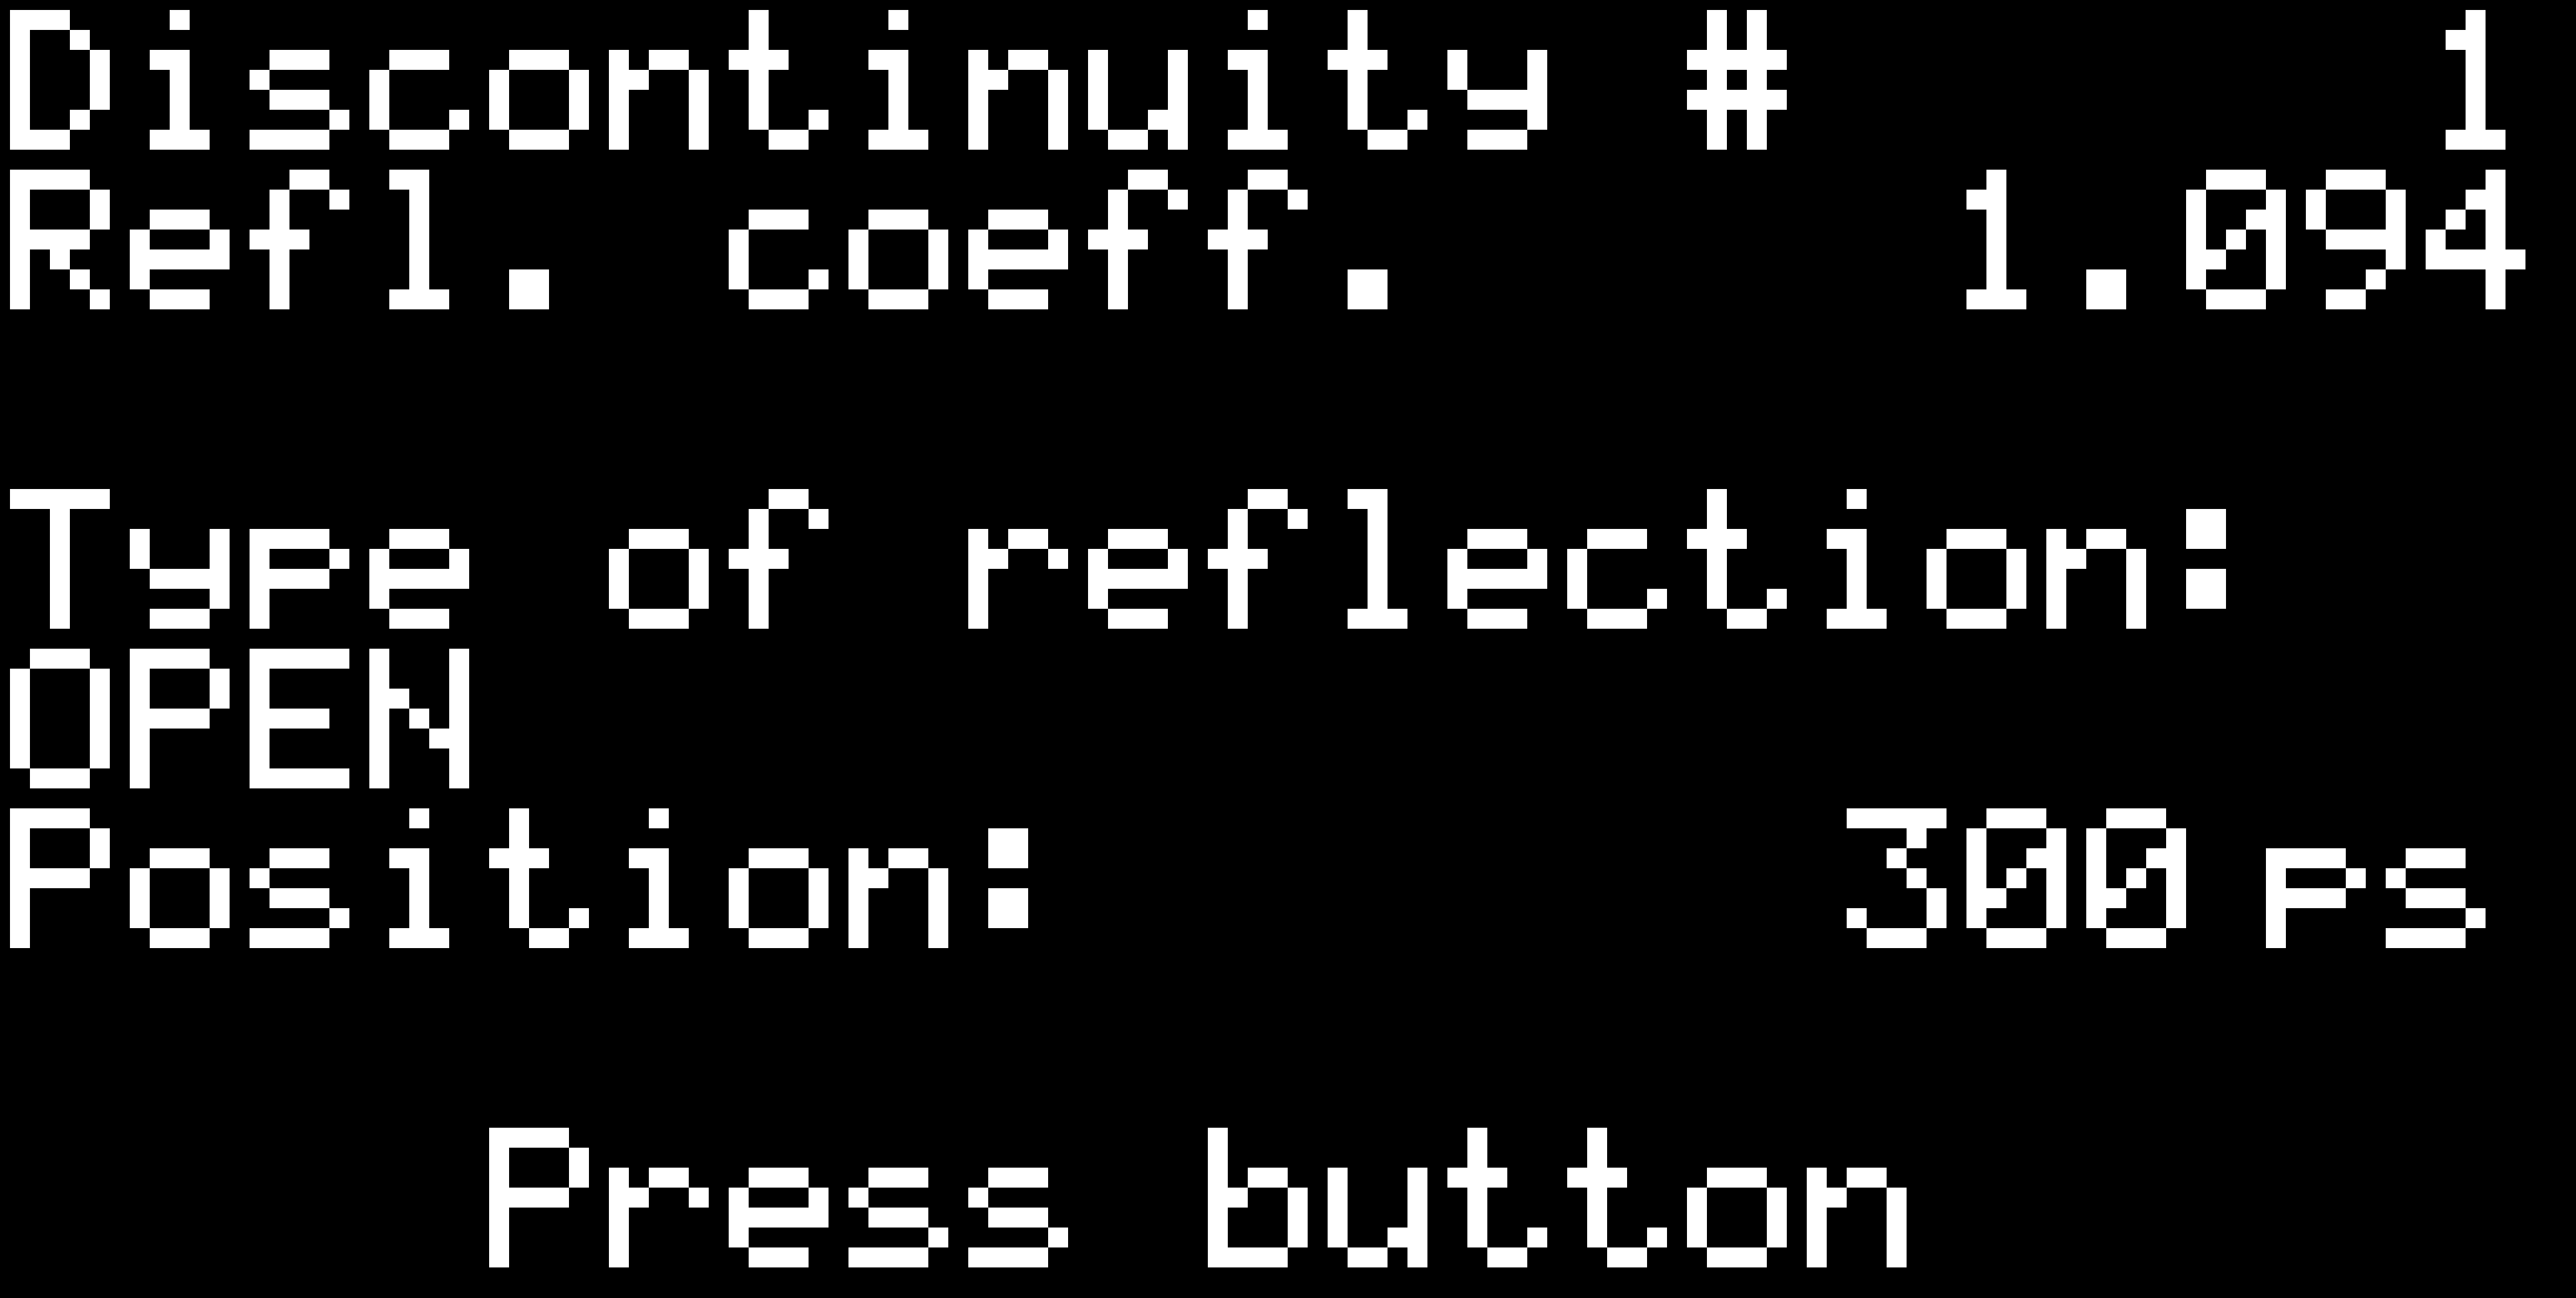 As you can see, it tries to detect the type of the discontinuity. It can detect "open", "short", "doubled impedance", "halved impedance" and for other cases it only shows "higher impedance" or "lower impedance".
The position given in time and not in spatial dimensions is not a serious limitation of the firmware, since there are only two ways to measure the physical length of a cable using one-port measurement. The simple one is a case when you know the type of the cable and its velocity factor. The other one requires measuring the total physical length of the cable and then trying to measure the total electrical length, which might be impossible in case of heavily damaged cable. Adding this feature would require an input method for typing numbers (the built reflectometer has only one button). Using a calculator or multiplying in one's head sounds more reasonable to me than adding a keyboard, but I expect someone could argue that I should have added the keyboard (and yes, I could have).
And that's all it does. Simple, easy to use, self-explaining, guides the user from power-on to results. For more involved analysis, there is the second GUI.
Octave GUI
This GUI runs as an Octave script on computer. Theoretically, it can run on anything that has USB, runs Linux and has Octave with support for serial ports. Once you launch it, you are greeted with a window telling you to connect the reflectometer. Well, not greeted, but... well, at least it tells you so. It's not an example of good looking GUI, but I don't count myself as a programmer and even less an artist so please excuse that.
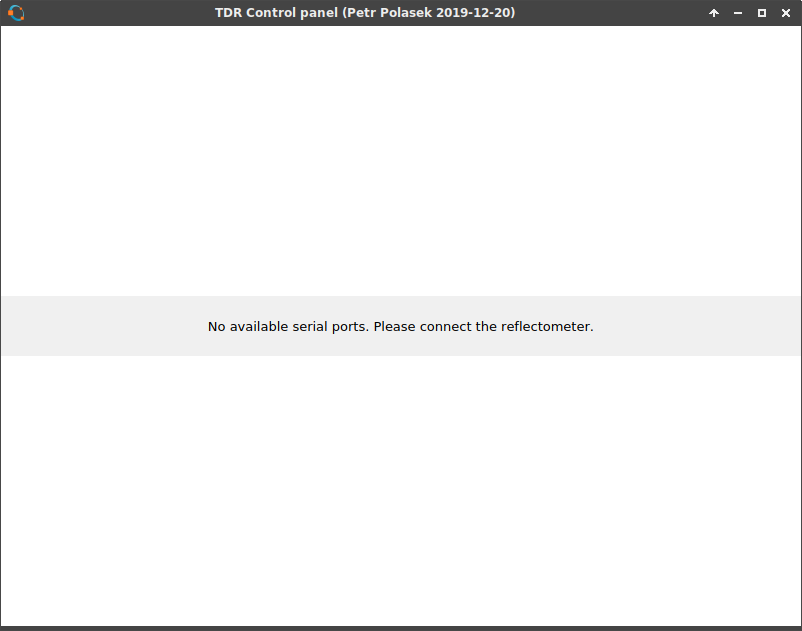 And it can even tell you if you are running the Octave binary from Flatpak with restricted access to serial ports and tells you how to correct it.
If there are other available virtual serial ports, it probes them if they are connected to the reflectometer. If not, it waits for you to connect the reflectometer. After a new serial port appears, it tries to connect to it. If it is the reflectometer, it tries to connect to it.
 After a handshake is performed, the GUI tells you the version of the firmware (time of compilation) and then finally connects to the reflectometer.
You may ask what happens to the reflectometer after the computer has connected. Is it paralyzed and can be controlled only from computer? The answer is no. It only knows that it is remotely controlled and can still be controlled using the physical button (the Octave script expects it as well and won't start to behave funny). The whole state machine of the autocalibration procedure and measurement is running inside the reflectometer, so nothing will happen even if the Octave script fails and stops. Just start it again and the Octave script will ask the reflectometer about its state and then continues where it left off.
There is only one difference between the reflectometer's behaviour when running with computer. It doesn't run the graphical representation of measured data after the measurement has completed. Instead it waits for the computer to download the measured data (and the firmware tells you about it graphically, again). So technically, it is possible to get into state when you have shut down the script and the reflectometer waits infinitely for the computer. I will probably change this behaviour later.
The Octave GUI also tells you about all the steps of autocalibration and gives you orders what to do. And all of the buttons which should not be clickable at any moment are properly disabled and are not clickable.
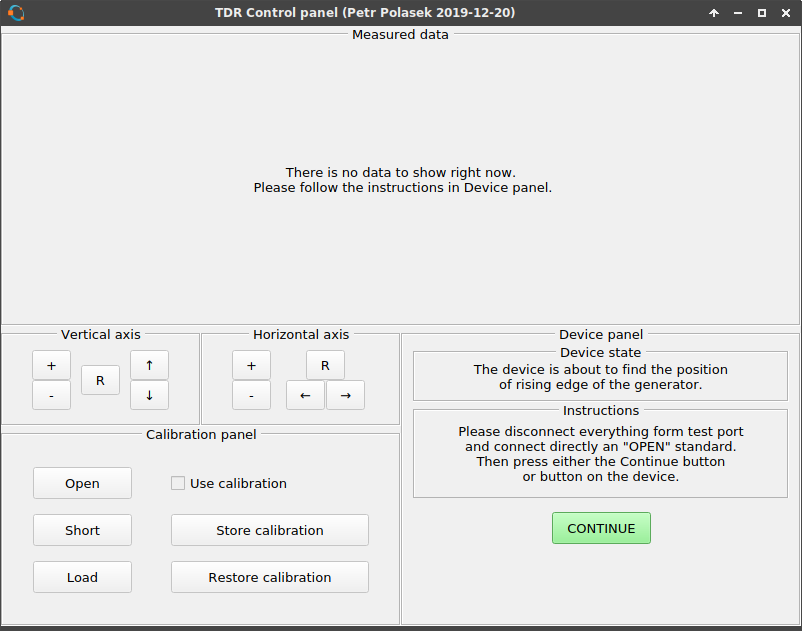
When you get to the point where you can run a measurement, you can even set the number of averages (it defaults to the optimal number calculated during autocalibration). It can be set in range 1-64. Maybe I will patch both the firmware and the GUI to allow more than 64 averages.
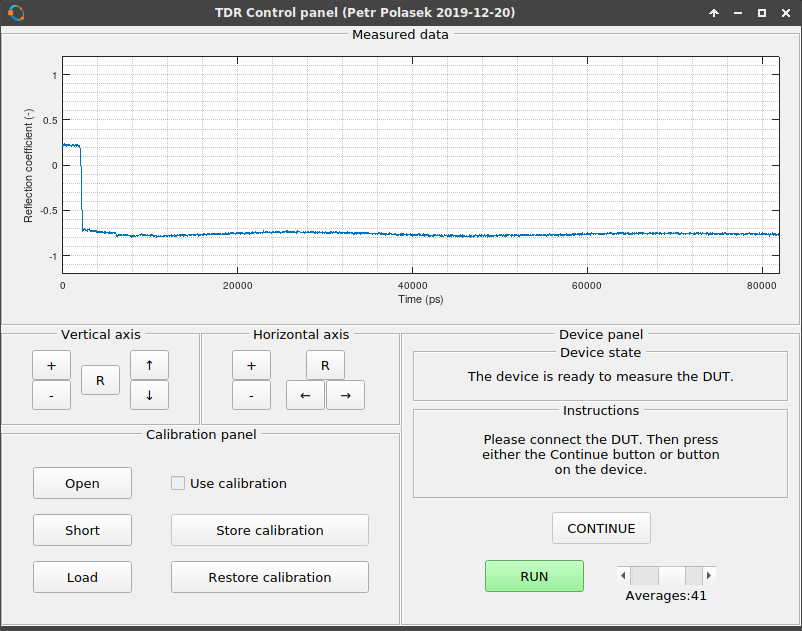
On the picture, you can see the measured data. It is slightly DC offset from the correc tposition and has a nasty distorted waveform. That can be easily fixed by performing "Load" calibration. That works by measuring the 50 Ohm standard and pressing the "Load" button. This stores the measured data and automatically applies this standard to the measured data by subtracting the standard from the measurement. Whenever a calibration is stored, its button turns yellow to signal that it has already been done. You can see the effect of applying the "Load" standard to the measurement. The waveform is no more "wavy", it is almost flat now. And the DC offset is gone as well. However, this is only a simple calibration which has very limited abilities.
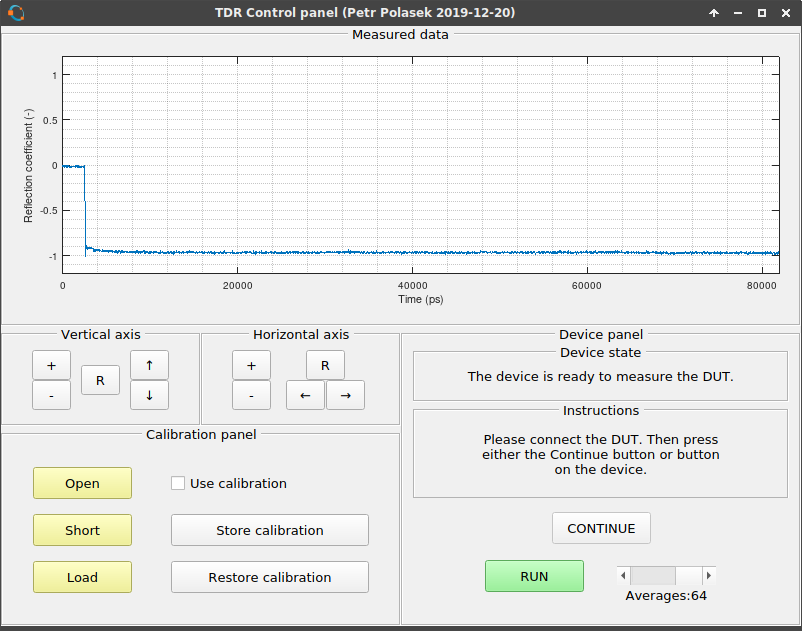
The GUI also has a standard open-short-load calibration algorithm built in, however it seems a bit broken to me. First problem is that the version you can find both on Github during the time of writing and here as a ZIP file shows the data after calibration in form of impulse response instead of step response. Therefore the data look different from what you would expect from TDR. This can be fixed easily by showing the data as a cumulative sum (each point is a sum of the preceding point with itself). This corrects it back to step response. However, the measurement is "bent", probably due to some mistake when playing with all the FFTs and IFFTs. I think that the FFT doesn't like the step waveform with non-zero average and the calibration then causes some non-existent low frequency components to emerge. I am going to fix this as well.
Of course, the calibration can only be applied once all three calibration standards have been measured. The standards can be removed by clicking on its corresponding button again. The calibration can be stored to file or retrieved from it, however no way for defining your own file has been implemented. The reason is that at each boot, the DC offset and the time offset of the rising edge can be slightly different, thus invalidating the calibration. Therefore, storing or retrieving the calibration is only usable during the time the reflectometer is running. So, no ability to use more calibration files was implemented.
The graph can be interacted with by using the buttons on the "Vertical axis" and "Horizontal axis" panels. It allows you to zoom in and out (each time zooming in or out by a factor of 2) and also shift the axis (shifting happens by shifting by one half of the range being shown). There is also a useful "R" button for resetting the axis once you get tired of playing with the graph. It gets reset also by performing a new measurement. I should probably fix that as well.
Next time, we will probably meet with measured parameters.
 MS-BOSS
Discussions
Become a Hackaday.io Member
Create an account to leave a comment. Already have an account? Log In.