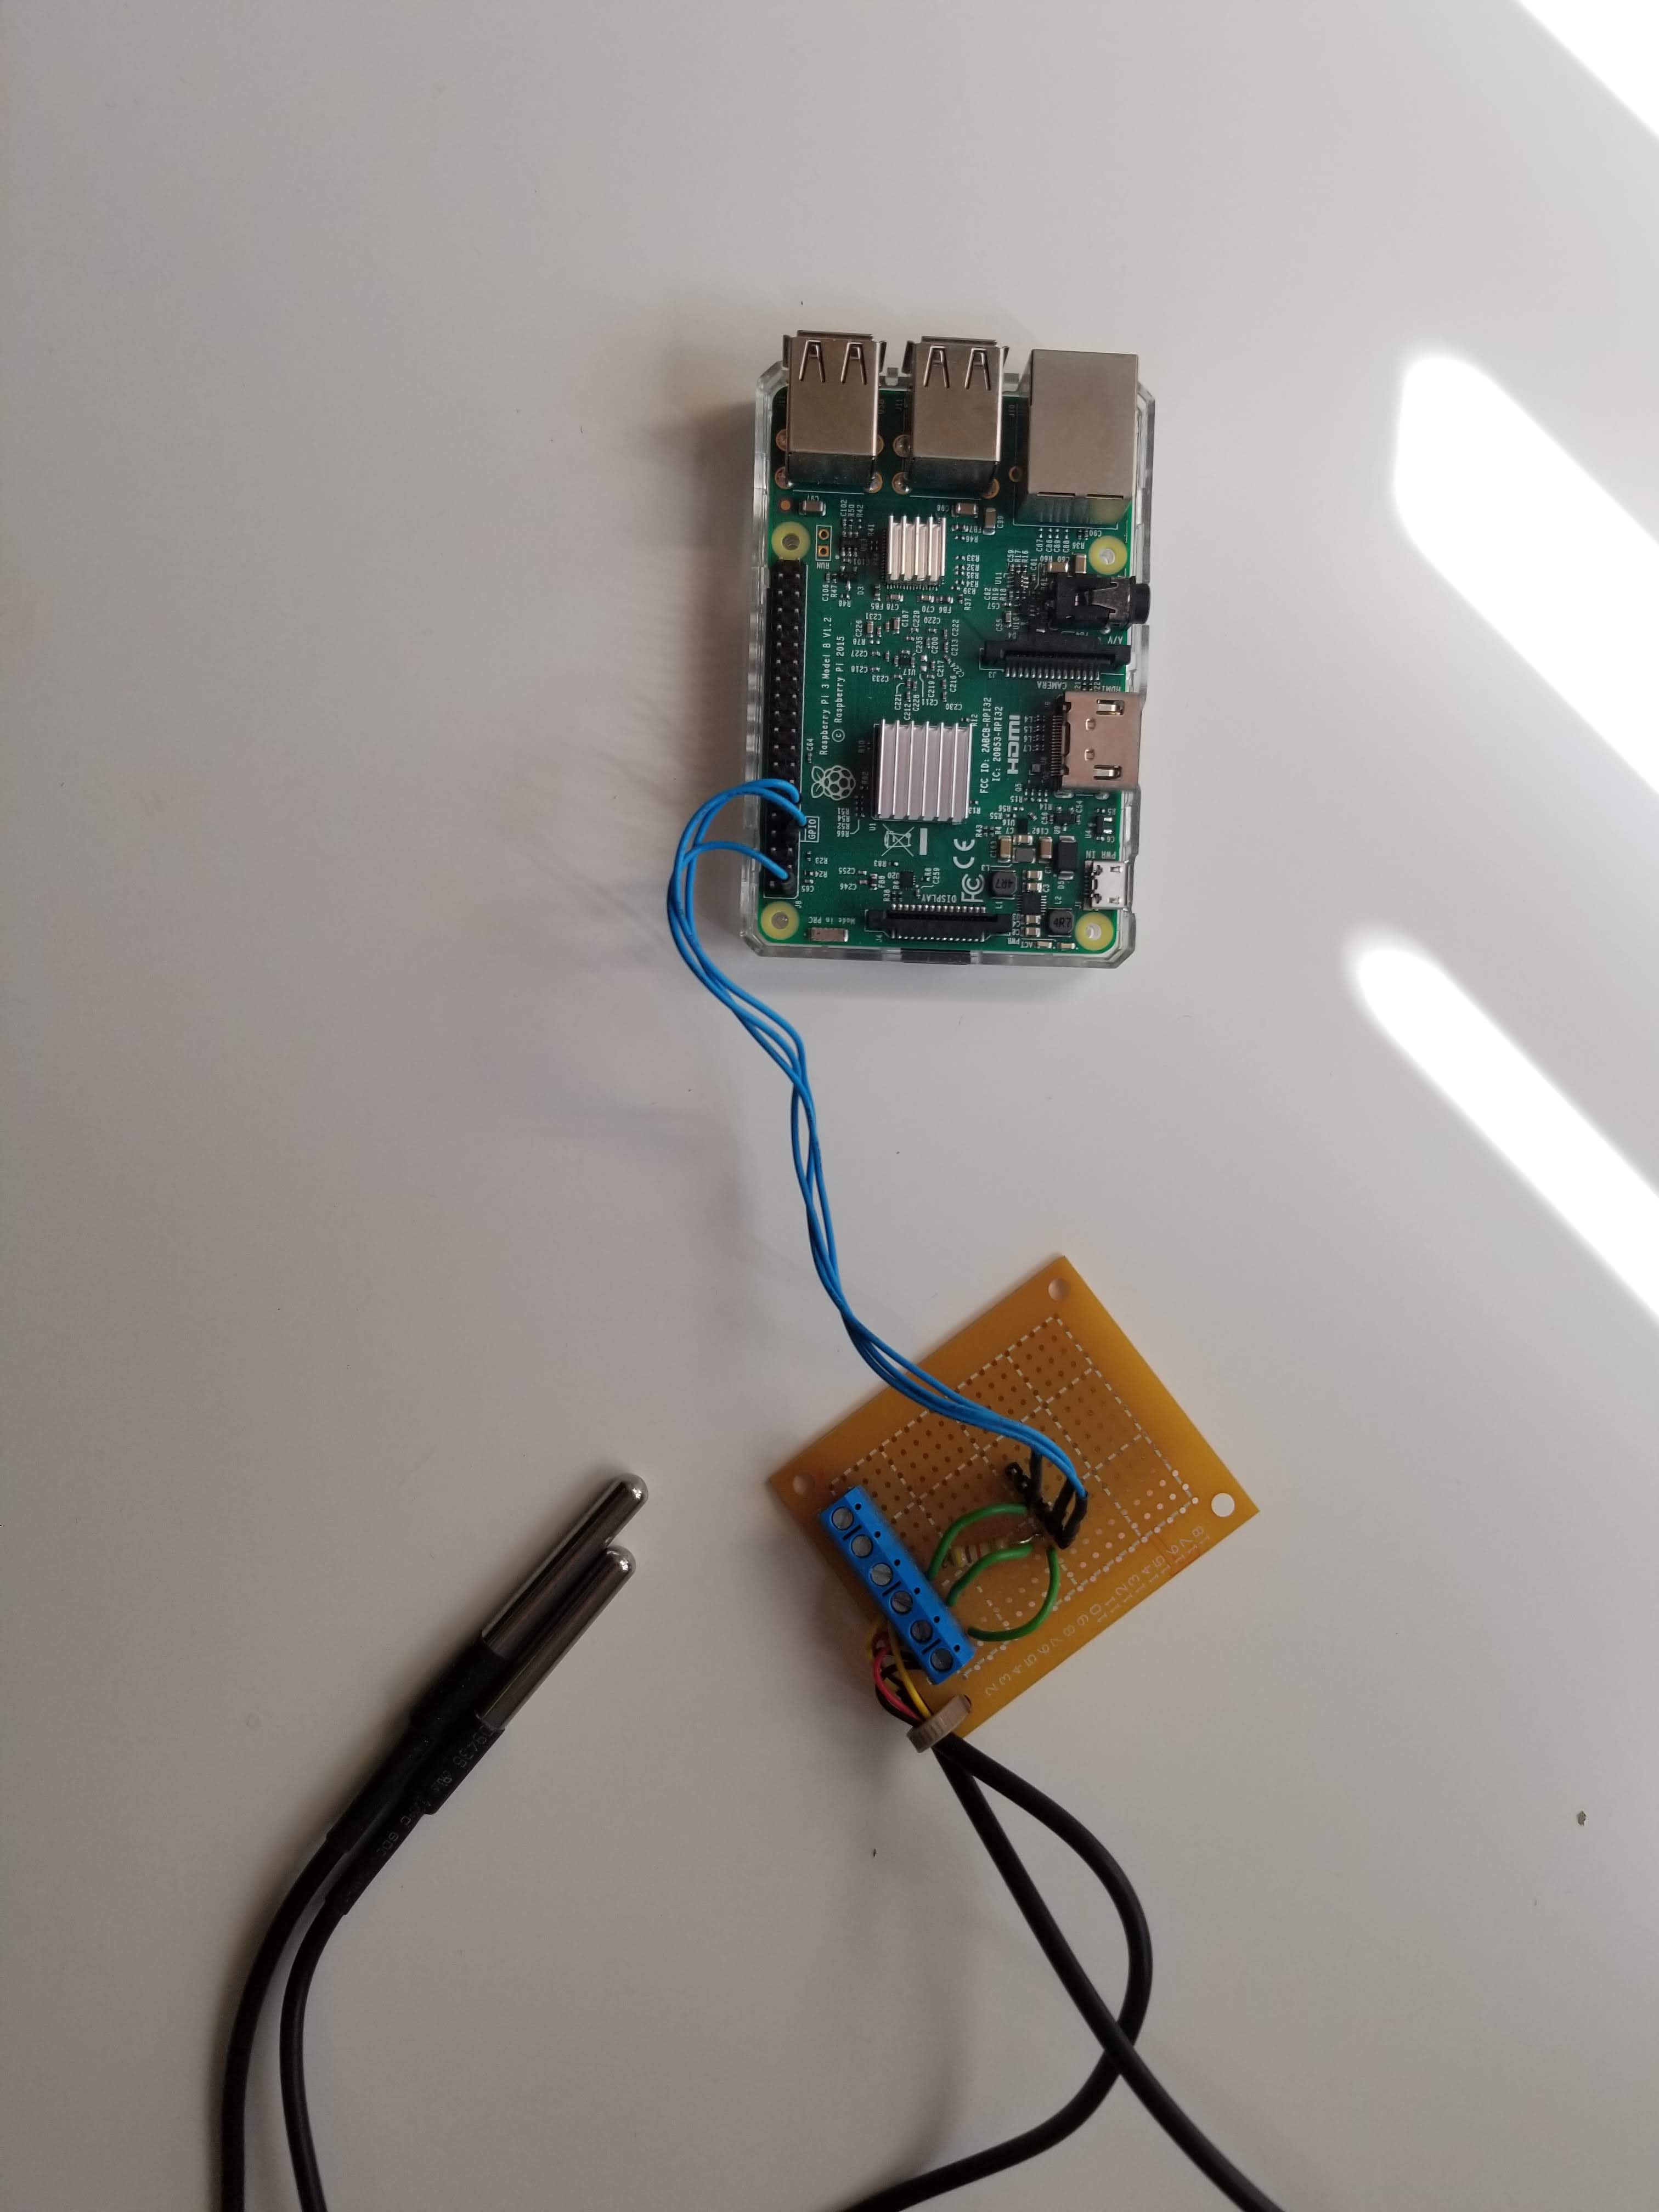
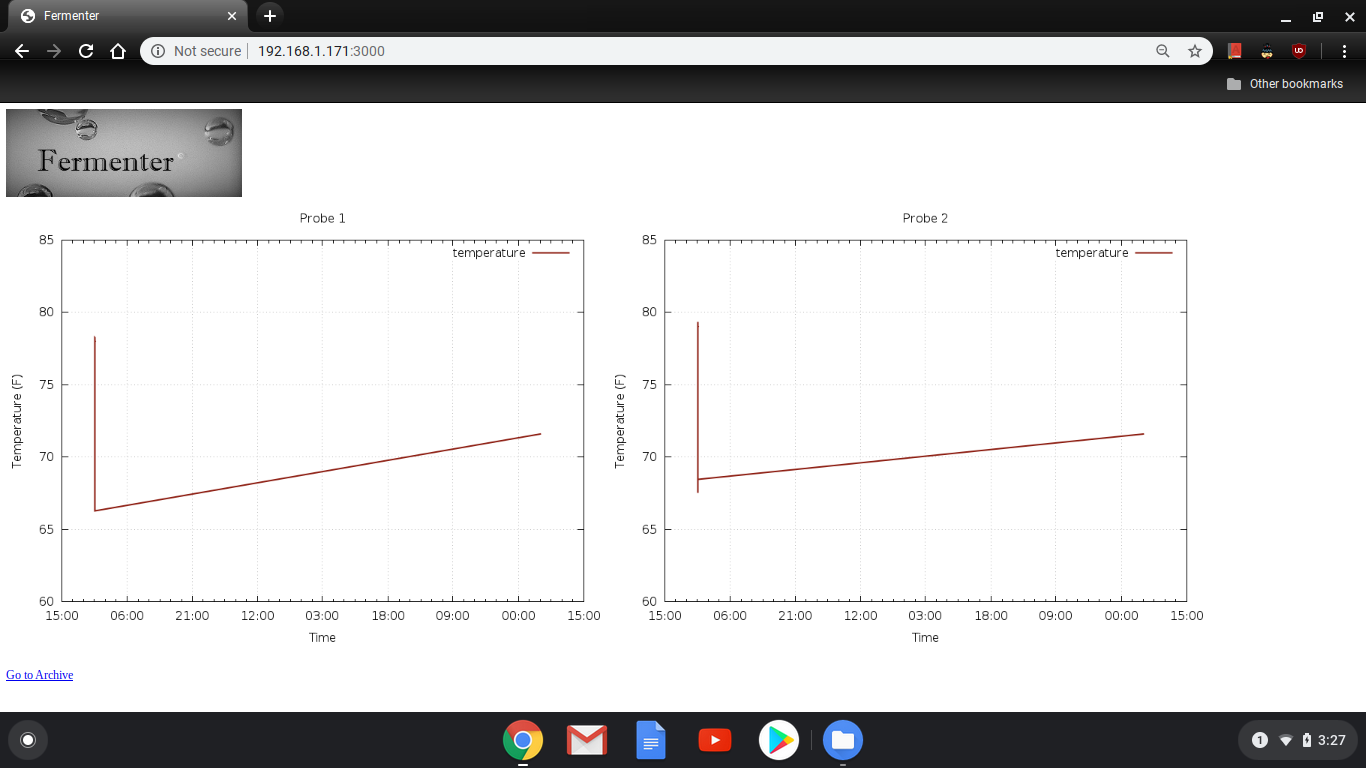
I am not starting this project from scratch, some work I had done a few years ago. I've outlined that work below and included references to some helpful tutorials/posts out there that I used to start out.
The first step was to setup the Raspberry PI with a temperature probe. I used the DS18B20 temperature probe because it was readily available, covers the expected temperature range, and multiple probes can be used with minimal wiring. Setting this up was relatively straightforward, I followed the adafruit guide linked below.
Adafruit guide on setting up the DS18B20: https://learn.adafruit.com/adafruits-raspberry-pi-lesson-11-ds18b20-temperature-sensing
Running python script on boot: http://blog.scphillips.com/posts/2013/07/getting-a-python-script-to-run-in-the-background-as-a-service-on-boot/
The second step was to save temperature data in order to plot it. I wrote a python script to record the timestamped temperature data and save it to a file. A separate script was used to plot this data using GNUPlot and save the plot as an image.
More information on how GNUPlot works: http://raspberrypi.tomasgreno.cz/plotting-graphs.html
In order to display these graphs, I setup the raspberry pi with a network location and a page which displays the temperature graph. The guide was very helpful in setting up the NodeJS on the Raspberry PI: http://thisdavej.com/beginners-guide-to-installing-node-js-on-a-raspberry-pi/
Website hosting on Raspberry PI: http://readwrite.com/2014/06/27/raspberry-pi-web-server-website-hosting
My codebase is on Github at https://github.com/Krockwell/rpi_beers


 Krockwell
Discussions
Become a Hackaday.io Member
Create an account to leave a comment. Already have an account? Log In.