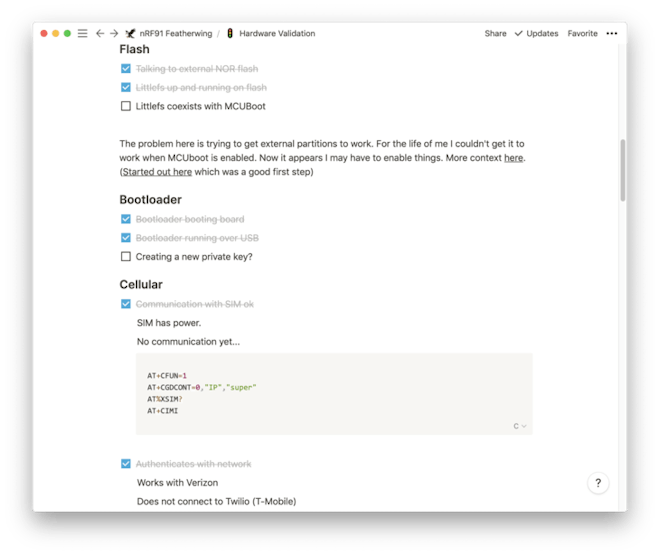
This week, the nRF9160 Feather got some more attention. I even got it to roll over. 😇 To top it all off, my hardware validation list is looking good!

There’s still tons to do but it’s been a very promising start!
In this post I’ll discuss the state of things and where hardware, firmware and more are going next.
Let’s do this!
What’s in the box?
There’s a ton to Zephyr. Let’s face it, there’s an overwhelming large amount of libraries, sub-libraries, and samples. Nordic’s Connect SDK requires several different repositories to make things work.
Here’s what a typical top level directory looks like:
- bootloader - the MCUboot bootloader used for the nRF9160 (and other boards)
- mbedtls - a library imported by the SDK. Used for encrypting/decrypting data
- modules - modularized external libraries (littlefs, etc)
- nrf - most Nordic samples live here
- nrfxlib - the main set of Nordic based libraries and code.
- test - testing infrastructure
- zephyr - the main OS libraries, board definitions and more samples
The biggest difference between the Nordic’s standard and Connect SDK is the sample code. For the standard SDK, they’re all located in one place. Whereas for the NRF Connect SDK, they’re scattered throughout every repository involved. For instance, the basic blinky example is in zephyr/samples/basic/blinky. The complex Nordic specific samples are in the /nrf/samples directory.
Why is this?
The folks behind Zephyr were smart and make their samples generic. Meaning that you can run them on any piece of hardware. The only limitation is to make sure you have a hardware definition for your board!
An important sample
The most important sample that I had found in the nrf directory was the at_client firmware. (under ncs/nrf/samples/nrf9160/at_client)Along with nRF Connect (for Desktop), it makes a potent combo for debugging. Plus it’s a great tool for surveying your current area for M1/NB1 service.
For me, it was a great tool to make sure that the nRF9160 Feather was working a-ok. The only change I had to make was to the prj.conf file. I added a section that allows you to set the PDP context (i.e. set the APN)
# Set the PDP context
CONFIG_LTE_LINK_CONTROL=y
CONFIG_LTE_PDP_CMD=y
CONFIG_LTE_PDP_CONTEXT="0,\"IP\",\"hologram\""
In my case, I was testing holigram. Their APN is also named holigram. For other providers, like Twilio, theirs is different. Twillio’s “Super” SIM uses super. Their standard wireless service is wireless.twilio.com. In some cases, like AT&T and Verizon, you do not have to set the APN. It’s set for you by the modem firmware.
Building and flashing the firmware is a breeze. Here’s what it looked like on my end:
west build -b circuitdojo_feather_nrf9160_ns
west flash && nrfjprog -r
Then opening up the serial console, as I talked about previously and typing in AT. You should get an OK back. Disconnect from the terminal though, the LTE Link Monitor will need it!
Nordic’s LTE Link Monitor
You use the Link Monitor to connect directly to the at_client firmware. You can either enter AT codes manually or have the Link Monitor run through them. As of this writing though, the LTE Monitor does not support connections that do not have flow control!
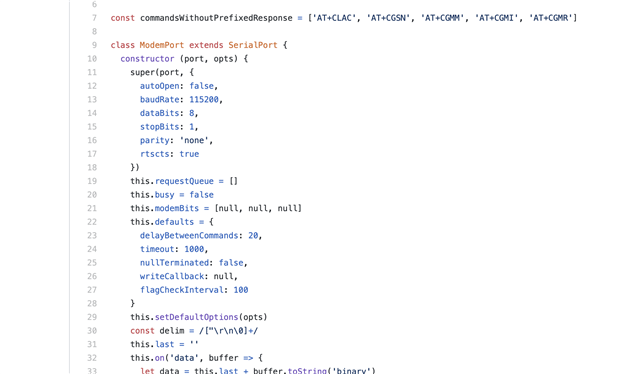
Oh but I didn’t know that going into it. After a few hours of debugging, and posting to Devzone I found my answer. The ModemPort library, used in LTE Link Monitor, initializes with rtscts support always on.
Not great for non-flow control boards, right?

Fortunately, rebuilding with rstcts to false fixed things. That wasn’t a piece of cake though.
There was yet another set of problemsthat turned me intro a giant stress ball. Fortunately changing some of the dependencies in package.json seemed to fix it!
After that, I was off to the races!
Here’s what things look like when you first make a connection.

If you haven’t already, select your serial port in the top left. If it’s not showing up make sure that you un-check Auto device/port filter. That’s located in the bottom right. (See the above picture). In my case, it’s called /dev/tty.SLAB_USBtoUART.

Once you select your port, it should start streaming commands. Pay attention to the right side of the screen. When the Link Monitor receives updates, it reflects that in the status area.

You should see a ton of activity. If not make sure you enable Automatic Requests (bottom right side checkbox, checked by default). If you are using flow control, then UART will be green as well. If not, it will remain red.
Imagine for a second, the happy dance I did after a successful connection. This was only after several unsuccessful attempts using other cards.
When you’re ready to start testing with any nRF9160 based board, (including the nRF9160 Feather), the LTE Link Monitor is your friend. For more information about how to use, you can download the LTE Link Monitor guide here.
SIM testing update
As you can imagine, testing hardware and firmware is one thing. Testing wireless services is a completely separate prospect! I have some notes in the table below on the services and SIMs that i’ve tested thus far. Your mileage may vary, especially if you’re not within the USA.

Overall, the results were frustrating. This is most likely due to the fact that either
- There is no service in my area
- Or, the service is blocking your device from connecting because of an invalid IMEI.
In either case, i’ll be making more progress in the weeks to come!
 Jared
Jared
Discussions
Become a Hackaday.io Member
Create an account to leave a comment. Already have an account? Log In.