 zpekic
Microcoding as a technique is very much aligned with "test-driven development" concept. Essentially it means first to build the scaffolding needed to test the circuit, and then the circuit itself. Just like the microcoding itself, the advantage here is customized debugging tailored to the exact needs for the circuit, yet following a standardized methodology.
In the CPD180X CPU, 3 main debugging techniques have been used:
- variable clock rate, including 0Hz and single-step
- visualizing the microcode / microcode controller state
- visualizing the controller circuit state (tracing)
- breakpoints
Any combination of the above can be used in any circuit, including none which would be appropriate for a mature well-tested design (and freeing up resources on FPGA and microcode memory). Let's describe them in more detail:
(1) CLOCK RATE / SINGLE STEPPING
Just like most circuits in FPGAs, microcode driven ones can operate from frequency 0 to some maximum determined from the delays in the system. At any frequency, the clock can be continuous, or single-stepped or triggered. In the proof of concept design, a simple clock multiplexer and single step circuit is used:
    -- Single step by each clock cycle, slow or fast
    ss: clocksinglestepper port map (
        reset => Reset,
        clock3_in => freq25M,
        clock2_in => freq1M5625,
        clock1_in => freq8,
        clock0_in => freq2,
        clocksel => switch(6 downto 5),
        modesel => switch(7), -- or selMem,
        singlestep => button(3),
        clock_out => clock_main
    );
(clock_out drives the CPU, from 2Hz to 25MHz frequency, either continous (modesel = '0') to single step (modesel = '1'))
Determining the maximum possible / reliable clock frequency is a complex exercise which is helped by most FPGA vendors providing their tools to analyse and optimize timings. From the perspective of microcoded control unit this boils down to single statement:
At the end of the current microcode instruction, uPC must capture the correct address for next instruction.
This further breaks down into 2 cases:
- If next instruction does not depend on any condition, the length of cycle must be greater than the delay through microcode memory (address to date propagation) + microcode controller multiplexor.
- If next instruction depends on the condition, then it must be greater than delay above + delay to determine the condition.
For example, let's say microcode with cycle time t has to wait for a carry out from a wide ripple carry ALU with settle time of 4t - this means executing 3 NOPs ("if true then next else next") and then finally a condition microinstruction ("if carry_out then ... else ...")
(2) MICROCODE STATE
Each microcoded design developed using this tooling and method will have the same "guts" - they will all have current uPC state, next uPC state, outputs of mapper and microcode memory blocks, current condition etc. To make sure all is connected and working as expected it is useful to bring them out and display - for example on 7seg LED displays most FPGA development boards contain.
This boils down to a MUX of required length, in1802 CPU design, 8 hex digits are "exported" out:
-- hex debug output
with hexSel select
    hexOut <=     ui_nextinstr(3 downto 0) when "000",
            ui_nextinstr(7 downto 4) when "001",
            ui_address(3 downto 0)    when "010",
            ui_address(7 downto 4) when "011",
            reg_n    when "100",
            reg_i    when "101",
            reg_ef when "110",
            nEF4 & nEF3 & nEF2 & nEF1 when "111";
The MUX is hooked up to additional "port" on the CPU entity (hexOut below), and simply driven by LED display clock (hexSel below), and the 4-bit nibble is decoded using standard hex-to-7seg lookup to display:
instruction register : current uPC : next uPC address : other (EF flags on pins and captured)
entity CDP180X is
Port ( CLOCK : in STD_LOGIC;
nWAIT : in STD_LOGIC;
nCLEAR : in STD_LOGIC;
Q : out STD_LOGIC;
SC : out STD_LOGIC_VECTOR (1 downto 0);
nMRD : out STD_LOGIC;
DBUS : inout STD_LOGIC_VECTOR (7 downto 0);
nME : in STD_LOGIC;
N : out STD_LOGIC_VECTOR (2 downto 0);
nEF4 : in STD_LOGIC;
nEF3 : in STD_LOGIC;
nEF2 : in STD_LOGIC;
nEF1 : in STD_LOGIC;
MA : out STD_LOGIC_VECTOR (7 downto 0);
TPB : buffer STD_LOGIC;
TPA : buffer STD_LOGIC;
nMWR : out STD_LOGIC;
nINTERRUPT : in STD_LOGIC;
nDMAOUT : in STD_LOGIC;
nDMAIN : in STD_LOGIC;
nXTAL : out STD_LOGIC;
-- not part of real device, used to turn on 1805 mode
mode_1805: in STD_LOGIC;
-- not part of real device, used for debugging
A : out STD_LOGIC_VECTOR (15 downto 0);
hexSel : in STD_LOGIC_VECTOR (2 downto 0);
hexOut : out STD_LOGIC_VECTOR (3 downto 0);
traceEnabled: in STD_LOGIC;
traceOut : out STD_LOGIC_VECTOR (7 downto 0);
traceReady : in STD_LOGIC);
end CDP180X;
(3) CIRCUIT STATE
While the microcode guts are the same, the actual circuit/CPU/controller itself can be vastly different, and this exactly where microcoding shines as easy way to customize what wants to be seen. Classic example of this would to trace the state of most important internal registers during program execution:
6502: A, X, Y, S, PSB, PC, IR
8080: AF, BC, DE, HL, SP, PC, IR
9900: PC, WP, ST, IR
1802: D, B, FL, XP, IN, R0, R1, R2, RX, RP, RN
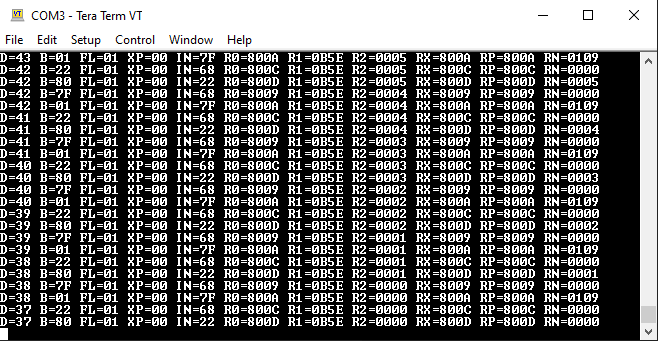
As can be seen above, after the instruction register (IN) is loaded with the new instruction, and before it is executed, a microcode routine is run to dump out all relevant internal state:
//    Read memory into instruction register
//    ---------------------------------------------------------------------------
fetch:        fetch_memread, sel_reg = p, reg_in <= alu_y, y_bus, reg_inc;

//    Given that instruction register is loaded late, execute 1 more cycle before forking. It is useful to load B <= M(X)
// ----------------------------------------------------------------------------
load_b:        exec_memread, sel_reg = x, reg_b <= alu_y, y_bus,
        if traceEnabled then traceState else fork;
traceState condition is true if a "pin" is raised in the debug port, and in that case instead of "forking" to execute the instruction, the routine to dump internal state will be entered.
Note that trace characters can come in two flavors:
- ASCII code given by program (such as "D=" or CR/LF at the end of line)
- 0-F ASCII code, but coming from the actual state of the register.
Let's see how both are coded:
//    Output internal state in following format:
//    D=?? B=?? FL=?? XP=?? IN=?? R0=???? R1=???? R2=???? RX=???? RP=???? RN=????<cr><lf>
//    trace mux selection is:
//    0XXXXXXX ... 7 bit ASCII character in XXXXXXX
//    1XXXRRR0 ... internal register, low nibble
//    1XXXRRR1 ... internal register, high nibble
//    -----------------------------------------------------------------------------
traceState:    trace 'D';
        trace '=';
        trace 0b1000_0111;
        trace 0b1000_0110;
        trace ' ';
Characters "D" and "=" will have bit 7 = '0' so they will go directly through output MUX, but if bit 7 = '1' then then MUX will select an output of another MUX (yes, 99% of everything is a MUX) that will pick up the higher or lower nibble of the flags register (there is no such thing in 1802, but it is useful to clump together DF and IE flags into a virtual flags register for display purposes):
-- tracer
-- tracer works by sending ascii characters to TTY type output device, such as simple text display or serial
-- there is a protocol both need to follow:
-- 1. CPU outputs 0 to tracer port, DEVICE detects 0, does not nothing but asserts traceReady = 1
-- 2. CPU outputs ascii to tracer port, DEVICE detects != 0, starts displaying the char, traceReady = 0 indicating busy
-- 3. CPU waits until traceReady = 1
-- 4. goto step 1

with cpu_seq_else(3 downto 0) select
    hexTrace <= reg_t(3 downto 0)    when "0000",
            reg_t(7 downto 4)     when "0001",
            "000" & reg_df     when "0010",
            "000" & reg_mie     when "0011",    -- TODO: add other interrupt enable flags here
            reg_b(3 downto 0)    when "0100",
            reg_b(7 downto 4)     when "0101",
            reg_d(3 downto 0)    when "0110",
            reg_d(7 downto 4)     when "0111",
            reg_n        when "1000",
            reg_i        when "1001",
            reg_lo(3 downto 0)    when "1010",
            reg_lo(7 downto 4)     when "1011",
            reg_hi(3 downto 0)    when "1100",
            reg_hi(7 downto 4)     when "1101",
            reg_p        when "1110",
            reg_x        when "1111";
Now the only remaining mystery is what does "trace <value>" do? This is not a special microinstruction, essentially it is a redefined "load and jump" microinstruction:
trace: .alias reg_trace <= ss_disable_char, if true then traceChar else;
Note that there is nothing after "else" - that is where MCC will insert the ASCII code or MUX selector parameter. Because each of these is an unconditional "call" into routine that pushes out the trace character, the "else" part is unused and can be repurposed to hold either the ASCII code of trace character, or the MUX selector.
Finally, the output routine has to synchronize with VGA tracer or UART tracers, both of which can be much slower than the CPU. This is done by waiting on their "ready" signal:
traceChar:  if traceReady then next else repeat;        // wait until tracer indicates processed character
        reg_trace <= ss_disable_zero, return;        // sending NULL to tracer readies it for next character
reg_trace is output register holding the ASCII character to present to external circuits (VGA or TTY, but could easily be a memory writer too). In addition to 8 bit for character, it has the 9th bit to indicate if single stepping is enabled. This is convenient as it is annoying to single step through the tracer routine, usually developer is only interested in stepping through the code implementing the circuit:
traceOut <= reg_trace(7 downto 0); -- reg_trace(8) can be used internally to enable/disable single stepping
-- update TRACER register
update_tracer: process(UCLK, cpu_reg_trace, cpu_seq_else)
begin
    if (rising_edge(UCLK)) then
        case cpu_reg_trace is
            when reg_trace_ss_enable_zero =>    -- enable single stepping, no char to trace
                reg_trace <= "100000000";
            when reg_trace_ss_disable_zero =>    -- disable single stepping, no char to trace
                reg_trace <= "000000000";
            when reg_trace_ss_disable_char =>    -- disable single stepping, ascii char to trace
                if (cpu_seq_else(7) = '0') then
                    reg_trace <= '0' & cpu_seq_else;    -- ascii char is in the microcode
                else
                    reg_trace <= '0' & hex2char(to_integer(unsigned(hexTrace)));
                end if;
            when others =>
                null;
        end case;
    end if;
end process;
Note that with some additional formatting, and simple external code or tools, the output can be captured in CSV (Excel) or any other data format for easy off-line analysis later, or comparison with well-known data set.
(4) BREAKPOINTS
Given that the circuit functionality is described by running code, it is easy to see that code can have breakpoints which can help immensely with debugging and troubleshooting. This a huge advantage over FSMs where such technique is not readily available.
Breakpoints can come in two different forms:
- Triggered internally - this can be any condition set up in the design (for example A != valid BCD and arithmetic mode is BCD), or when reaching an unexpected or given uPC address ("stray code execution"), etc. At that point tracing or single stepping can be "tripped", and CPU can go into "debug mode"
- Triggered externally - some external condition triggers the single step, or tracing circuit, allowing execution to proceed in "debug mode"
Here is the illustration of the "external" breakpoint. To debug extended "1805/6" instructions, the tracer is triggered, and then when return to monitor is detected, then stop tracing. This way, the execution of "DADI" instruction (add immediate BCD mode") is tested (73 + 27 = 100 in BCD!!)
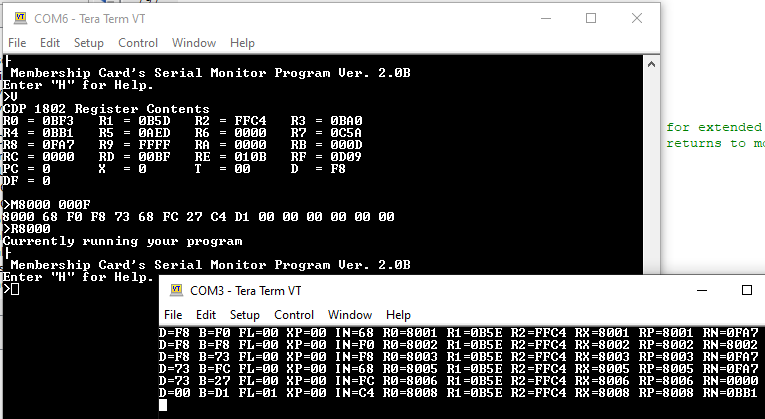
The circuit for this watches for:
- if tracer is turned off, fetching of 0x68 "extended" op-code (Z80 fans: think 0xCB, 0xCD, 0xED, 0xFD codes), and if in 1805 mode, turns it on
- if tracer is turned on, watches for "SEP R1" instruction (0xD1 opcode) which returns to monitor to turn it off
fetch <= not (nMRD or SC(1) or SC(0));
fetch_extended  <= fetch when (D = X"68") else '0';    -- escape for extended instructions in 1805 mode
fetch_sep_r1    <= fetch when (D = X"D1") else '0';    -- SEP R1 returns to monitor

set_traceExtended: process(TPB, D, nMWR, SC)
begin
	if (reset = '1') then
		traceExtended <= '0';
	else
		if (falling_edge(TPB)) then
			if (traceExtended = '0') then
				traceExtended <= sw_1805mode and fetch_extended;
			else
				traceExtended <= not (fetch_sep_r1);
			end if;
		end if;
	end if;
end process;
Discussions
Become a Hackaday.io Member
Create an account to leave a comment. Already have an account? Log In.