I've been wanting to quantify the "feel" of a switch for a while now. The best way I have been able to come up with it to measure the force vs. deflection curve. In this update, I'll present the data for several different switches.
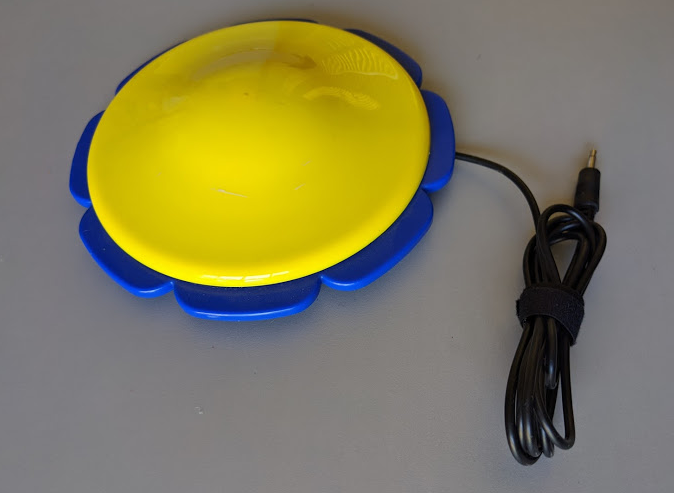
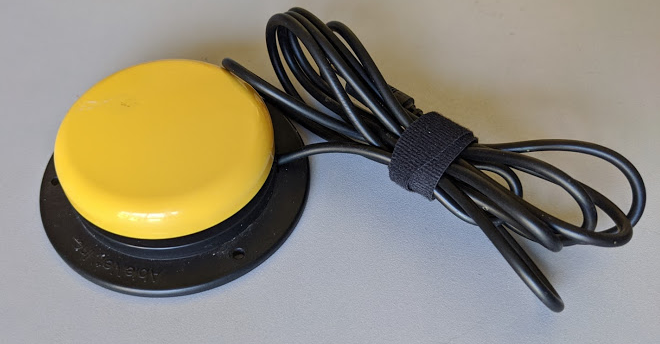
The first switch tested is this Scallop Switch. It's a large switch sold by the nonprofit American Printing House for the Blind. It's a very functional switch at a price point that's unmatched. (They also have a great wobble switch that I also highly recommend.)
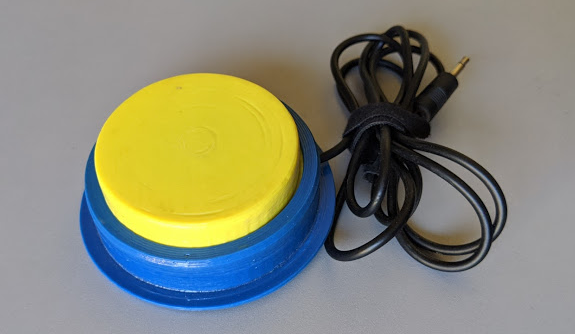
Next up is the Specs Switch. This is a popular small switch. It has a short throw and is manufactured by Ablenet.
We also have the Jelly Bean switch, also by Ablenet. This is a very widely used, popular switch. It's a great medium size and can be used in a lot of different situations.
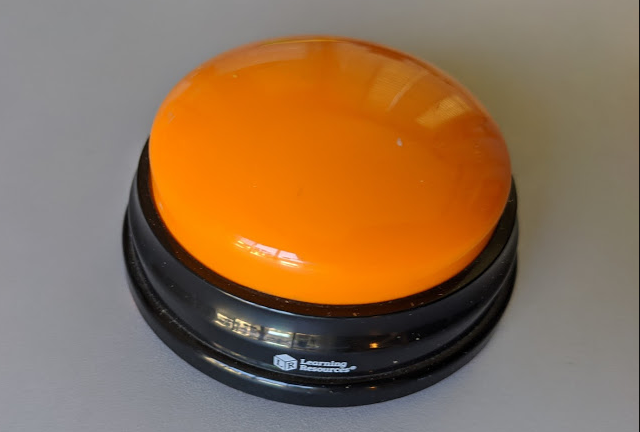
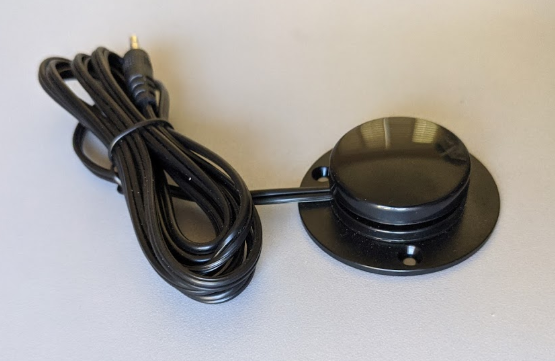
This next switch is not an adaptive switch at all, but rather it's a switch that makes one of various noises when hit. They're sold in a pack of 4 for about $15. I included it here because I see a lot of people converting this into an adaptive switch (you can find a bunch on Etsy, for example).
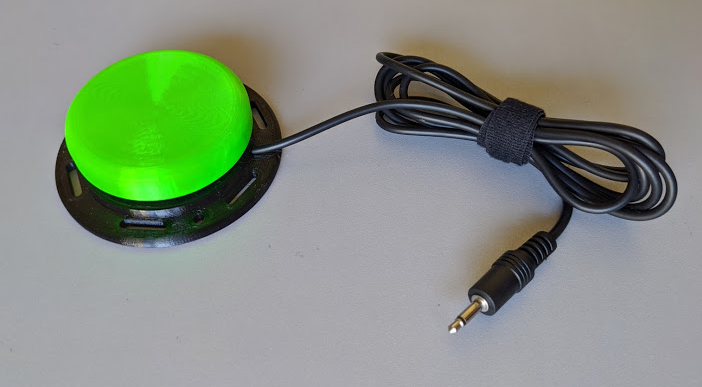
And lastly, we have our new homemade switch. To make it, all you need is a reasonable 3D printer and some very basic soldering skills.
Let's take a look at the test rig. Most of these switches activate over a pretty short throw. In order to get a good idea of what the force vs. displacement graph looks like for each of them, we'll need to measure the force at sub-millimeter increments. Fortunately, 3D printers are great such precise movements.
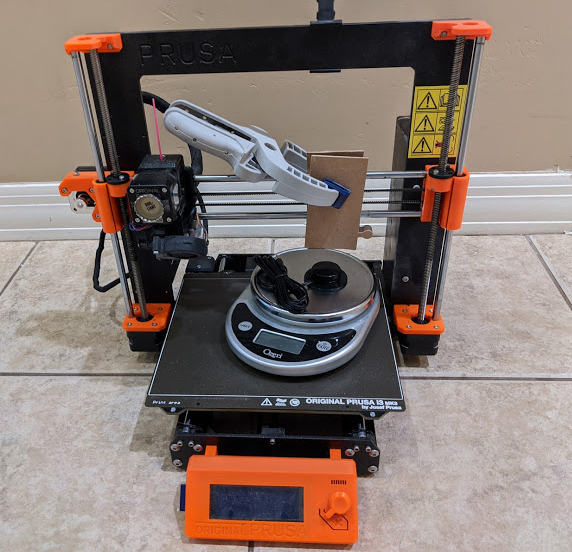
I attached a short extension below the X axis that would depress the switch as the Z axis is lowered. To avoid slipping, the block of wood that pushes on the switch is directly beneath the lower X axis rod. (My first iteration lacked this piece, and I found that the clamp was not strong enough to keep the two other boards from shifting.) I hooked this rig up to Cura in able to move in increments of 0.1mm.
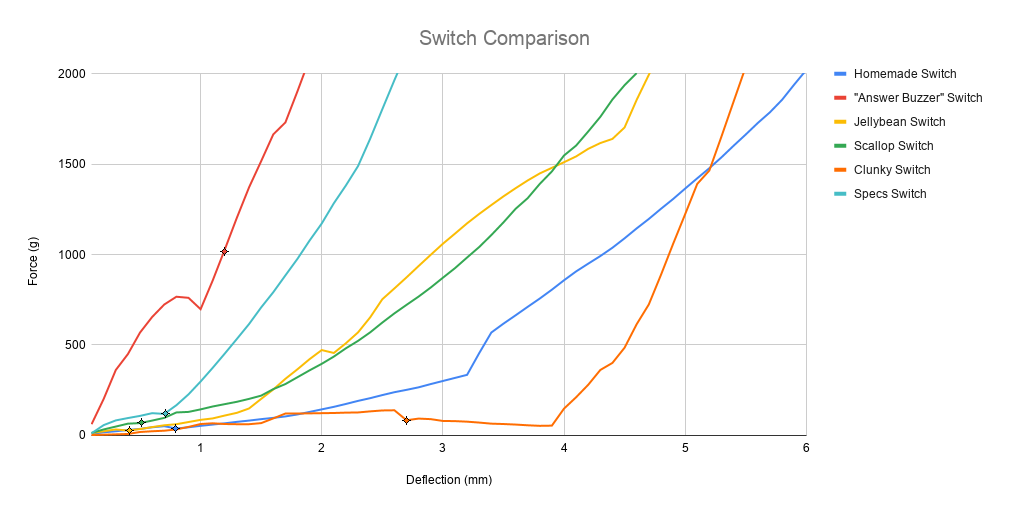
And now the results. I've posted the same graph with both a linear and a log scale-- I think both are
valuable to understand what's going on with these switches. I've also marked each line with a point that indicates when the switch was actually triggered.
Linear:
Logarithmic:
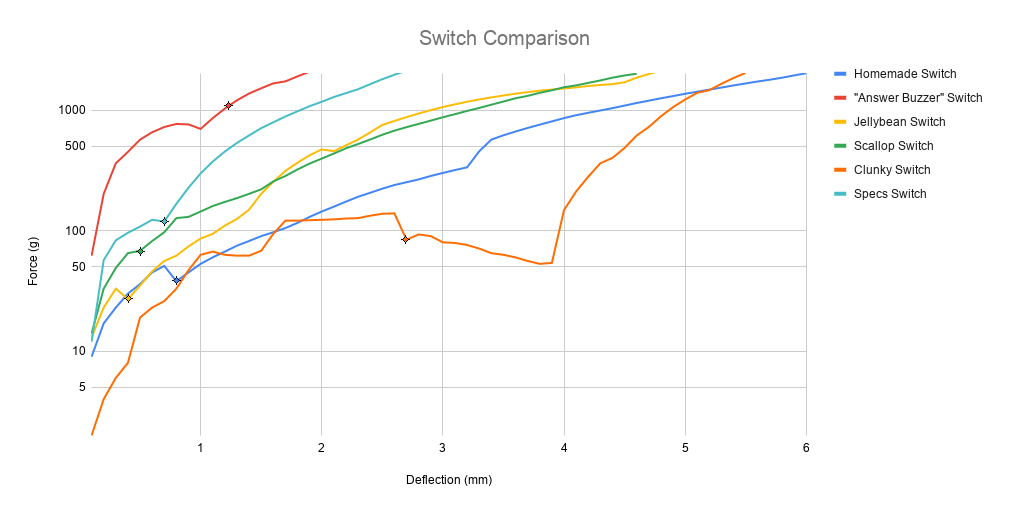
The force required to activate each switch is a hugely important factor in the use of these switches. From this, it's easy to see that the "Answer Buzzer" switch requires significantly more force to activate than any other switch. Keeping in mind that the switch is supposed to make it easier to interact with things, I find that such a large force makes it a pretty poor option for adapting for most users.
My favorite line to see here is for the Clunky Switch. Wow! It's all over the board, and not a smooth curve at all. The negative slope from 2.5mm to 4mm was particularly interesting. Even though the force to activate this switch is much lower, it's really not a good option.
Of the remaining switches, it's worth noting that the force curve is in general very smooth. The shallower the slope, the "softer" and more cushion the switch seems to provide. I think this part of the curve after the switch has activated really plays a large role in the overall feel of the switch. And matching the graph, of these 4 remaining switches, I'd definitely subjectively call the Specs switch the "hardest" and the Homemade switch the "softest."
 Mike Turvey
Discussions
Become a Hackaday.io Member
Create an account to leave a comment. Already have an account? Log In.