 Tom Hartley
We were brainstorming labelling solutions last week and there comes a point in every process where you realise you just can't fit all the required information into your head. So, when you have 13 different solutions to evaluate across 11 different criteria, how do you do it?
We chose to turn to the venerable Excel (well, Google Sheets). We set up a sheet such that each criteria was along the top, and each potential labelling solution was along the left hand side. In this way, each box could be filled with a rating (1 = 'bad', 5='good'), corresponding to how well that solution covered that particular issue. Here's a screenshot:
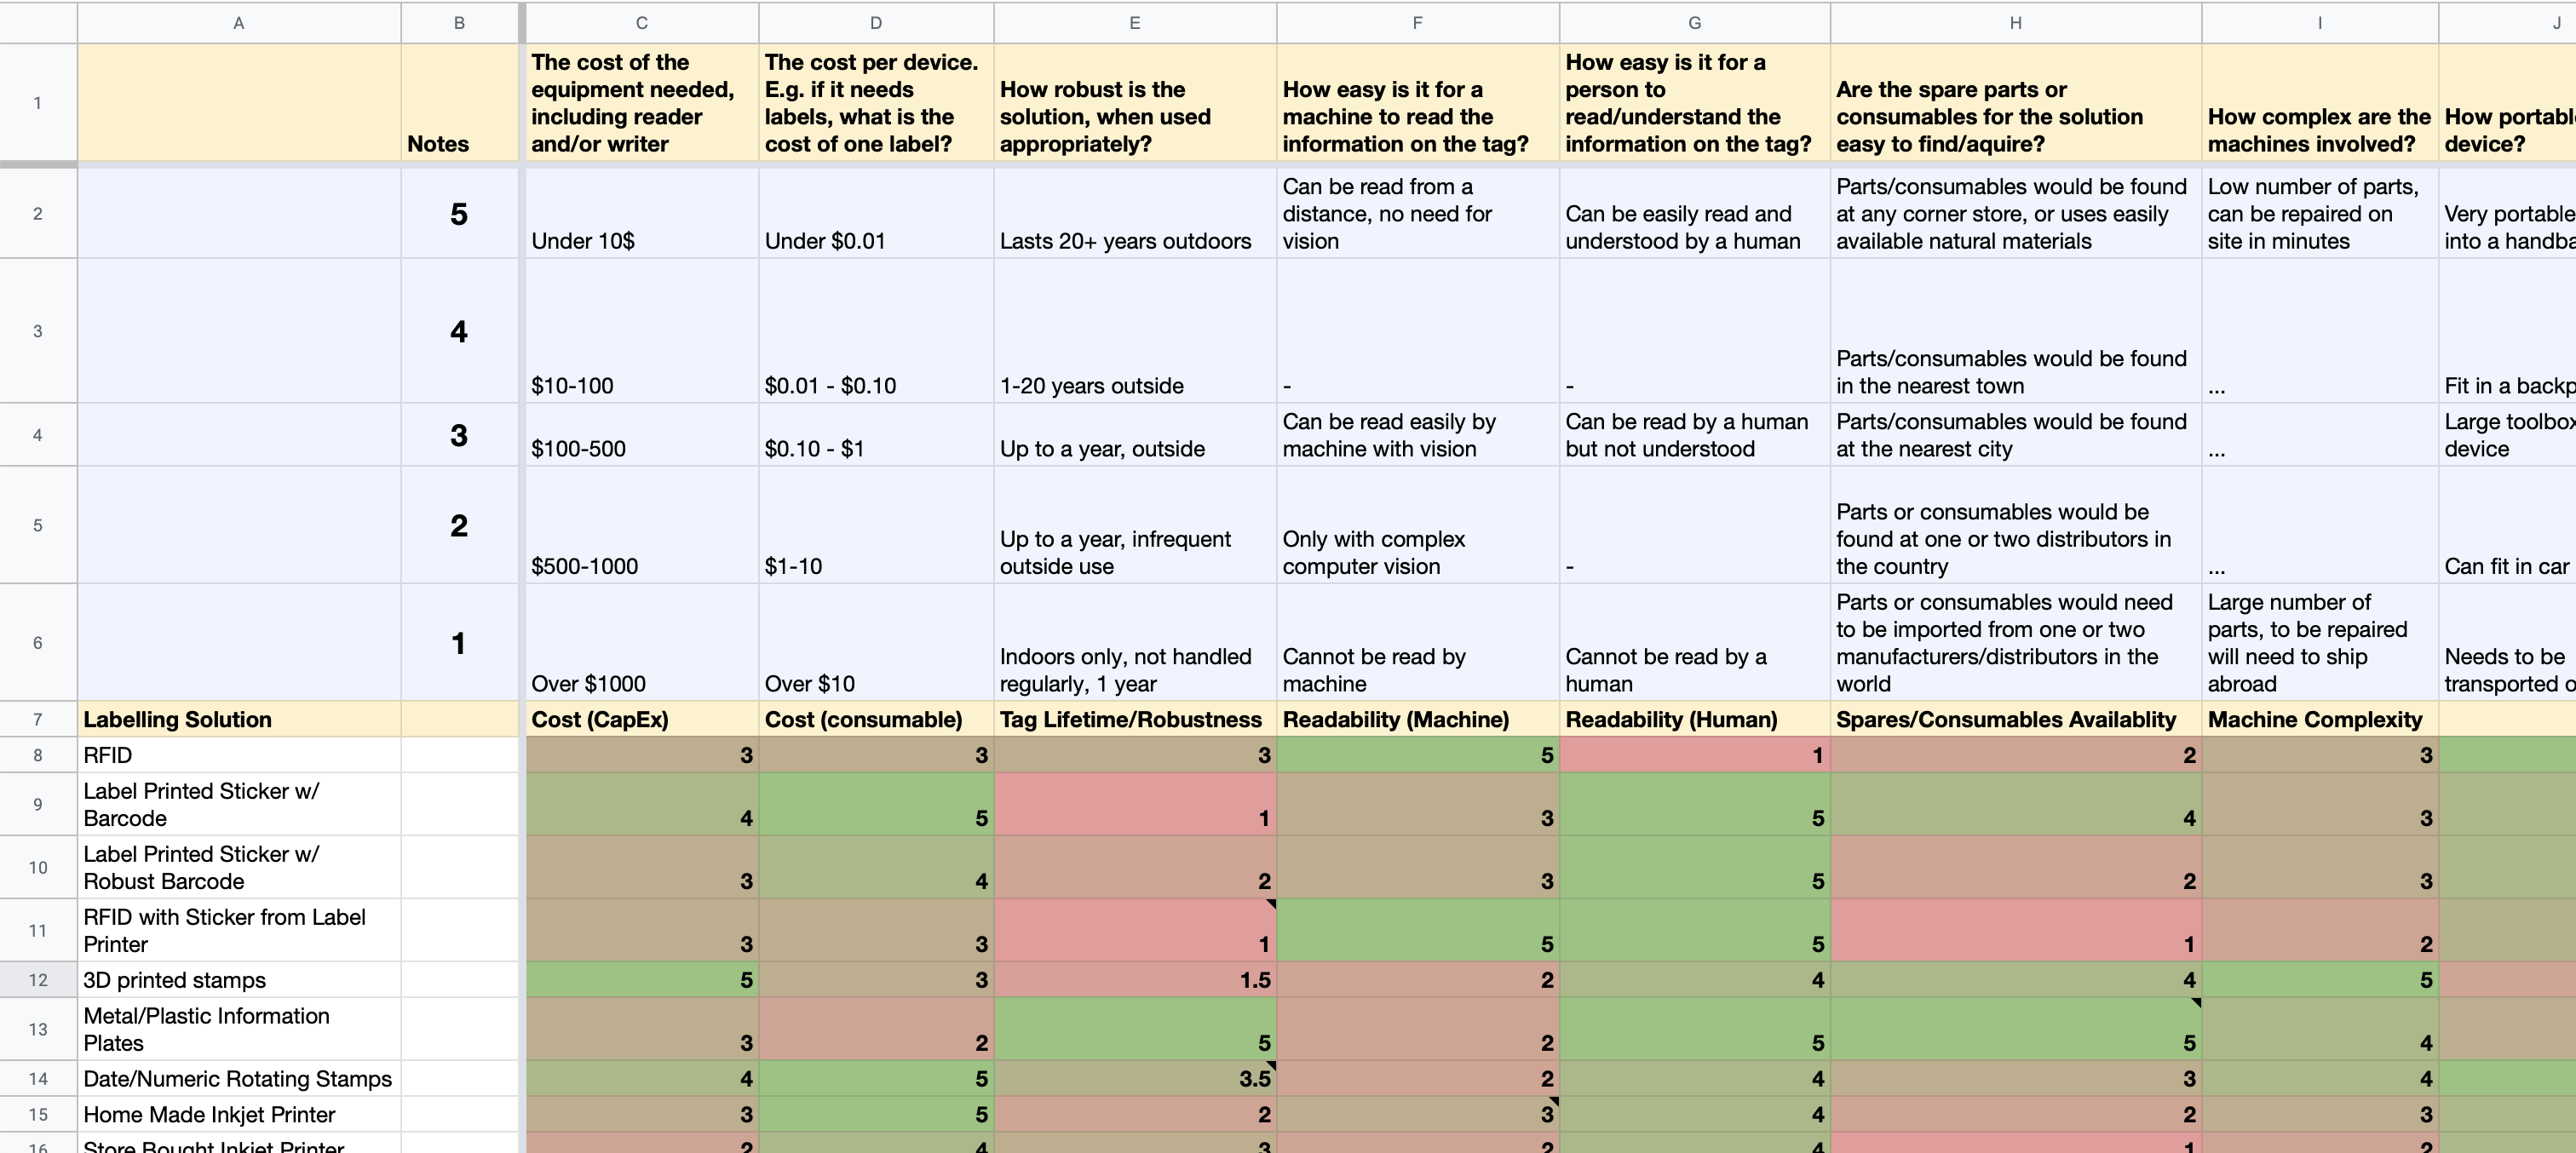
Along the top, we have guidelines for each parameter showing what makes a 1 or a 5 - for example, if the capital expenditure (fixed costs) for a solution are under $10 - amazing! That gets a 5/5. If they're over $1000? Less great, let's give that a 1/5. This goes on for each rating.
We put in some conditional formatting to give us an at-a-glance view of where issues lie, and we've summed up the totals on the right hand side.
Despite the percentage score on the right, this tool is way more than just a number-counting exercise. Its real value lay in forcing us to think about every single criteria for every single solution, rather than just jumping to conclusions or skipping over options. It also forced us to take even the simplest of options seriously, like just writing on the product with a sharpie. If we're going to propose something complex, we need to be sure that it actually makes more sense than the simple solution!
Here's a link to the spreadsheet - go and check it out and let us know what we're missing in the comments down below!
Discussions
Become a Hackaday.io Member
Create an account to leave a comment. Already have an account? Log In.