 zpekic
Tooling is one of the most important things in software engineering. Better tooling means better quality and productivity, and often security, documentation, list goes on.
The description below applies to this project but also other similar ones.
Build time
Two main tools are used:
- Microcode compiler. This is 2-pass command-line compiler I wrote in C# for all my micro-coded CPUs and controllers. For this project it was modified to:
- support alternative mnemonics (delimited by "bar" | )
- better #include processing (dynamic .org statements)
- various minor fixes
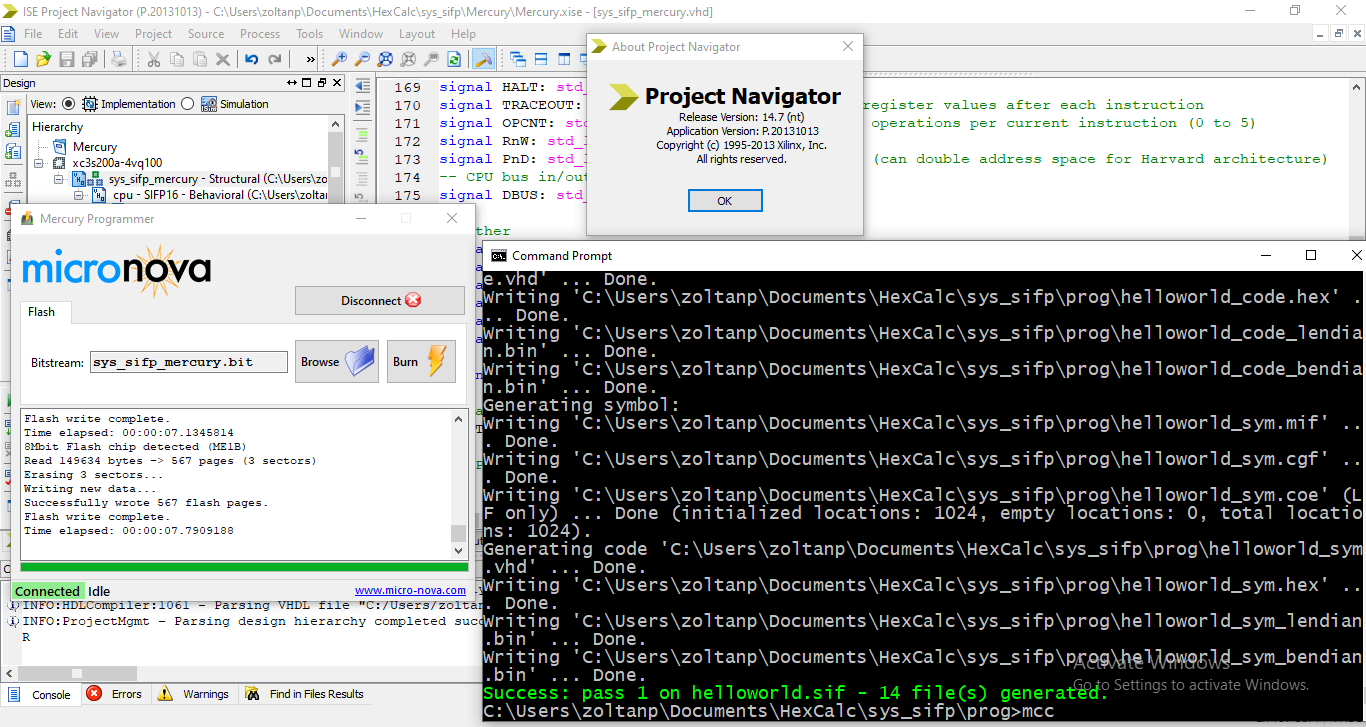
- Ancient Xilinx (now AMD) ISE 14.7 - obsolete, but still free and still works, sufficiently well for FPGA boards I mostly use.
Microcode compiler consumes .mcc or .sif text source files and can generate various output formats, for example Intel .hex or .vhd. Either of these can be used to prime the "ROM" memory of the system.
ISE14.7 - in addition to project files, also includes either .vhd produced by mcc or during build time loads the .hex file using a helper function.
The output is a .bin file which gets downloaded to the target device (FPGA board) using a utility tool.
Run time
Currently, system build around SIFC processor implements:
- VGA (32*64 character only) as primary output device
- UART (bi-directional, connected to USB2UART device appears as COM: port) as "console" device (text-only input and output)
- UART (one-directional, connected to USB2UART device appears as another COM: port) trace output device
There are two devices inside the target system that help with debugging:
- CPU which can be in trace mode (outputs register values) or non-trace. In addition it can be run with frequency 0 (single - step) to 25MHz
- Debugtracer which can intercept any bus cycle and "freeze" the CPU until that bus cycle data is output on the serial COM port (#3 above)
| debugtracer mods \ CPU mode | TRACEON | TRACEOFF |
| Enabled | Allows tracing all bus cycles (except INTA) | Allows tracing instruction fetch and memory read/write only |
| Disabled | Slow system speed (8 clock cycles per instruction) | Full system speed (2 clock cycles per instruction) |
On the host PC, COM port #2 must be connected to some terminal emulator type of application to allow command interaction with the system.
However, for COM port #3, there are 3 options:
- do not connect (ignore trace output even if present)
- connect to terminal emulator app (and observe raw trace output)
- start tracer system tool (command line, written in C#) - it will take over the COM port and use trace output it intercepts to look up and highlight symbolic code, update memory map etc. Tracing can be stopped / restarted by "space" key on host which flips RTS pin on COM: ports which is picked up by the tracer. Symbolic breakpoints could be implemented using this capability in the future.


Discussions
Become a Hackaday.io Member
Create an account to leave a comment. Already have an account? Log In.