Jon
Jon-
Color Temperature Sensor Position Improvement
10/22/2020 at 04:38 • 0 commentsIn the prior setup all three light sensors were kept on a makeshift shelf in direct view of the target lamps. This was done to address features of the ambient lighting sensor, where having a fixed distance from the source could allow for precise light output calculations, and the well-documented spectroscopy sensor, which had a limited field of view.
However, moving around the sensors while performing some additional testing recently provided a significant improvement in the ability of the RGB sensor to provide lighting color temperature numbers which correlate very strongly to manufacturer rated values. Without any additional calibration or adjustment to the color temperature calculation formula, positioning the RGB sensor out of direct line of sight with the lamps has produced color temperature numbers within 1% of manufacturer rated numbers - an order of magnitude improvement(!).
Lamp Labeled Color Temp (K) Direct Position
Calc. Color Temp (K)Indirect Position
Calc. Color Temp (K)Amber LED 2000K 1745K 2004K EcoSmart Soft White 2700K 2387K 2738K This was an interesting development and has been part of the learning process with the selected RGB sensor. Clearly being in direct line of sight of the lamps was impacting the readings. This actually recommends a design we'd considered but not implemented in our first prototype in which a white card is kept at a 45 degree angle to the sensor board to encourage the measurement of the color temperature of indirect room light.
Ultimately the model of RGB sensor we chose doesn't seem to have been as popular as other sensors in the community (such as the ISL29125 or TCS34725), nor is it as well documented by the manufacturer given that it was part of an intentionally limited-run product line (Sparkfun's SparkX experimental product line). We've had reasonably good results, but there's definitely been some trial and error along the way that could've been eliminated by simply selecting a more common option within the Arduino community (or at least one with a more substantial amount of manufacturer documentation).
We're still having some fun with this prototype so look forward to some more posts (midterm exams kept the team away for the last couple of weeks - but everyone survived and is looking forward to some additional refinements!).
-
Successful Color Temperature Control
10/05/2020 at 10:01 • 0 commentsOne of our key goals for success has been met: we were able to manipulate color temperature output while holding light output steady in a two channel configuration. What you're able to see below is the EcoSmart Soft White and EcoSmart Daylight smoothly stepping between 46 color temperature values without changing the light output level. Views were recorded both from external to the lamps as well as directly in front of them. When watching the lamps the changes in brightness of the individual lamps are subtle in part because the camera isn't having to adjust for overall changes in brightness.
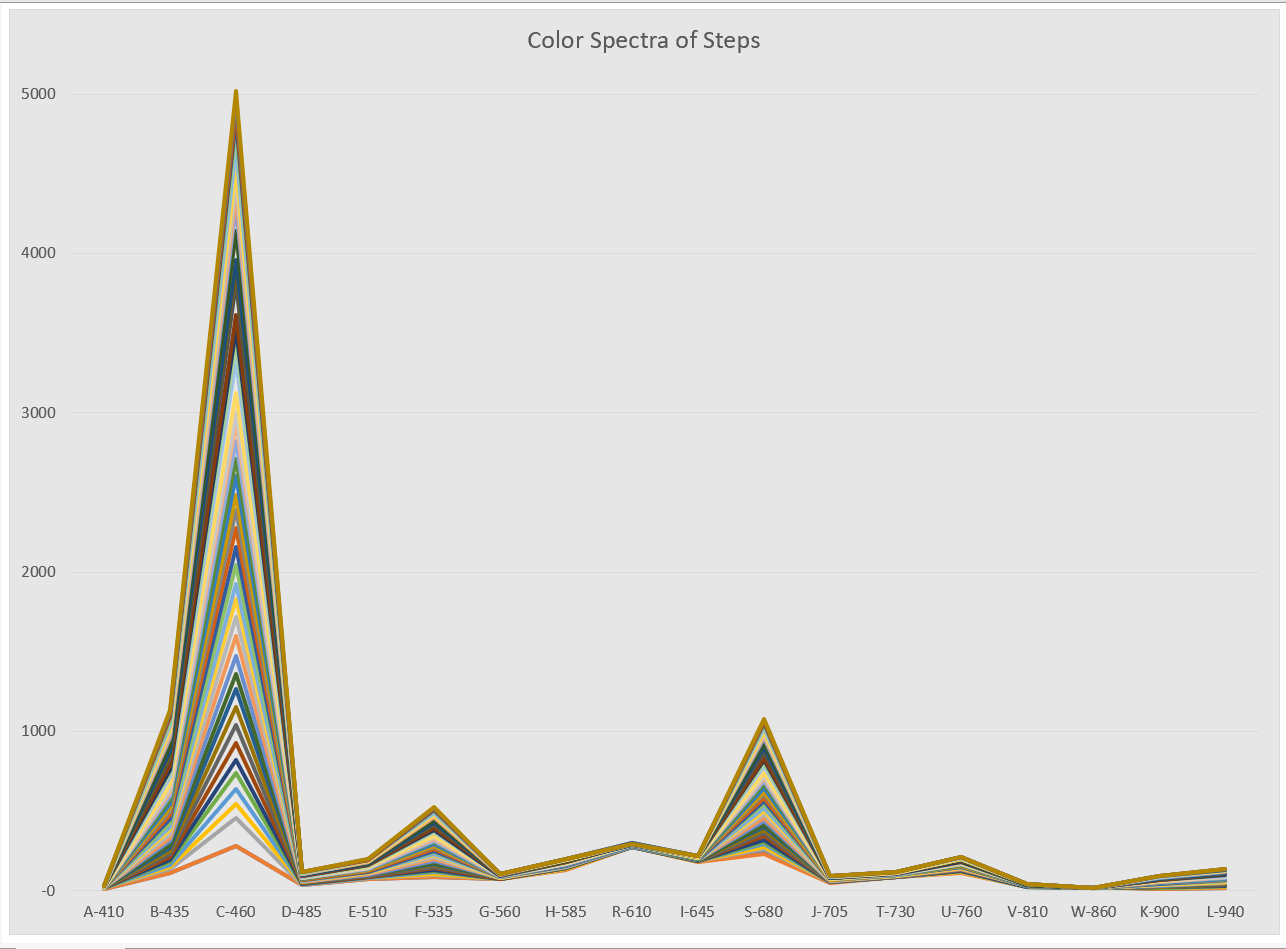
The view from outside where the door and colorful boxes can provide some reference as to the color temperature changes. The view from directly in front of the lamps where the changes in individual lamp brightness are visible, but overall output is stable. The changes being stepped through above represent steps of as little as 50K in a range from 2700K up to 5000K. The light output variation in each step was limited to no more than a 10 lumens in any given step, with even lower recorded values for most (in terms as recording the typical difference if any was no more than 1-2 lux at a measured distance of approximately 2 feet). The most obvious place to see the shift is actually using the spectrometer, which really highlighted what is happening as the output is kept fixed.
![]()
The graph charts the recorded color spectrum of the ambient light for each step of the controlled light output program. The labeled light wavelengths at the bottom represent blue on the left (410 nm) moving through green (535 nm) and red (680 nm) and beyond into the infrared. The warmest source setting, with light only coming from the EcoSmart 2700 K Soft White lamp, represents the bottom line. Each successive step significantly increases the contribution of the blue component of the spectrum which validates an increasingly cool spectrum. Also note how the spectrum is composed primarily of three primary peaks of blue, green, and red.
Although the lighting output is controlling only the power levels provided to each of the two LED lamps, their constant color temperature outputs and likely comparable phosphors and control electronics mean that this controller is effectively controlling each of the primary color channels with some granularity. The balance of color components would be slightly different for LED lamp manufacturer and color type selected, but should generally hold true (assuming it is color temperature stable across its power range) that manipulating power input acts almost as a proxy for controlling the individual color components of the light.
-
Who Still Has Incandescent Lamps? Lighting Nerds...
10/04/2020 at 22:20 • 0 commentsPart of the interest in this project revolved around building and testing tools we've always dreamt of having access to over a lifetime of obsessing over artificial lighting. Some of the fun we had involved color temperature measurements with sources outside of the commodity lamps selected for this prototype. This included, unbelievably enough, traditional filament incandescent lamps and halogen capsule lamps also rated for the same 800 lumens range as those selected for the prototype.
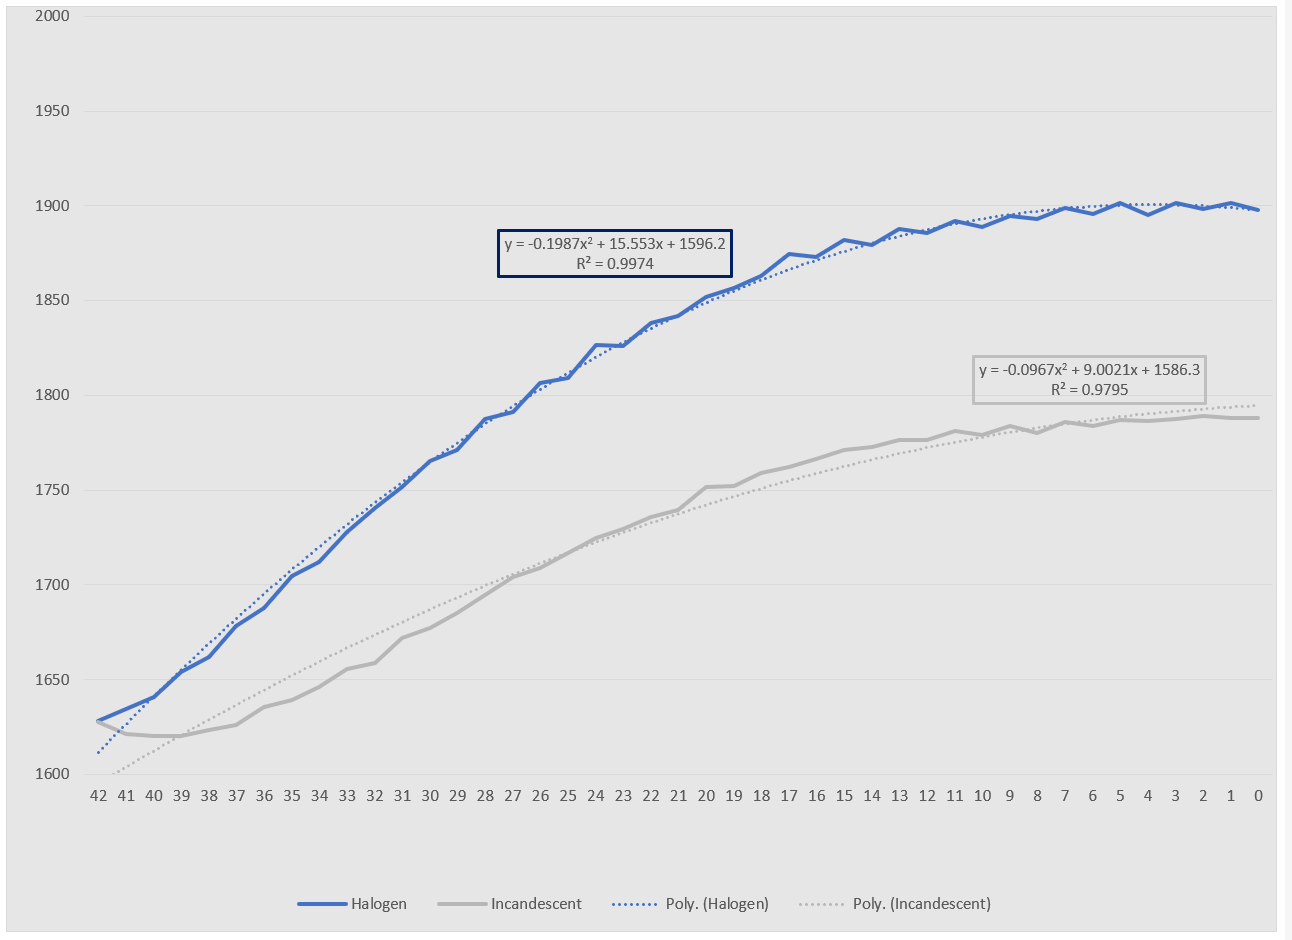
One feature which was immediately visible in the Color Temperature vs. Power testing was the natural tendency of incandescent lights to shift their color temperature as they are dimmed. I've zoomed into the range previously examined for our LED sources to highlight that range here for a standard 60 watt incandescent and 60-watt equivalent halogen (the latter being commonly available today as an energy-efficient incandescent replacement option).
![]()
Testing of color temperature readings relative to power levels for older filament incandescent and halogen capsule lamps. Note how unlike the LED lamps in the prior log, these lamps have a graph best expressed as a polynomial and represent shifts of approximately 10-20% in color temperature. This noteworthy distinction is significant in that it is a natural function of the method by which incandescent lamps operate, but not of the sources which have replaced them. This has led to manufacturers attempting to emulate this functionality on newer sources using various techniques... the availability of which convinced this team that the project we have proposed might even be possible!
One problem we noticed in calculating color temperature values for these lamps was that the resulting number seemed far too low relative to expected values. This problem may likely be a function of skipping the calibration step and is likely exacerbated by the differences in spectrum between the LED sources and the incandescent sources (see our earlier entries comparing the normalized spectra of incandescent and fluorescent sources as well as the spectrum of LED sources).
For anyone worried about our lighting bills, please rest assured that these lamps were returned back to their safe resting places in the "lamp and bulb curiosities" box and aren't being kept in regular service.
![]()
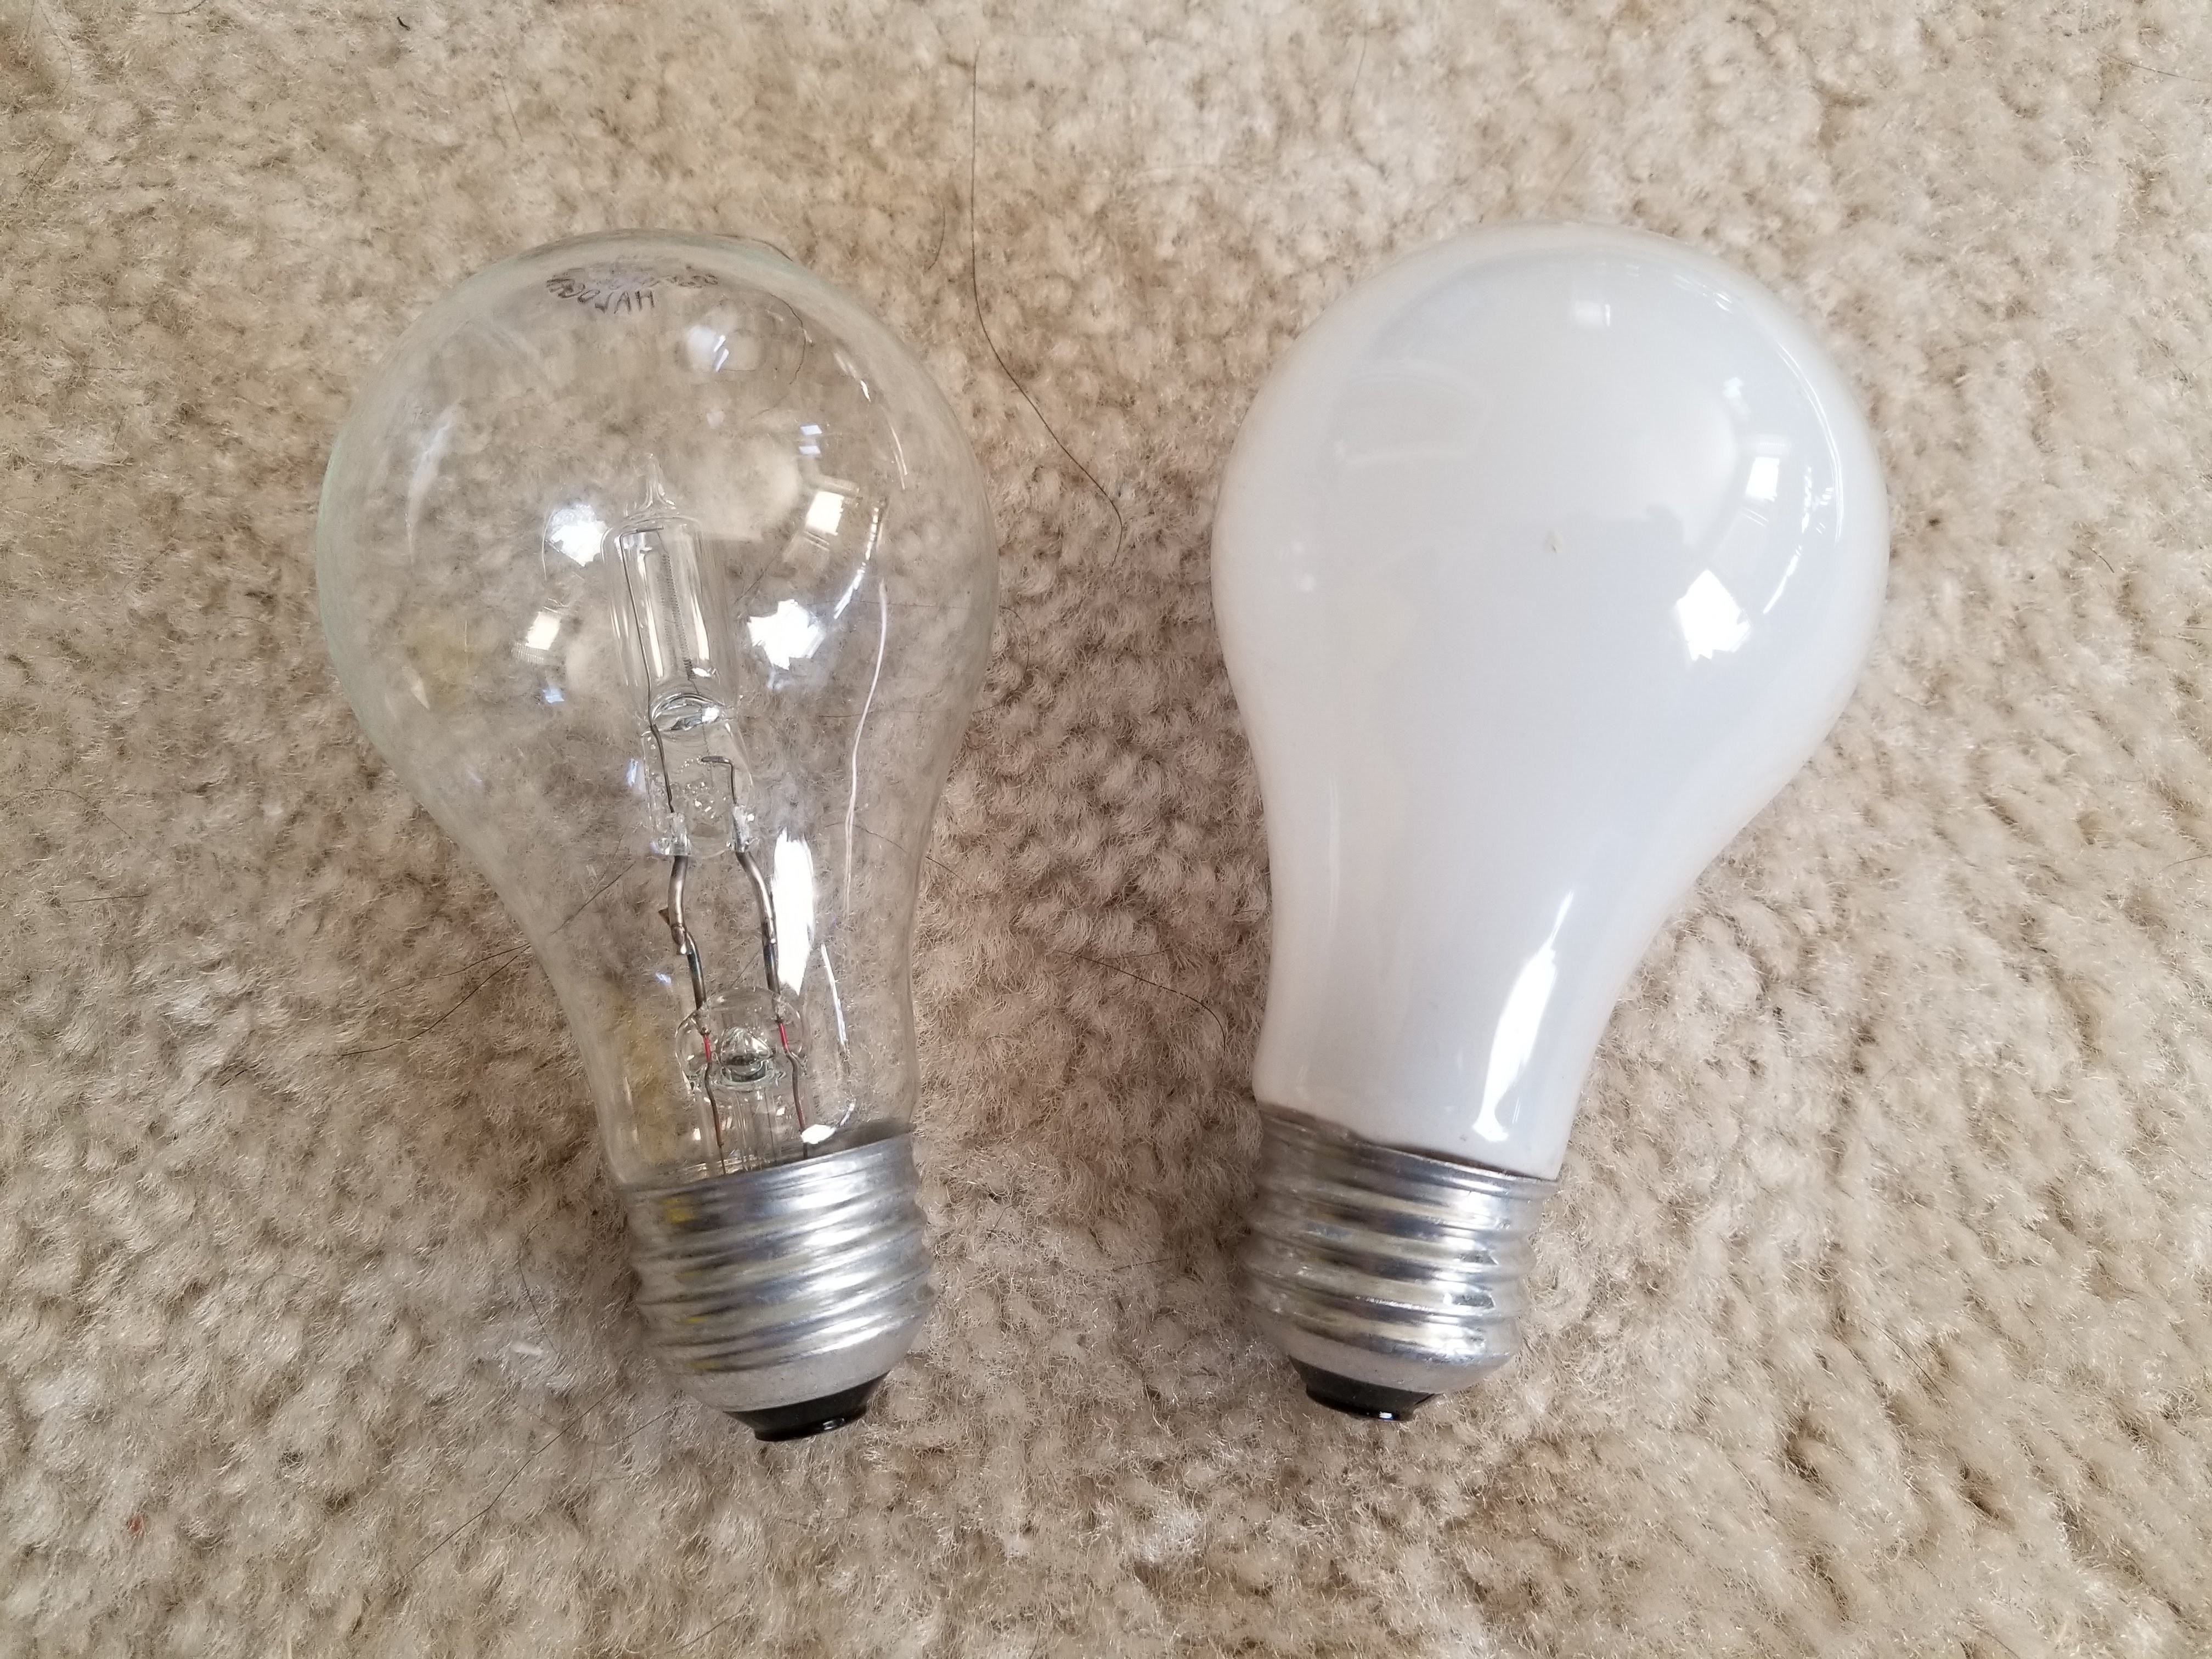
A newer capsule halogen lamp on the left and an old filament incandescent lamp on the right. To produce a comparable amount of light (800 lumens) the incandescent consumes 60 watts (and doesn't really output a full 800 lumens) while the halogen does so with just over 50 watts... while all the LED sources used in the prototype do so with under 9 watts(!) -
Color Temperature vs. Power
10/01/2020 at 14:19 • 1 commentThe previous log used the light sensor to measure light output levels relative to input power. This entry will review how the effective color temperature is calculated using the RGB sensor. This value was then measured over a range of power settings to determine not only the ability to easily record color temperature, but the fluctuation of color temperature relative to power input (spoiler alert: for most inexpensive dimmable LEDs color temperature typically does not!).
The color temperature readings were taken without prior calibration of the response of the associated sensor (BH1749NUC) using known inputs. However, even without that step the good news was that calculated color temperatures were generally in line, albeit around 10% lower, than the values claimed by the manufacturers. Though a calibration step may have likely improved the ability of the sensor to produce correlated color temperature values aligned with the manufacturer stated values, the fact that calculated values came close on the first try proved encouraging enough to continue on with the next steps.
The process for performing this calculation is to convert the RGB values to XYZ values (each part of a standardized color space) and from there the values can be mapped to a coordinate space for color temperature. A sample of different light sources in addition to the lamps planned for the prototype were used to provide multiple unique inputs to the color temperature calculation. The results at maximum power are tabulated below:
Lamp Labeled Color Temp (K) Calc. Color Temp (K) Amber LED 2000K 1745K EcoSmart Soft White 2700K 2387K EcoSmart Daylight 5000K 4742K GE Cool Daylight 6500K 6336K Without calibration the values calculated are already close to the rated/expected values. Note that there is often some natural variation between the rated manufacturer values and independently measured values given variances in the way color temperatures are measured. Some more detail in underlying differences will become apparent as we examine values recorded from the spectrometer. To be clear, calculating color temperature from RGB readings is an intentional simplification. However, using the values from the spectrometer would not necessarily be any more meaningful relative to manufacturer values without delving into the industry-specific measurement standards defined for this process. We'd certainly welcome any input from those who might have some familiarity with these specifications!
So having achieved relative success in approximating color temperature readings with the RGB sensor, we then proceeded to measure those values relative to power levels. And the good news is that for the selected, commodity dimmable LED lamps they proved fairly stable across a range of power levels. We did have some difficulty previously with lamps supporting differing minimum power levels, so we attempted to account for that here by starting with a higher minimum power level for the tested range to produce meaningful values. Note that this means the range covered below represents output levels starting around 2-7% of maximum for the range of lamps. Though wider ranges could be reported we'd have to customize the output for each of the lamps.
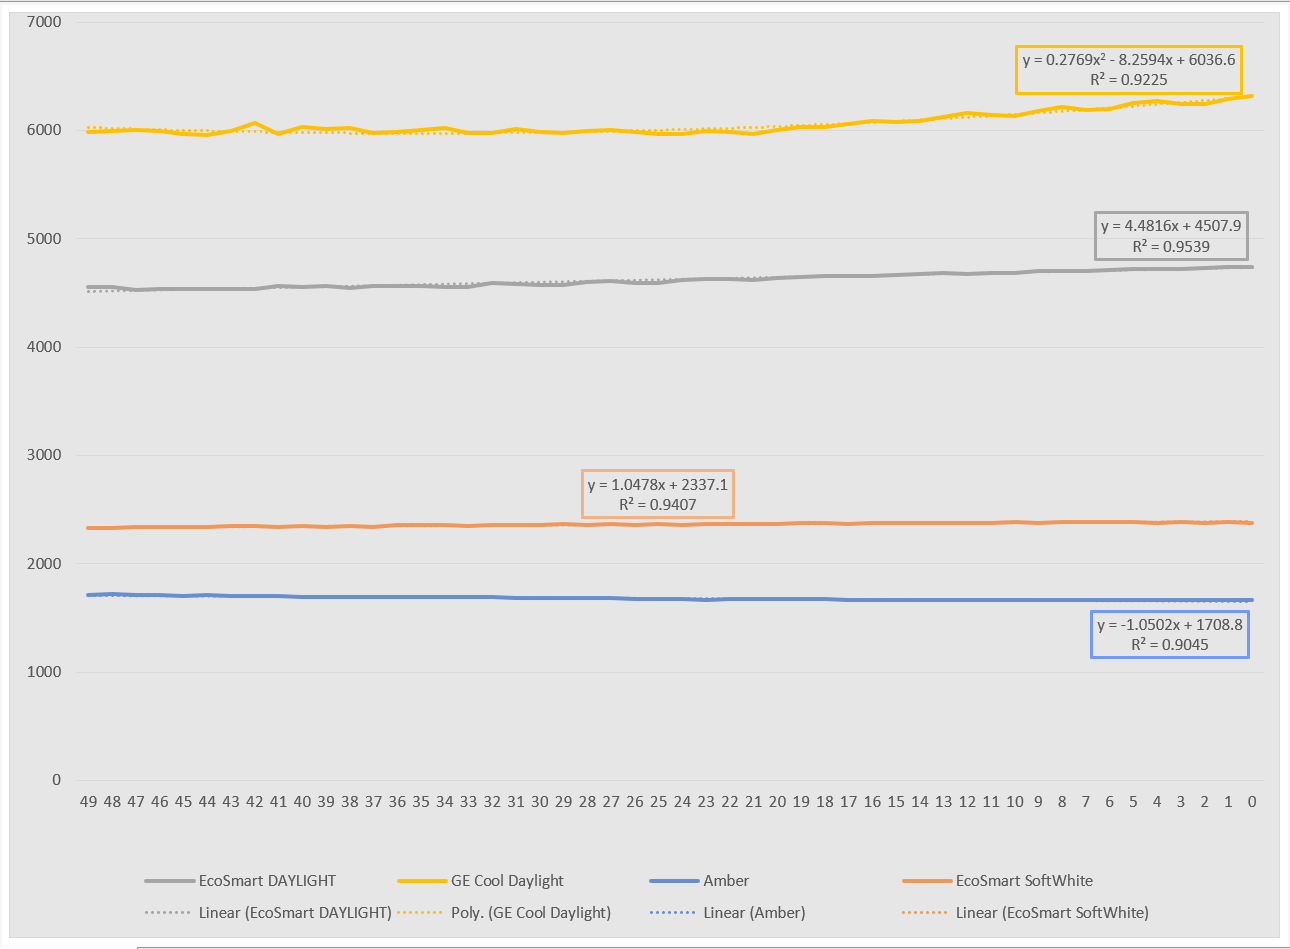
Note how for most of the examples a fairly flat, linear color temperature is recorded over the minimum (left) to maximum output (right) ranges. For the warmer range of lamps the increase in color temperature over the range of the lamp represents a shift of around 2% of the rated value. For the cooler lamps this increases to around 5%.
Overall this stability should make combining these sources at different power levels to achieve a customized final output color temperature relatively easy to predict. These findings appear to recommend the use of such simple, dimmable LED lamps over more internally complex sources with dim to warm features such as those mentioned in a prior post. This relative stability is significant when compared to more variable sources, a couple of which we'll cover in our next post!
![]()
Illustrated above are the calculated color temperature for a given power level as measured for each of the target lamps associated with the prototype. -
Lamp Output vs. Power
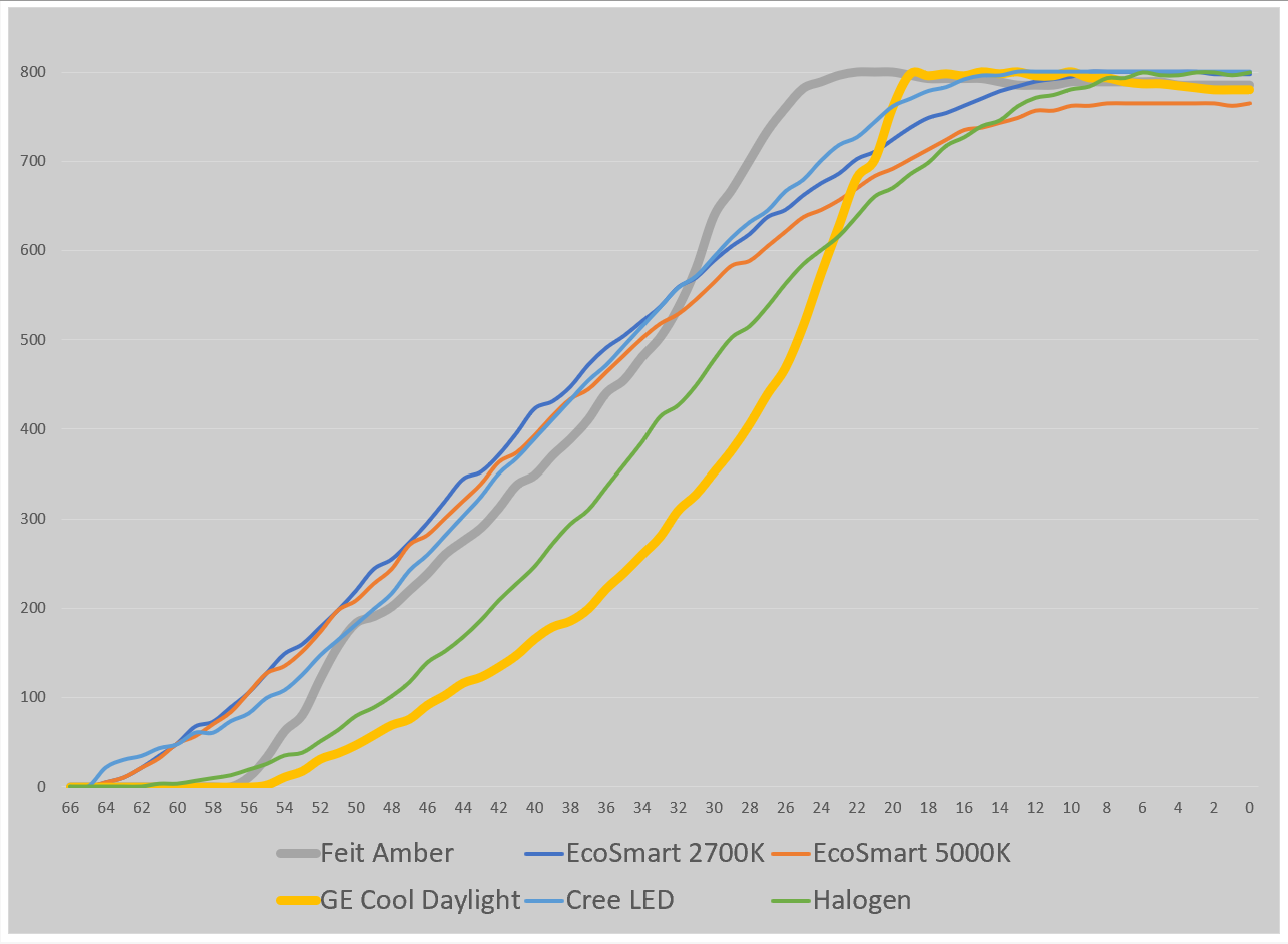
09/24/2020 at 08:15 • 0 commentsThe first results that were collected from the system were the normalized responses of the lamp light output relative to the power input. Rather than list the measured power level I've simply used the abstracted power levels used by the lighting controller board (a range from off at 66 to full on at 0). Although it was possible to calculate the measured lumens of each lamp once an exact distance between the lamp source and the sensor was measured, the method used to produce this graph involved using the rated lumens rating of the lamp as a reference relative to the readings measured by the ambient light sensor.
![]()
A graph of the output (lumens) of each lamp versus the power level setting in the lighting controller. Right away there are a couple of curves that stand out for cutting across the others: that of the GE Cool Daylight and the Feit Amber lamp. I've included a halogen incandescent and Cree Exceptional Light Quality LED lamp in this stage as controls to provide some reference lines for what are otherwise lamps selected as commodities and not because they are highly rated for their compatibility with dimmer circuits (as is the case with the Cree). Some manipulation of the data by changing the scale to logarithmic and reversing the order of the data amplifies what is happening.
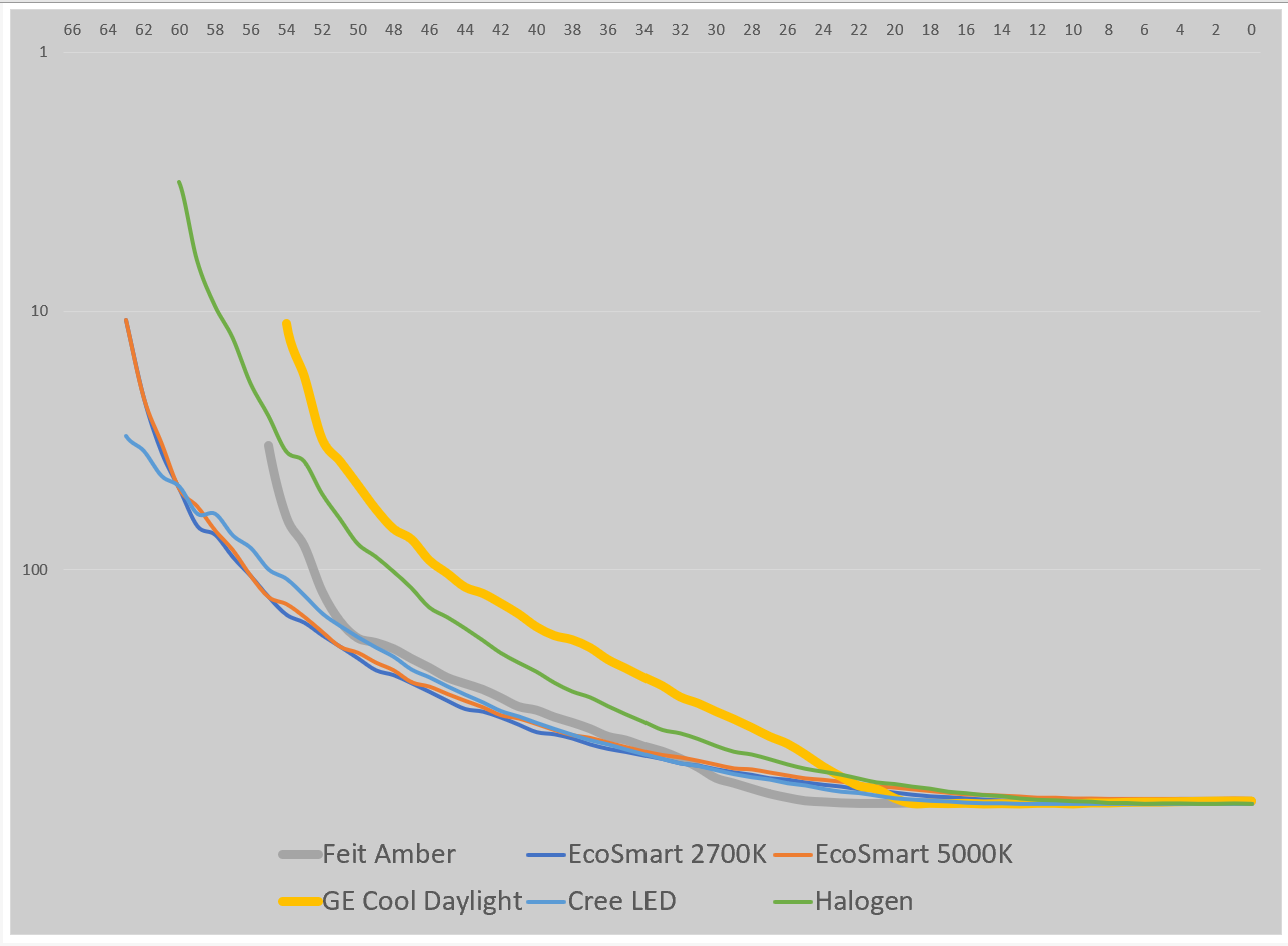
![]()
The same data with the vertical scale made logarithmic and both vertical and horizontal scales inverted. The halogen lamp reaches the highest point in this version of the graph, demonstrating that it has the widest range of lighting levels. However, this may not be entirely useful since there may be little to no value gained from being able to control light output at such low levels as single-digit lumens. In contrast, the Feit Amber has the lowest starting point on the graph indicating a short range from minimum to maximum brightness.
The Cree and EcoSmart lamps have the widest graphs demonstrating that they make maximum use of the power output range of the dimming circuit relative to their supported brightness ranges. The narrower graphs of the GE and Feit lamps suggests that they would provide less granular dimming control relative to the other lamps.
Of course, a big factor to consider here is the design of the dimming circuit. Though certainly worthy of a dedicated post, suffice it to say that the power control method used by this particular controller - known as leading edge dimming - is actually not of the type best suited to controlling LED lamps - that would be trailing edge dimming. As such, a circuit more optimized for controlling LED lamps might demonstrate wider control ranges for the Feit or GE lamps, and taller output light ranges for sources like the Cree.
Ultimately the EcoSmart lamps have to be congratulated for performing very comparably to the highly-rated Cree in this particular measure. The GE lamp performance is somewhat disappointing given the prominence of the GE lighting brand, whereas the limited range of the Feit Amber shouldn't be too surprising or discouraging for what is very much a specialty lamp likely not intended for general illumination.
As one of the target applications of this control system, we've already used this collected data to create what could be termed the ultimate dim to warm lighting range. Dim to warm LEDs like the Warm Glow series from Philips lower the output color temperature as the light is dimmed to simulate a similar result which occurs with incandescent lamp dimming. However, this color temperature shift is usually small, moving a 2700K lamp to 2200K when dimmed.
Using the dimming data above and the full spectrum of the lamps targeted for this prototype it was possible to create a scenario where the lamp output at full brightness possessed a cool 6500K temperature and, while dimmed, took the lighting color temperature down the very warm (and perceptibly red) 2000K temperature of the Feit Amber lamp before finally shutting off. This can be challenging to properly capture in video as it requires controlling for aperture and white balance, but the image below gives some insight into what is immediately possible with the controller circuitry at this early stage. More to come regarding color spectrum and color temperature measurements!
![]()
A dim to warm range from 6500K at maximum illumination - 800 lumens - down to 2000K at 200 lumens and below. Note the color shifting on the white door and colorful board game boxes (despite the camera attempting to accommodate the changing light levels and white balance). -
Fixture Design (or a Lack Thereof)
09/24/2020 at 06:10 • 0 commentsAs our testing progresses we've been exceptionally fortunate in our ability to get all of the components working and operational in a timely fashion. What may be missing for some, however, is a view of our solution which appears like anything that would be labeled a light fixture rather than science fair. This entry will review the original design concept, current prototype, and discuss the possible applications and options we have considered to date.
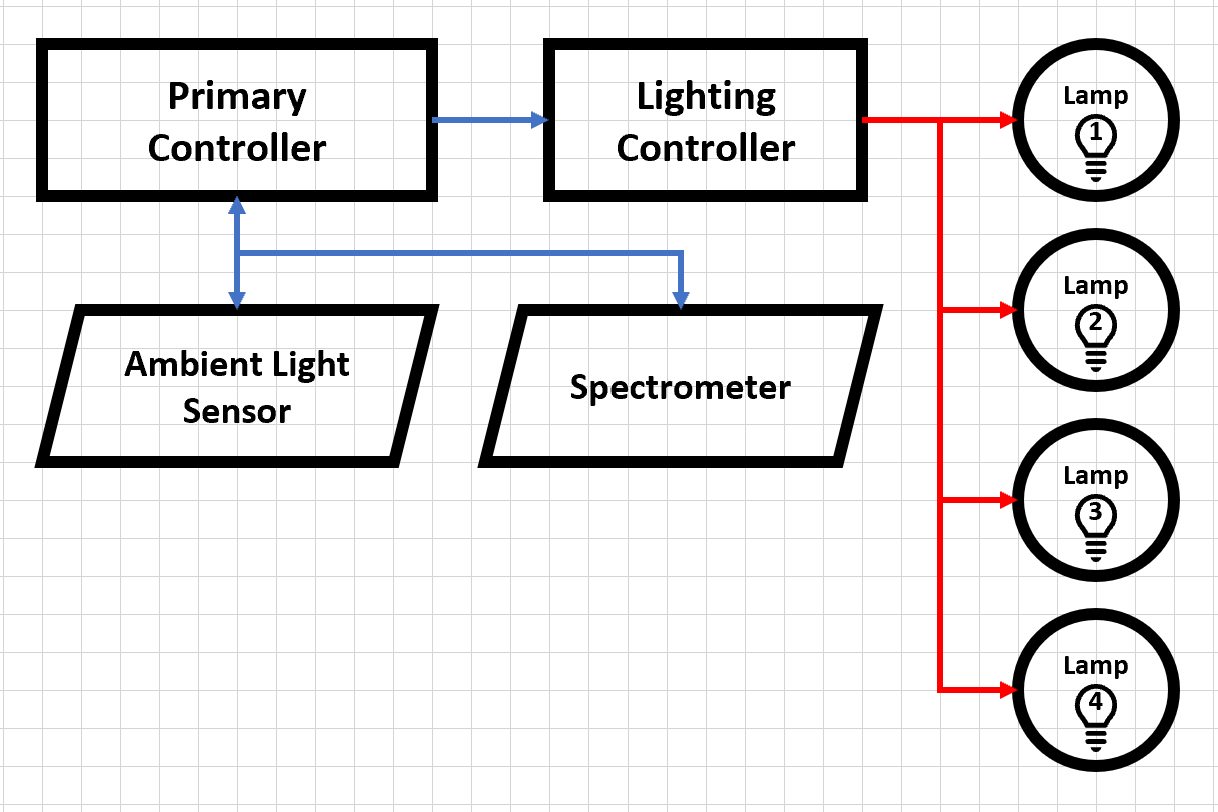
Let's begin with a review of the original project schematic. As demonstrated below the schematic began with a primary controller. This controller would be responsible for managing the communication path between the sensors responsible for measuring light levels and color components. Integrating these results into actionable output commands would also be directed from the primary controller to a dedicated lighting controller. The lighting controller's primary function is to interpret lighting commands into AC power line changes to the associated dimmable LED lamps (up to four).
![]()
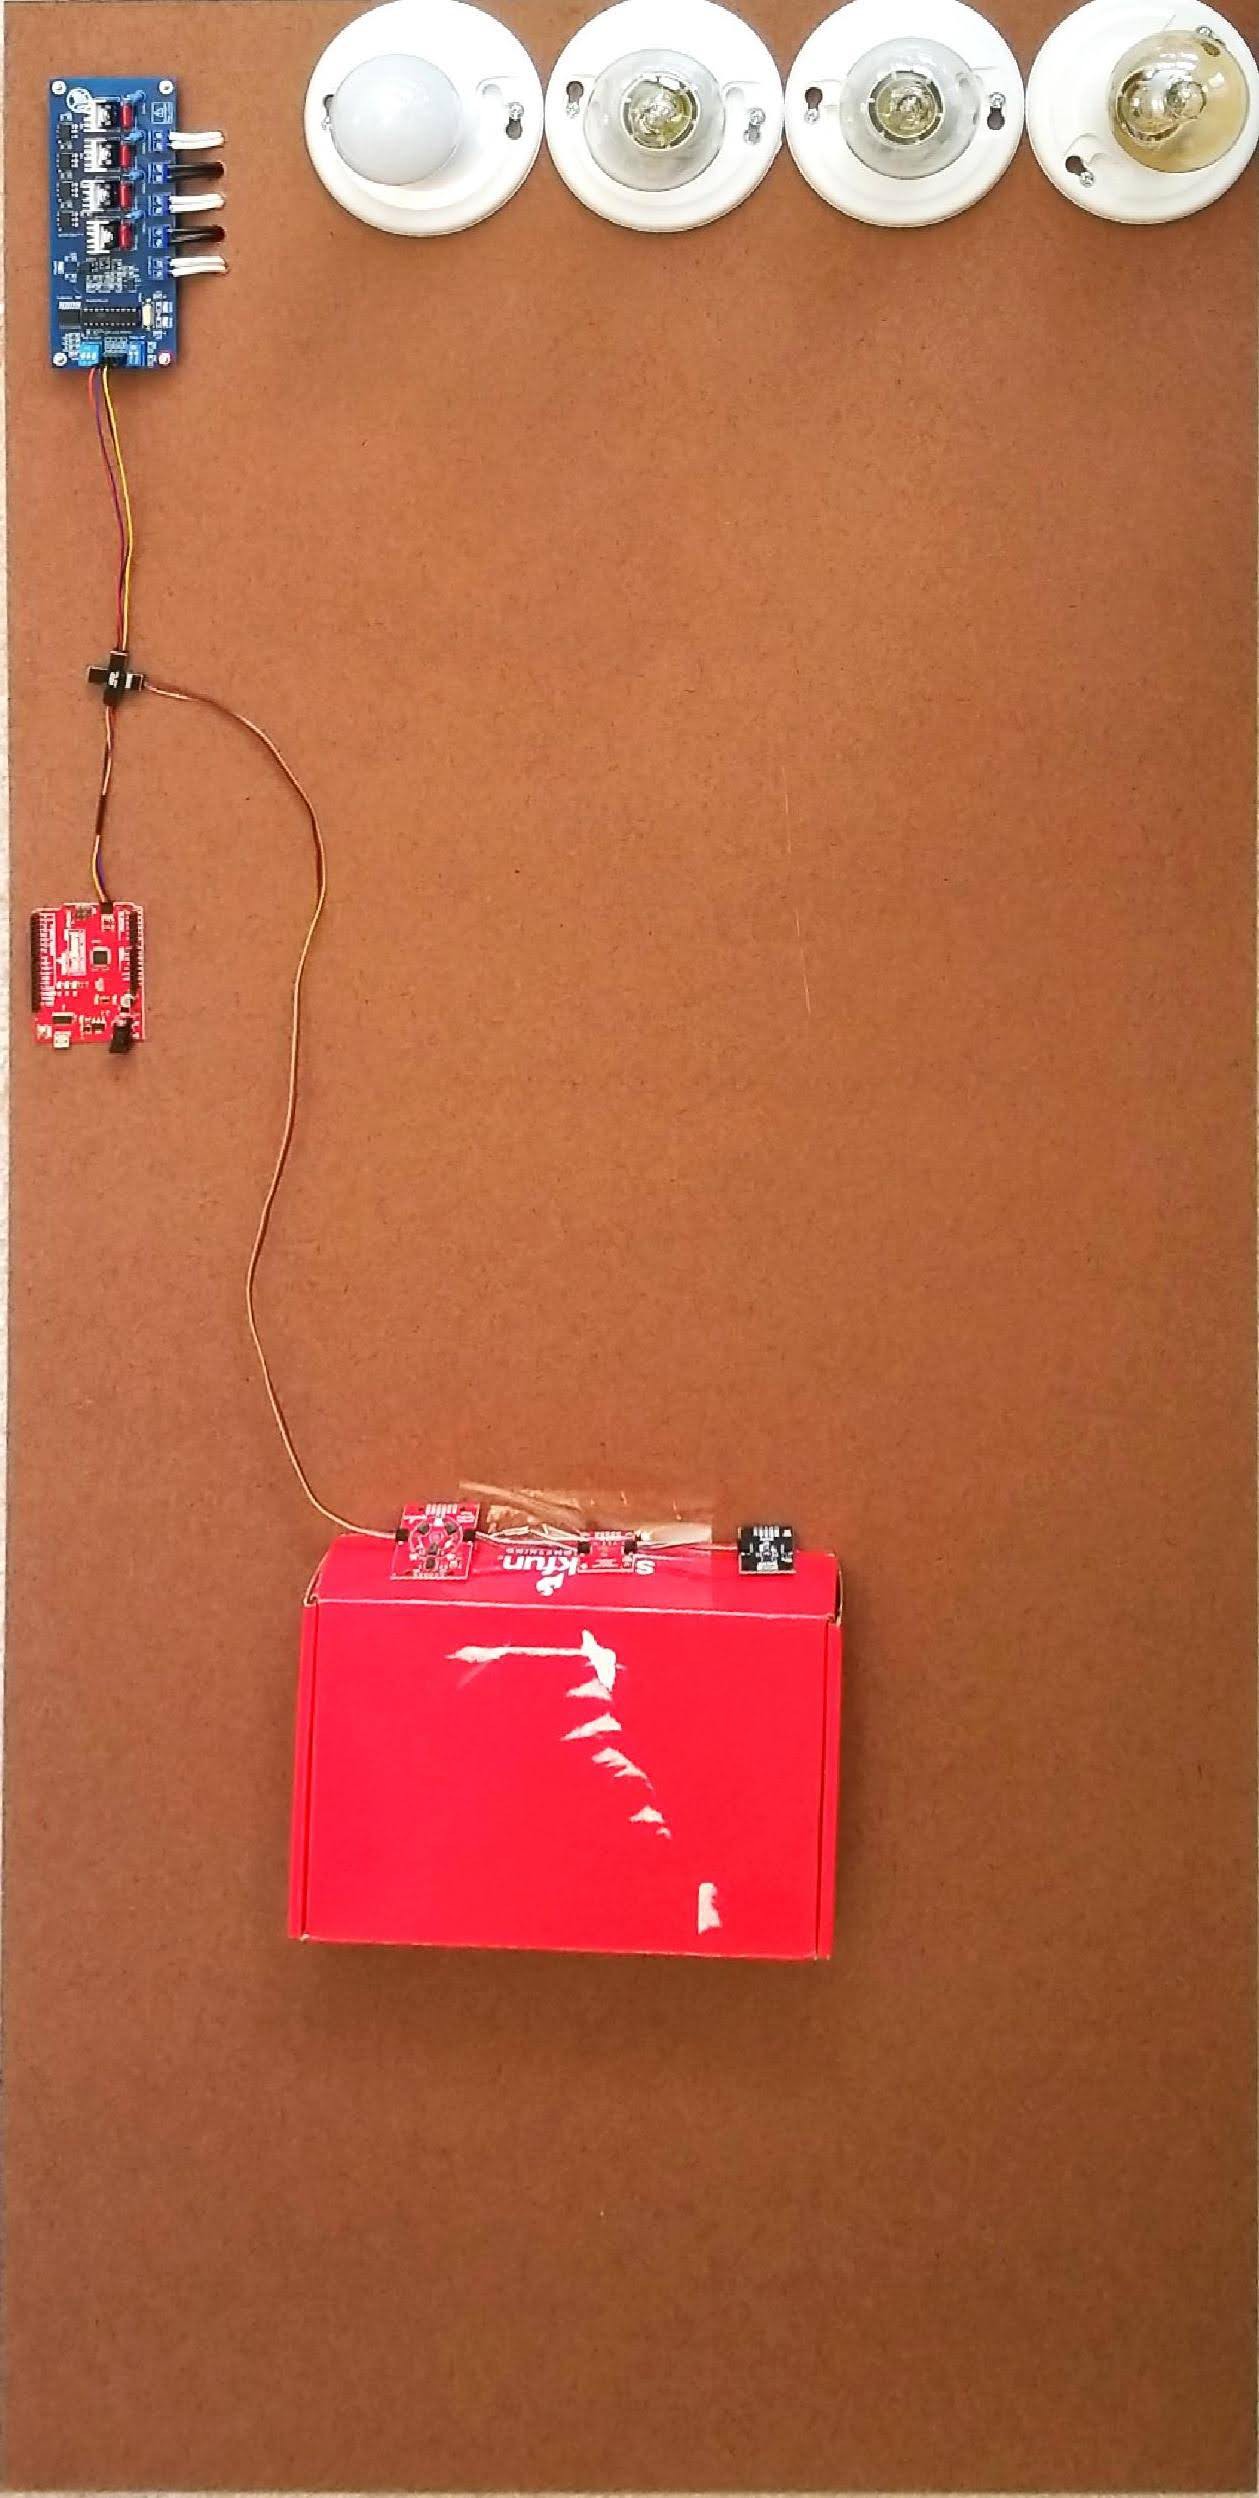
Original project schematic documenting the primary controller in communication with multiple sensors as well as a dedicated lighting controller controlling up to four (4) lamps using traditional AC power controls (in red). Implementing this design as a prototype has proven straightforward. As documented below the current prototype board retained a standalone lighting controller with connectivity to four lamps. The primary controller is currently deployed as a standard arduino board. Given the availability of numerous I2C-based sensors we've actually experimented with more sensors than simply the spectrometer and ambient light sensor documented in the original schematic. Although the spectrometer has provided insight into the distinctions between each lamps color spectrum, we've also had good luck with taking color temperature measurements using an RGB sensor board.
![]()
The current prototype system with lamps, lighting circuit controller, arduino controller, and three (3) sensors for lighting spectrum analysis, lux readings, and color temperature calculations using an RGB sensor. And yes, we did use a shipping box as an integral part of the prototype! What might be rightly questioned at this point is how this turns into a usable lighting fixture? The good news is that this part of the design is incredibly flexible. Realistically, the only component which would have to be incorporated into a lighting fixture would be the lighting controller element. These electronics could be housed within or adjacent to most any existing 2- to 4- light fixture to provide the necessary local modulation of AC power. The primary controller and sensor network could also be integral to the fixture, or it could be wired remotely or even done wirelessly. Part of our goal in designating a standalone lighting controllers was facilitating that kind of separation. The primary controller and sensors are incredibly simple elements which are much more complicated in prototype form than they would need to be if implemented on a single PCB as a remote device (and even in their current form they're still incredibly compact!).
In constructing our prototype we intended to remain abstract rather than choose a specific fixture design since we've imagined this concept having applications in multiple areas. From a simple overhead light, to a bathroom vanity, to an even larger fixture appropriate for commercial installations the fundamental concept was focused around color temperature control of commodity dimmable lamps. After putting in the hard work to construct their CalEarth building, I don't imagine anyone choosing the fixture design of our prototype as a centerpiece to their new home. However, I would like to imagine that whatever lighting fixtures are selected could incorporate some of the control elements we've evaluated.
-
The Joys of Conglomeration
09/21/2020 at 09:01 • 0 commentsOne of the stated goals of the project was to speed implementation through the use of retail boards rather than scratch-built circuits. Of course, this brings its own unique sets of challenges and rewards, a couple of which I'd like to highlight here.
The primary controller and sensor elements have proven very easy to address and program. In large part this is thanks to the exhaustive and easy-to-follow documentation Sparkfun has constructed around the devices we sourced from them. Getting started guides have proven a valuable part of the experience above and beyond the usual starting points of datasheets or sample code.
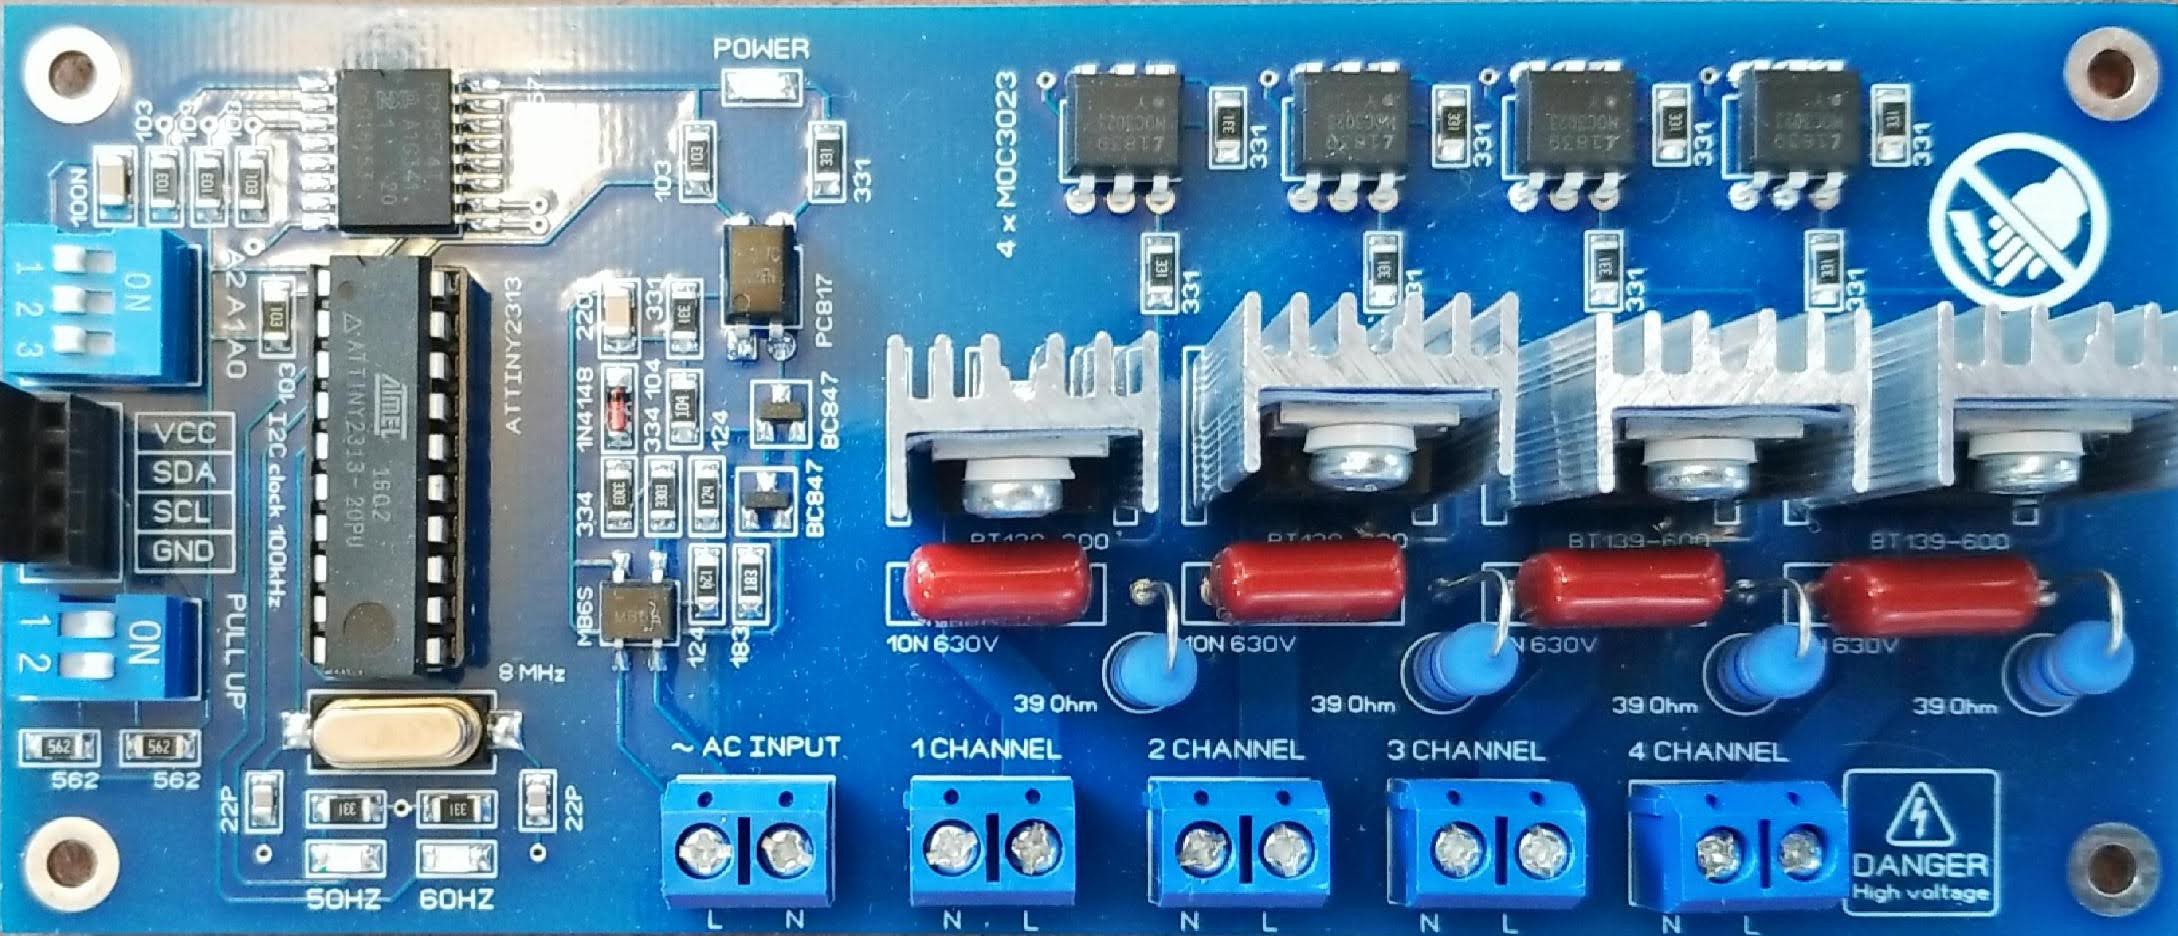
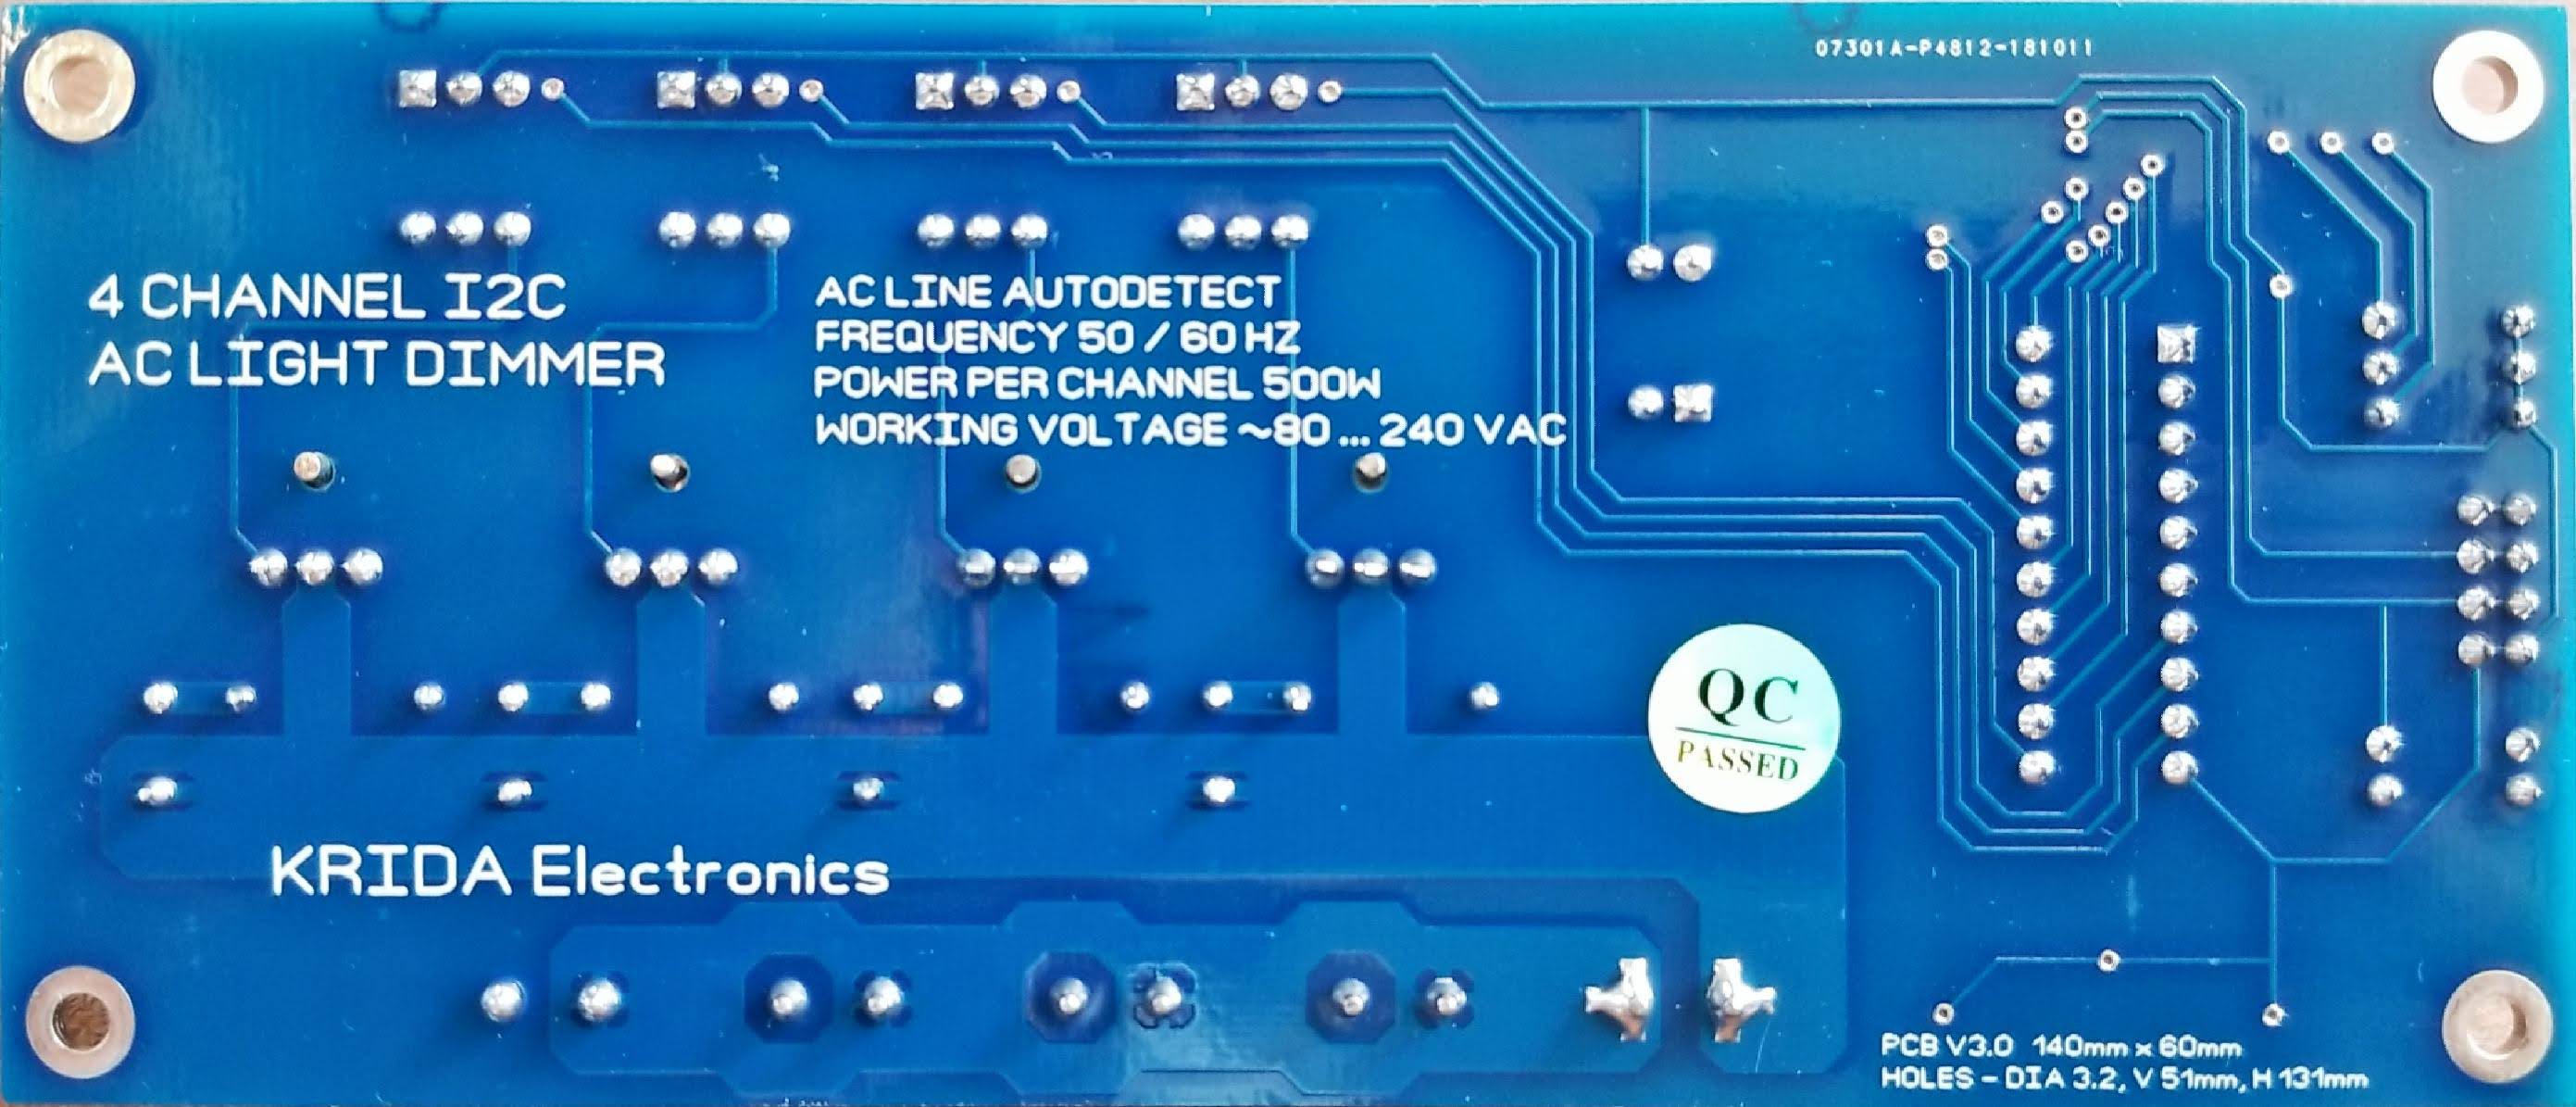
However, while the lighting controller board was also easy to start addressing using the code samples provided (evidenced by our quick success at blinking a light) perhaps one of the most valuable pieces of documentation was sourced not from the manufacturer but rather from an Amazon reviewer(!). That review clarified the performance of the board's dimming range. The range is addressable from 100 (full off) to 0 (full on), but values above 66 produce either no output or full output (the latter being the most unexpected/undesirable result). We have been able to validate the same performance quirks with the controller used in our design, and have adjusted our code to limit itself to the functional range of the device. At this time it is unclear whether the issue is related to a hardware or firmware element within the device, but I'm sure further examination of the board's design would be interesting (if we didn't have more pressing matters at this time).
![]()
![]()
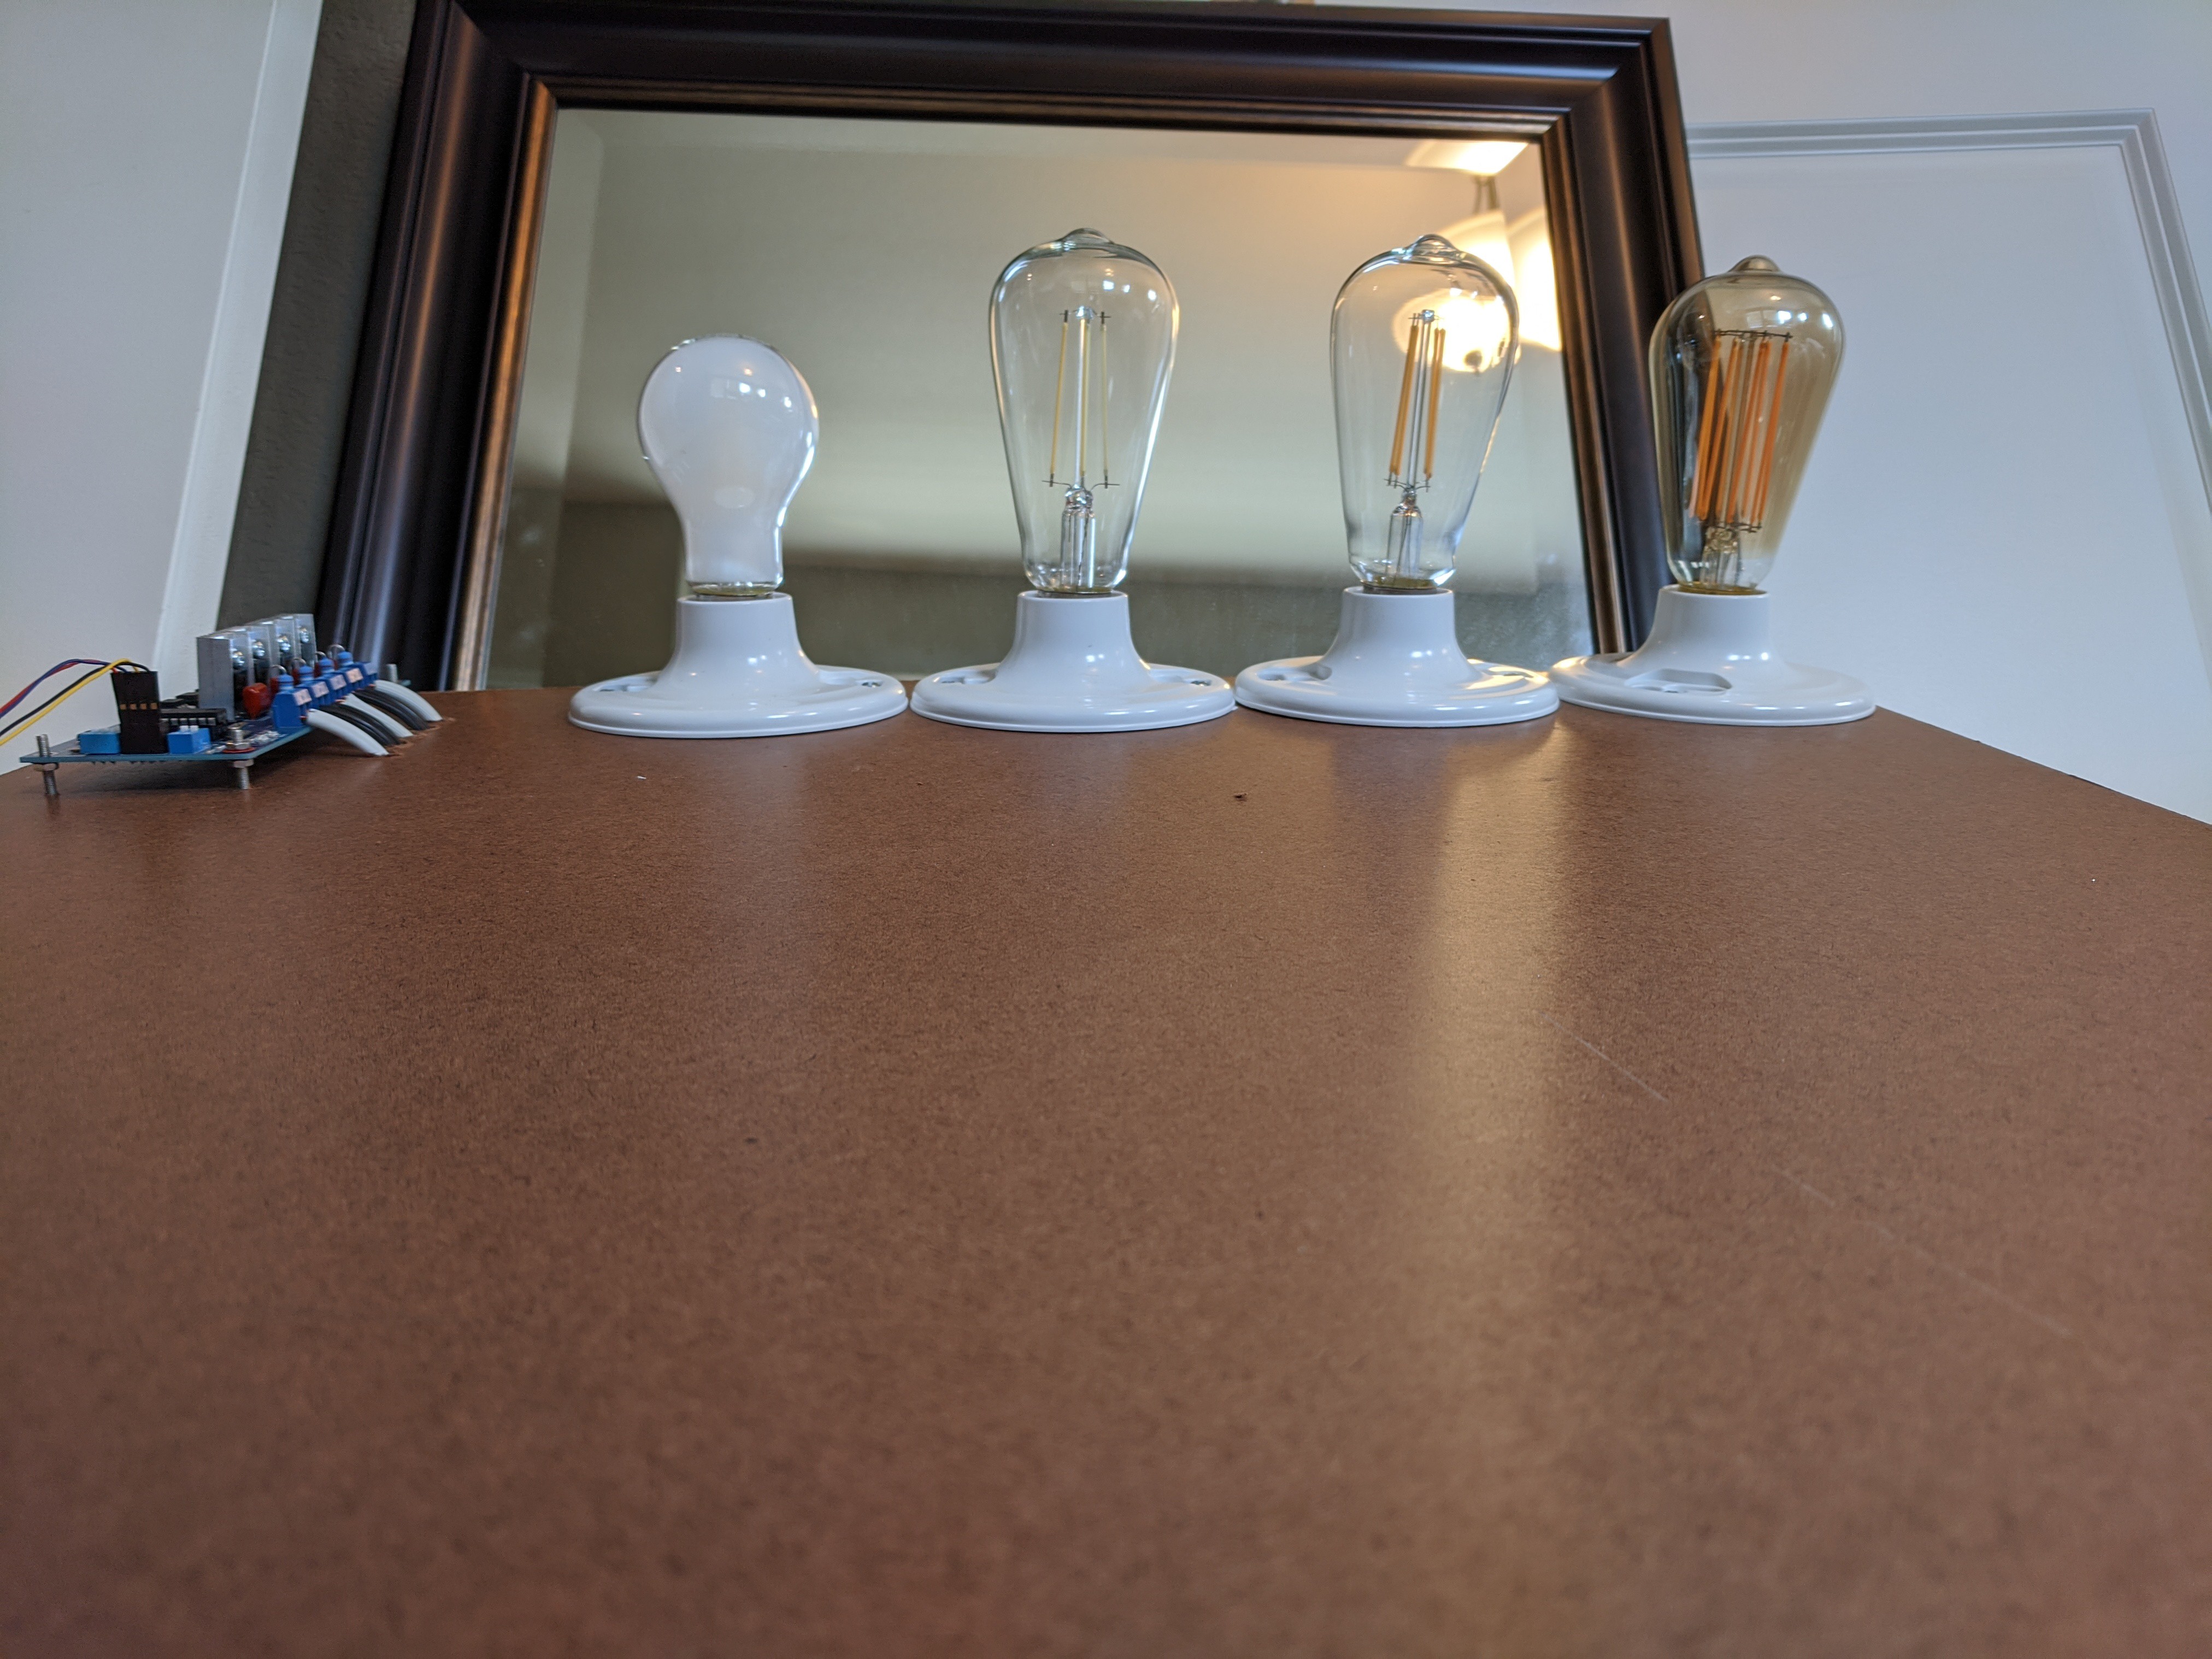
Lighting Controller - Top View Lighting Controller - Bottom In addition to the control circuits and sensors integral to our prototype, the idiosyncrasies of the circuits within the LED lamps themselves also require consideration. As part of the initial testing we were clearly able to record the different ways in which different light sources perform with a given electrical output level. The lamps pictured below, from left to right, are the GE Cool Daylight, the EcoSmart Daylight, a high-efficiency incandescent, and a Cree LED lamp (the latter two being part of our initial testing rather than components of the prototype). What you can clearly see the Cree (rather brightly) and the incandescent (albeit remarkably dimly) coming on from even the lowest output levels available from the lighting controller. As levels are increased the EcoSmart and then the GE light both activate.
![]()
Varying responses to increasing output power clearly visible from (L-R) the
GE Cool Daylight, EcoSmart Daylight, incandescent, and CREE LED lamps.While we plan to incorporate quantitative measures of this response as part of our project, this speaks to not only the value provided by the sensors we've selected for this prototype but perhaps their necessity. While a design with integrated LED light sources could make assumptions based upon datasheet values, recording and utilizing lighting responses to power input could prove useful for not only the overall flexibility of the system but also for the value provided by abstracting the lighting generation layer from the control layer.
More to come soon!
-
Prototyping has begun!
09/18/2020 at 19:46 • 0 commentsThe team recently added a link on the project page to the GitHub Project Dashboard. This should allow everyone to follow our progress during the final month of the competition.
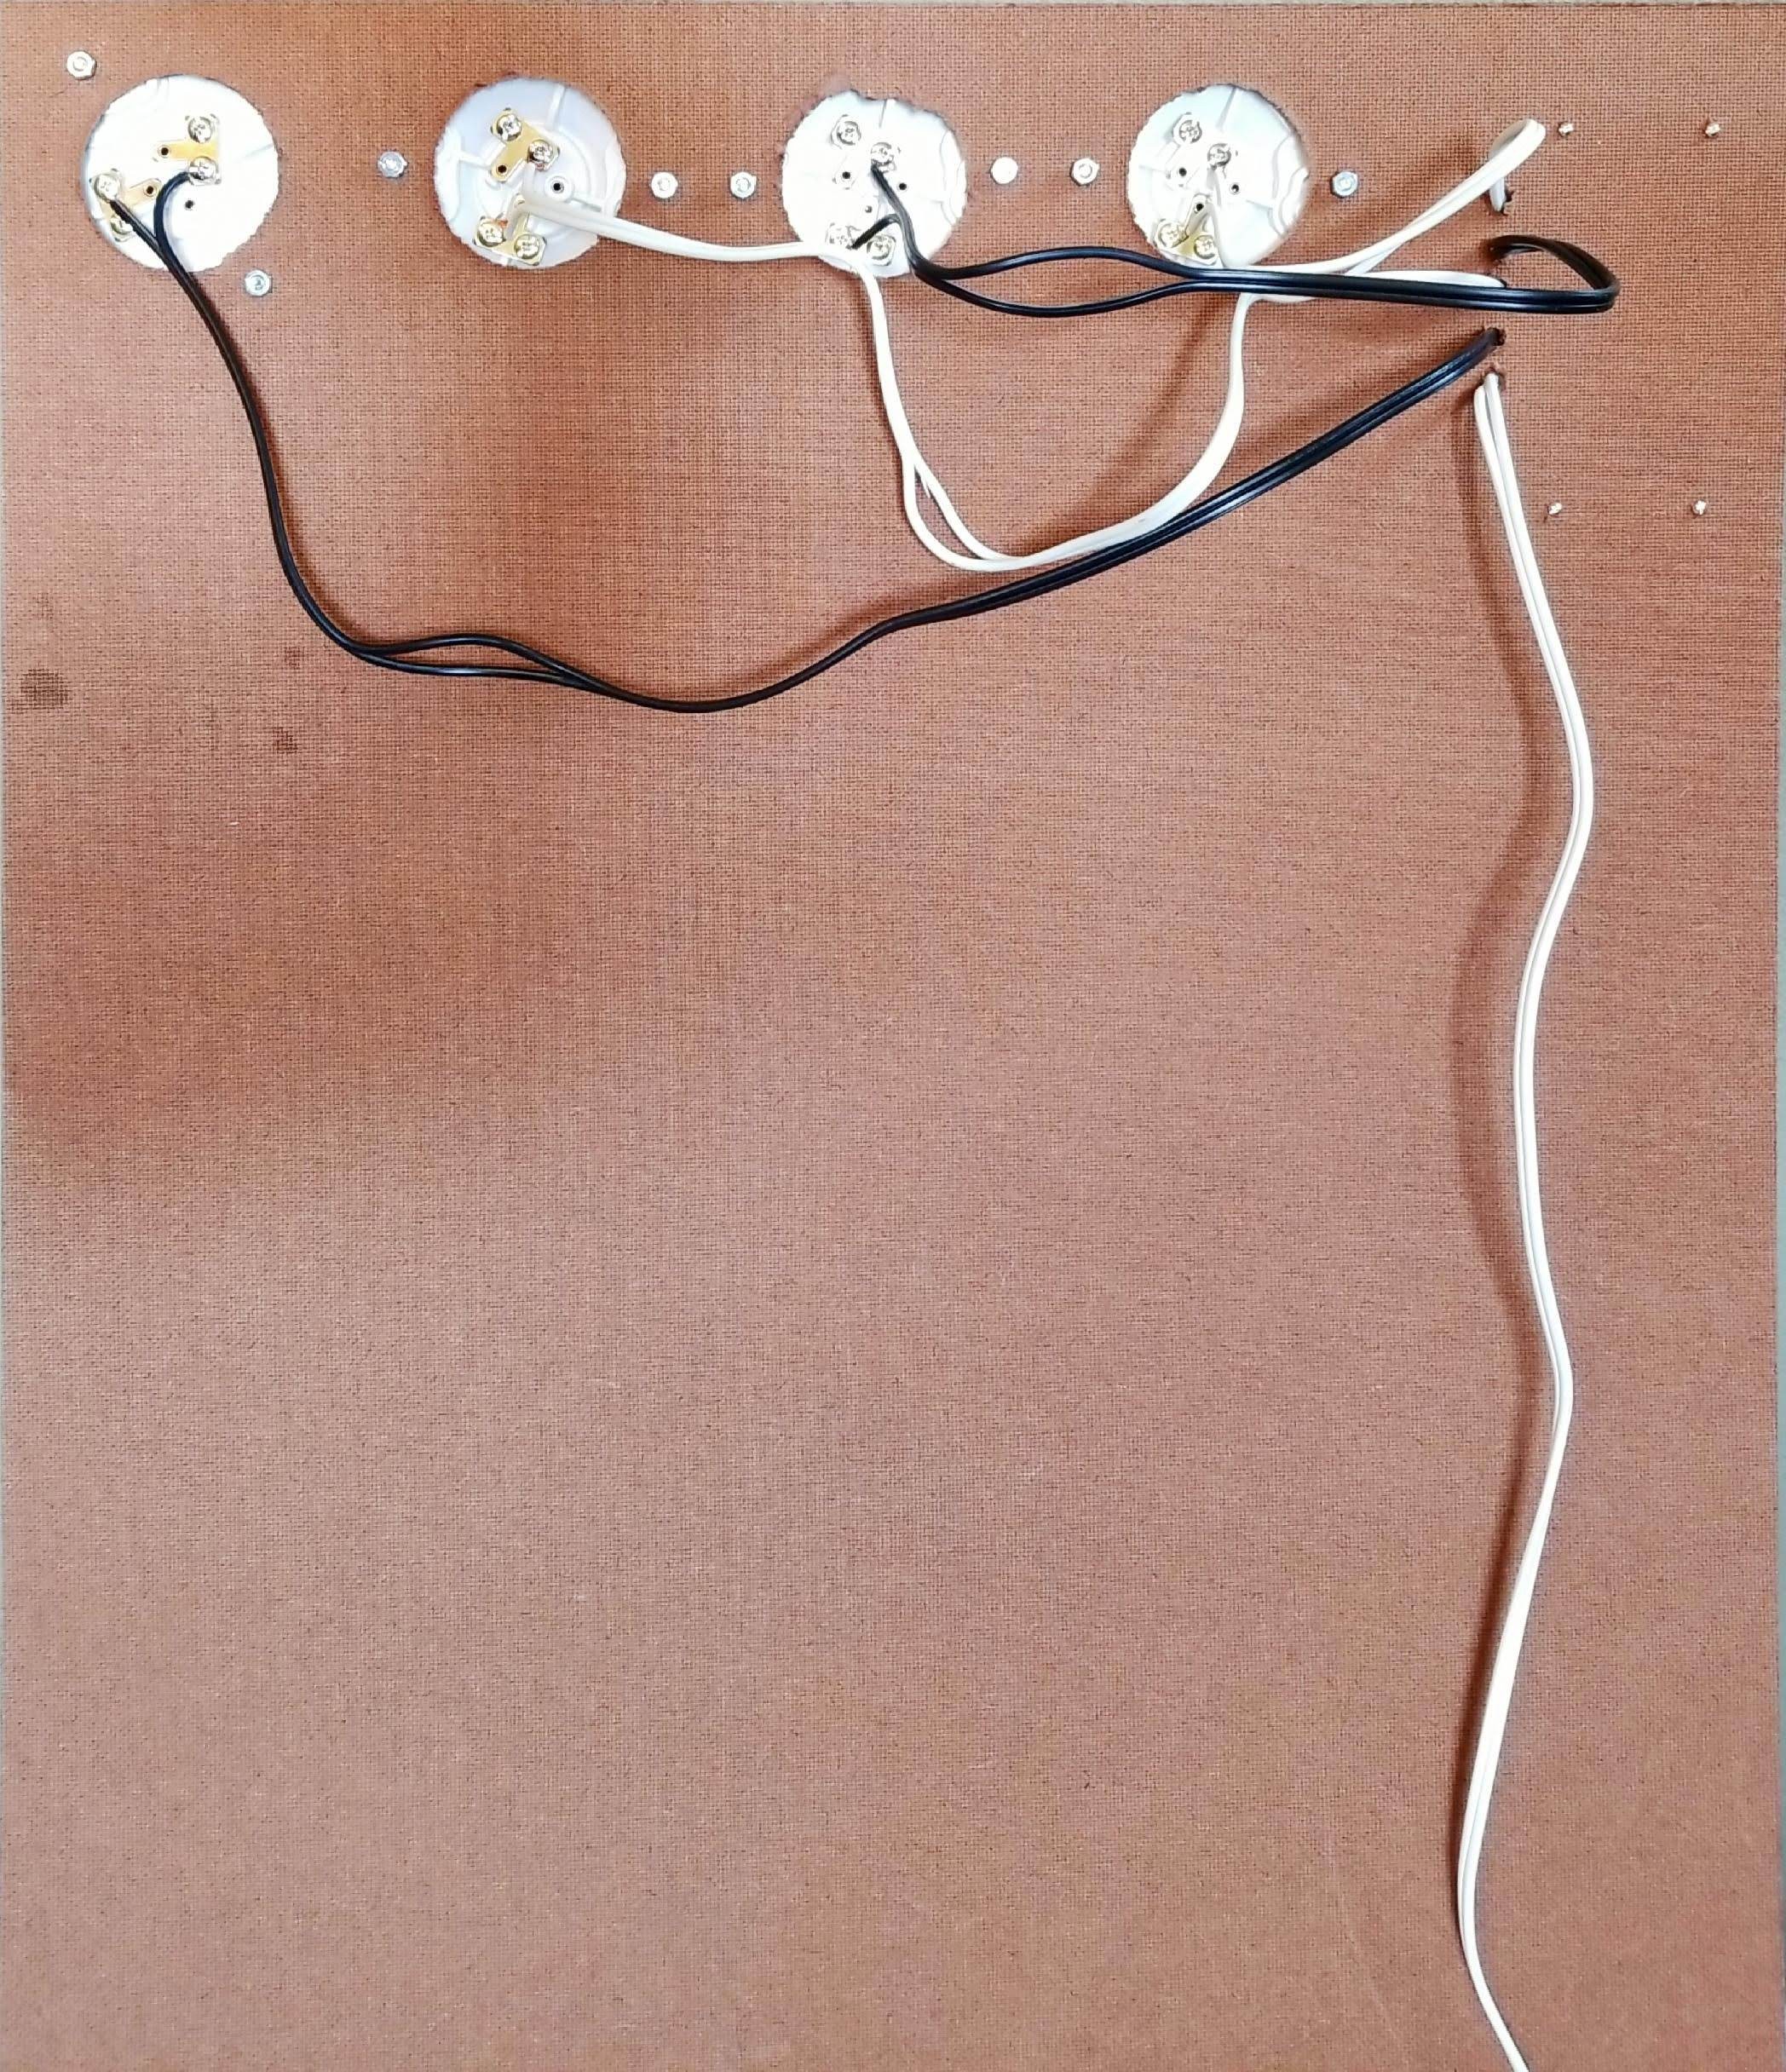
The prototyping board has been constructed and can be seen below. The primary purpose of this setup is to create a safe space for working with AC voltages. As you can see, traditional lamp fixture bases were used to hold the lamps. The AC dimmer controller board is held up off the prototype board using bolts and nuts as a standoff system. The lamp cords were routed underneath the board. All of this is intended to minimize exposure to the AC side of the circuit while working on top of the prototype board with the low-voltage sensors. This configuration should also keep the light sources close together and, as such, within the field of view of the sensors associated with the project.
![]()
![]()
![]()
Sensor-eye view of the lamps Lighting controller close-up Underside with AC cables You may see that the lamp cords in the underside view are separated in some places. This was done to facilitate later non-contact current measurements with a clamp meter. Voltage measurements should be possible using the terminal contacts directly on the lighting controller.
This is the first arduino project for everyone involved on the team, and we can already say that we've done our own variant of everyone's first arduino project: rather than blinking a low-voltage LED we've managed to blink an AC LED lamp!
More updates soon...
![]()
-
Talking Trade-Offs: Color Perception and Color Mixing
09/02/2020 at 08:01 • 0 commentsAs mentioned earlier, fluorescent lamps attempted to address their color spectrum limitations through the addition of newer and more complex phosphors targeted to produce additional color wavelengths. LEDs have another option given their naturally monochromatic nature through the addition of more LEDs engineered to output desired wavelengths1. However, this method has challenges associated with the efficacy of different LED sources to produce light as perceived by the human eye. This design comes under the header of color-mixing LEDs (where LED light emission is the only source), and hybrid-LED designs (where one or more color-mixing LEDs are combined with phosphor-coated LEDs). Though both designs merit further discussion to understand their place in the present and future of white light LEDs, the role of the human eye in color perception also deserves examination.
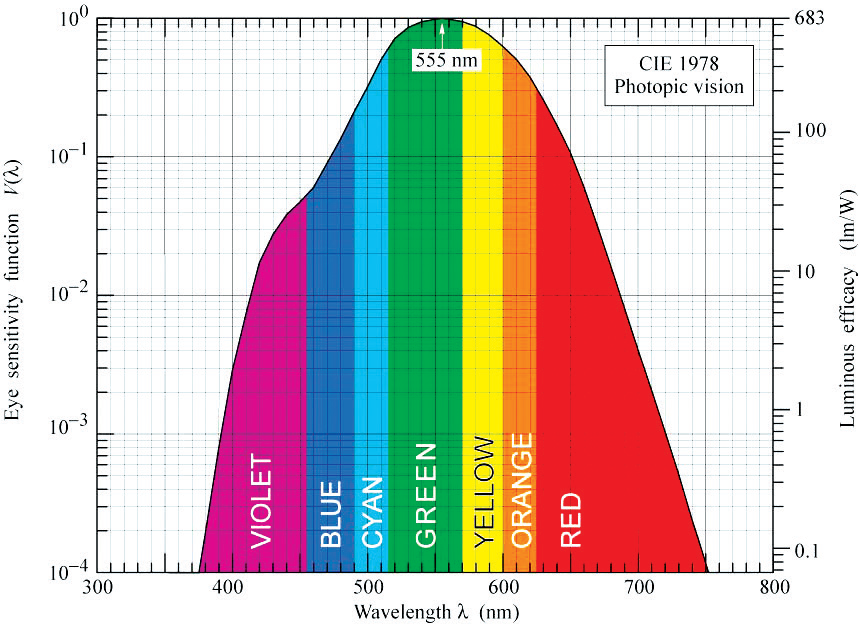
Earlier the low efficacy of filament light sources was demonstrated by highlighting their tendency towards producing energy in wavelengths invisible to the human eye (particularly as infrared heat energy). Wavelengths of visible light are not, however, all perceived with similar levels of sensitivity by the human eye nor are their means of production using semiconductor sources equally efficient. Just as CRI establishes the conformance of a light source of a given temperature to color rendering associated with an incandescent source, the luminous efficiency function (or eye sensitivity function) demonstrates that the eye has significantly different responses to each of the wavelengths of the visible spectrum. This sensitivity peaks at the green 555 nm wavelength. As expressed in luminous efficacy, it demonstrates that an ideal monochromatic source (excluding all other losses) could have a peak luminous efficacy of 683 lumens per watt. See the figure below for a chart of eye sensitivity.
Of course, a monochromatic source would score some 0 CRI and as such be unsuitable for general lighting. However, it is this curve which high efficiency sources are exploiting by combining peaks in the blue and red regions, where the eye is less sensitive, to combine and produce a light which both appears white while providing suitable efficiency. Early fluorescent lamps did just that, producing high luminous efficacy while outputting only two primary wavelengths. Thus, they also suffered from the limited CRI possible with such a combination. Balancing high efficacy with acceptable CRI is the primary challenge for lighting such as fluorescents and LEDs (whose emissions and/or phosphors often exhibit emission in defined wavelengths rather than as a continuous spectrum as with incandescent light sources).
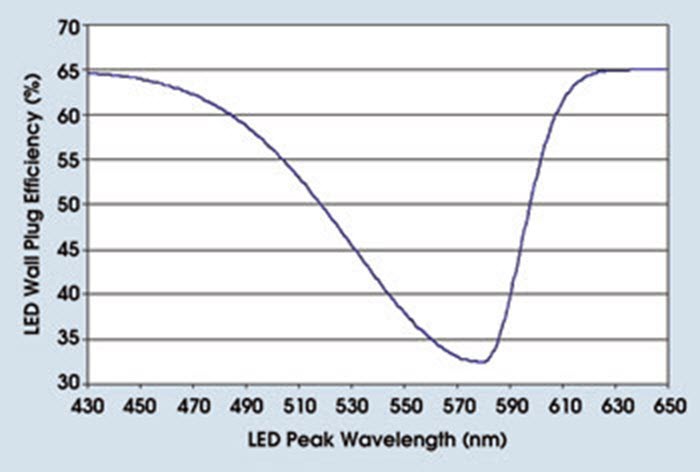
LEDs seem an obvious candidate for mixing together different colors without suffering the energy losses associated with phosphors, but significant differences in efficiency exist today among LEDs operating at different wavelengths along the visible spectrum. The least efficient LED designs are those engineered to output at or near the 555nm peak eye sensitivity wavelength referenced earlier. This is commonly known as the green-gap (see the figure below) and is one of the reasons why phosphor-coated systems have prevailed over color-mixing only designs to date. While blue LEDs have achieved power conversion efficiencies of 60% and greater, red, green, and amber sources have been limited to 44%, 22%, and 8% respectively2.
![]()
The normalized eye sensitivity chart also expressed as luminous efficacy.1
LED efficiency as a function of wavelength.3 Contrast the trough in this curve with the peak in the chart to the left.
Collectively these factors help to explain the popularity of the dominant LED system design based upon blue light LEDs. They also could be seen to recommend the approach we've taken to incorporate commodity white lamps rather than build a color mixing solution one wavelength at a time. Of course, integrating a color spectrometer will enable some level of understanding as to what any given light source we've selected contributes towards its part of the color spectrum. Ideally we should be able to leverage the optimizations present in low-cost LED light sources while producing a light system greater than the sum of its parts.
1 Schubert, Fred. Light Emitting Diodes. 2nd ed.
2 “The Prospects for Creating Efficient Color-Mixed White LEDs.” SSL Postings, 16 June 2015, energy.gov/sites/prod/files/2015/06/f23/postings_06-16-15.pdf.
3 Bretschneider, Eric. “Efficacy Limits for Solid-State White Light Sources.” Photonics Media, Photonics Media, 10 Jan. 2014, www.photonics.com/Article.aspx?AID=28677.
Lighting Color Control with Commodity Lamps
A controller system using consumer LED lamps to provide color temperature control and management alongside daylight dimming.