 Mayke
Mayke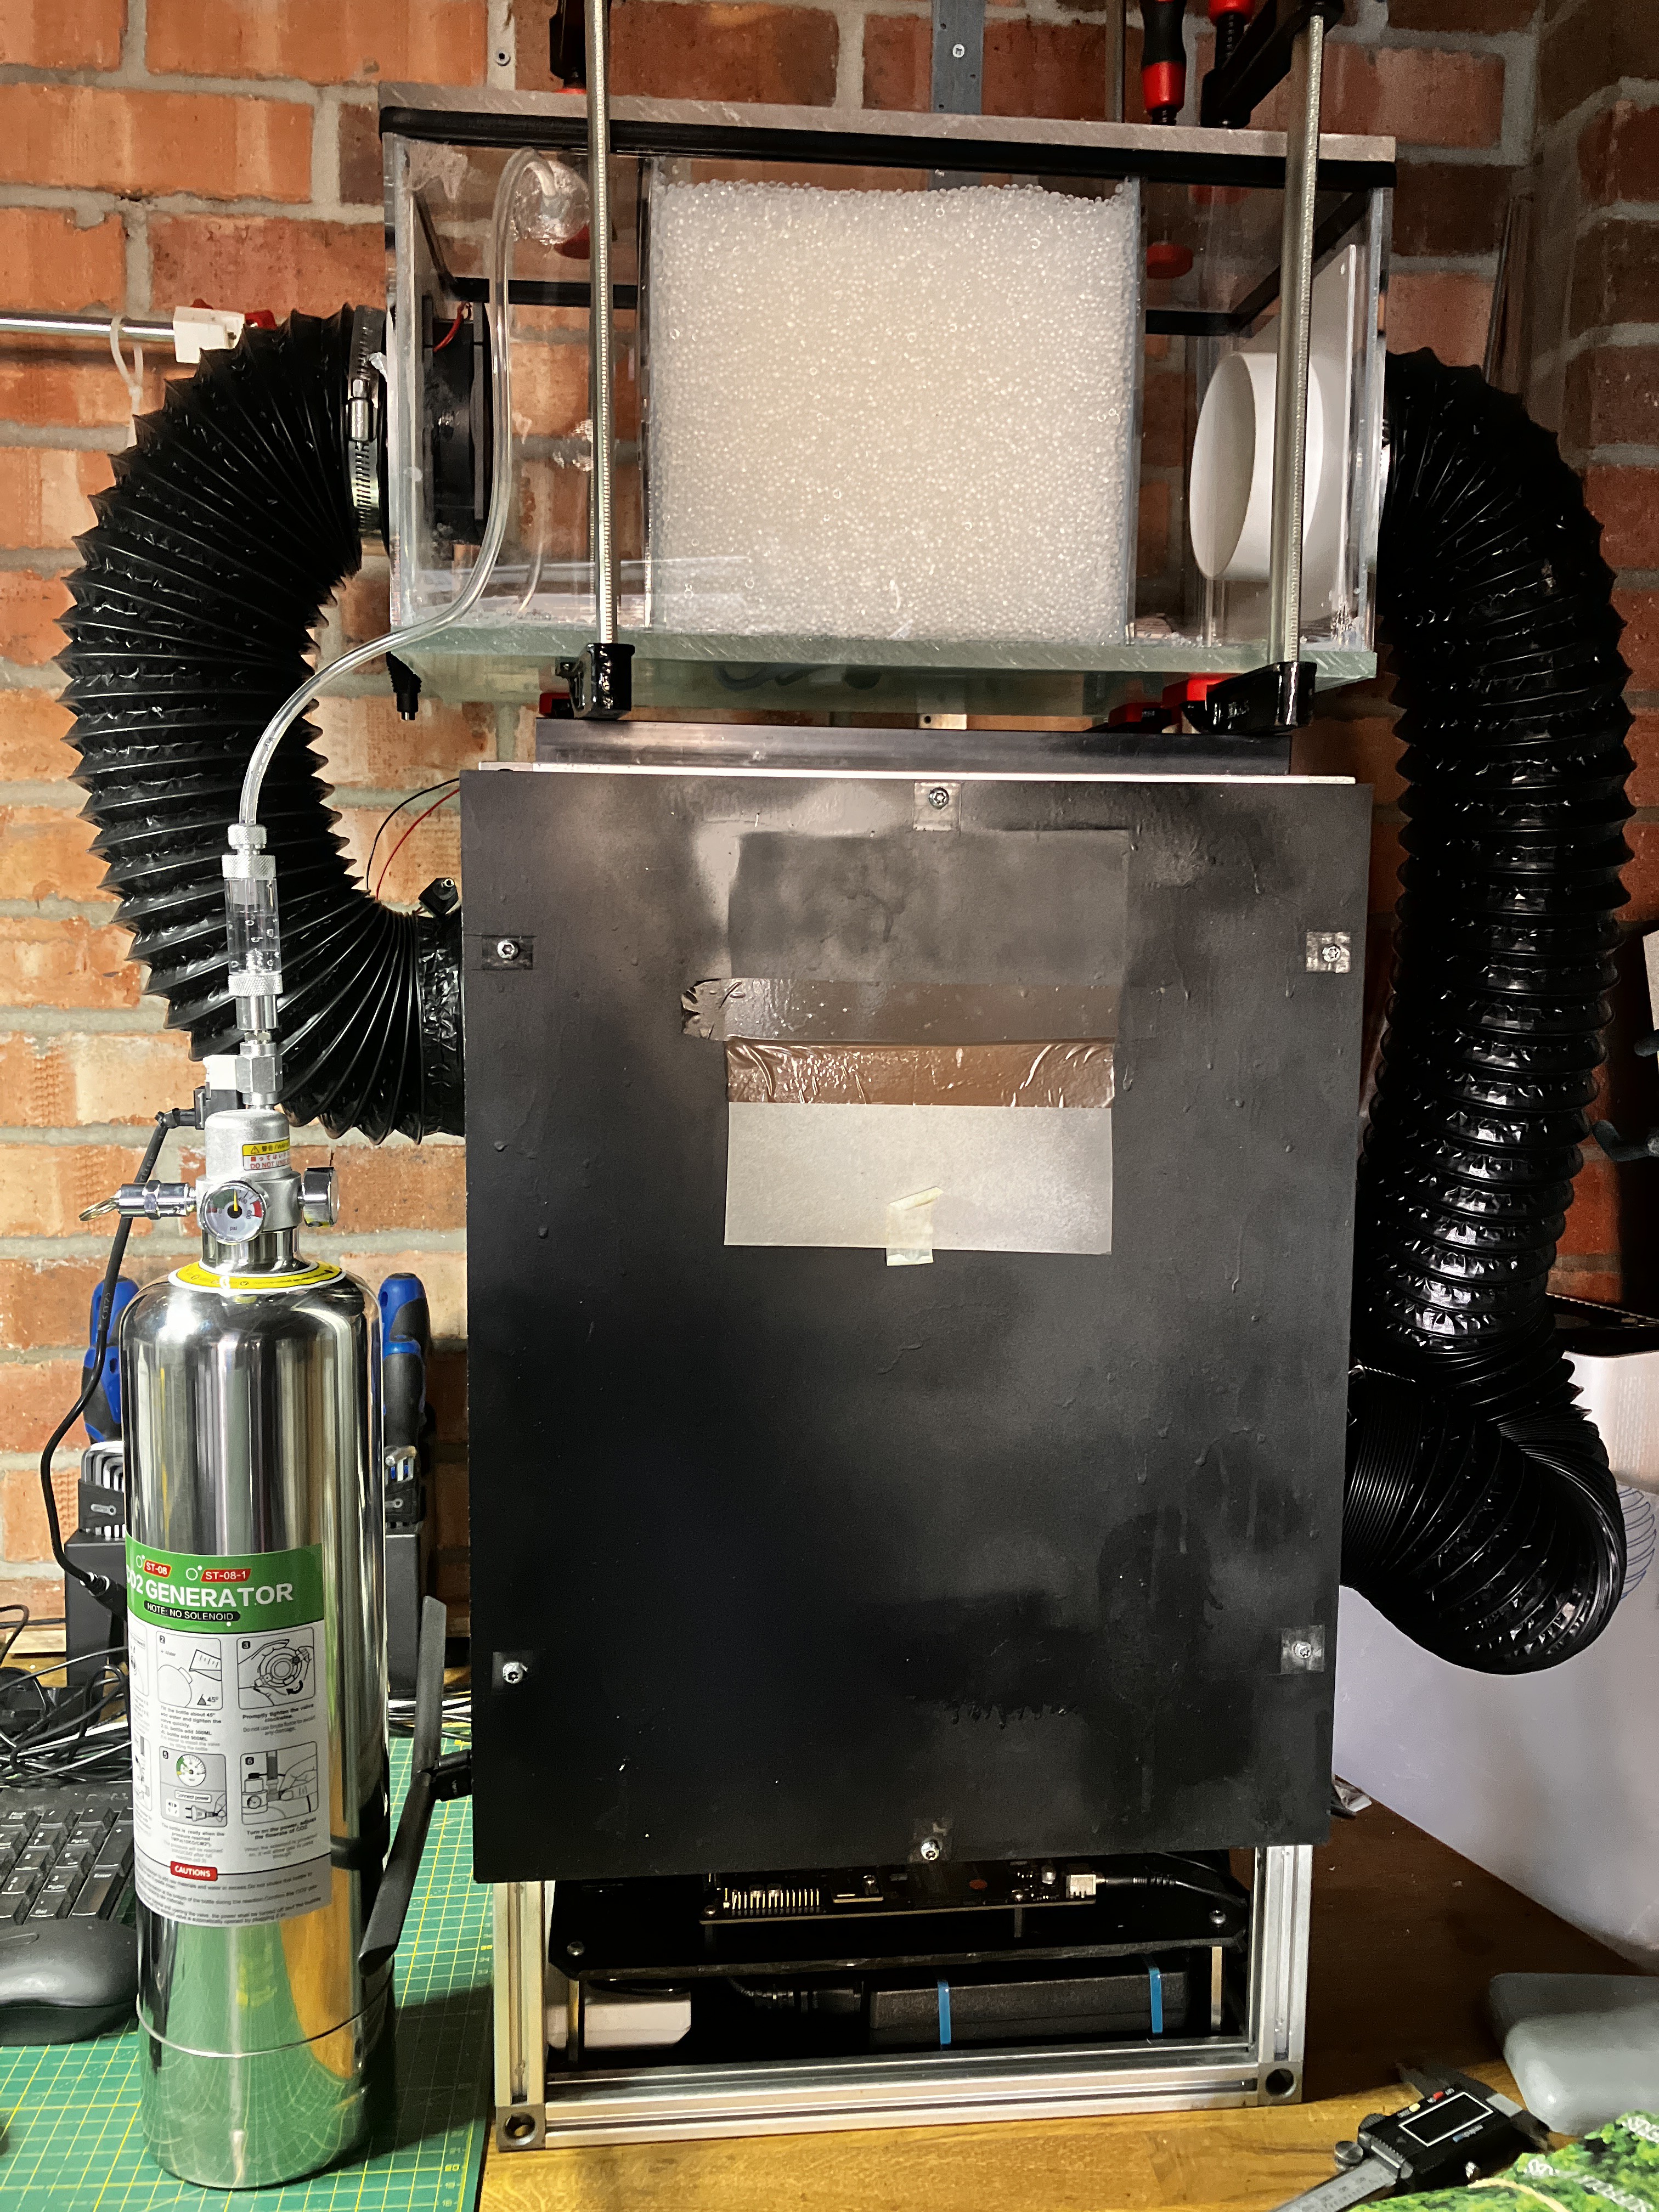
Hi fellas,
I have been busy with other projects and work but finally I had some time to post here some recent updates.
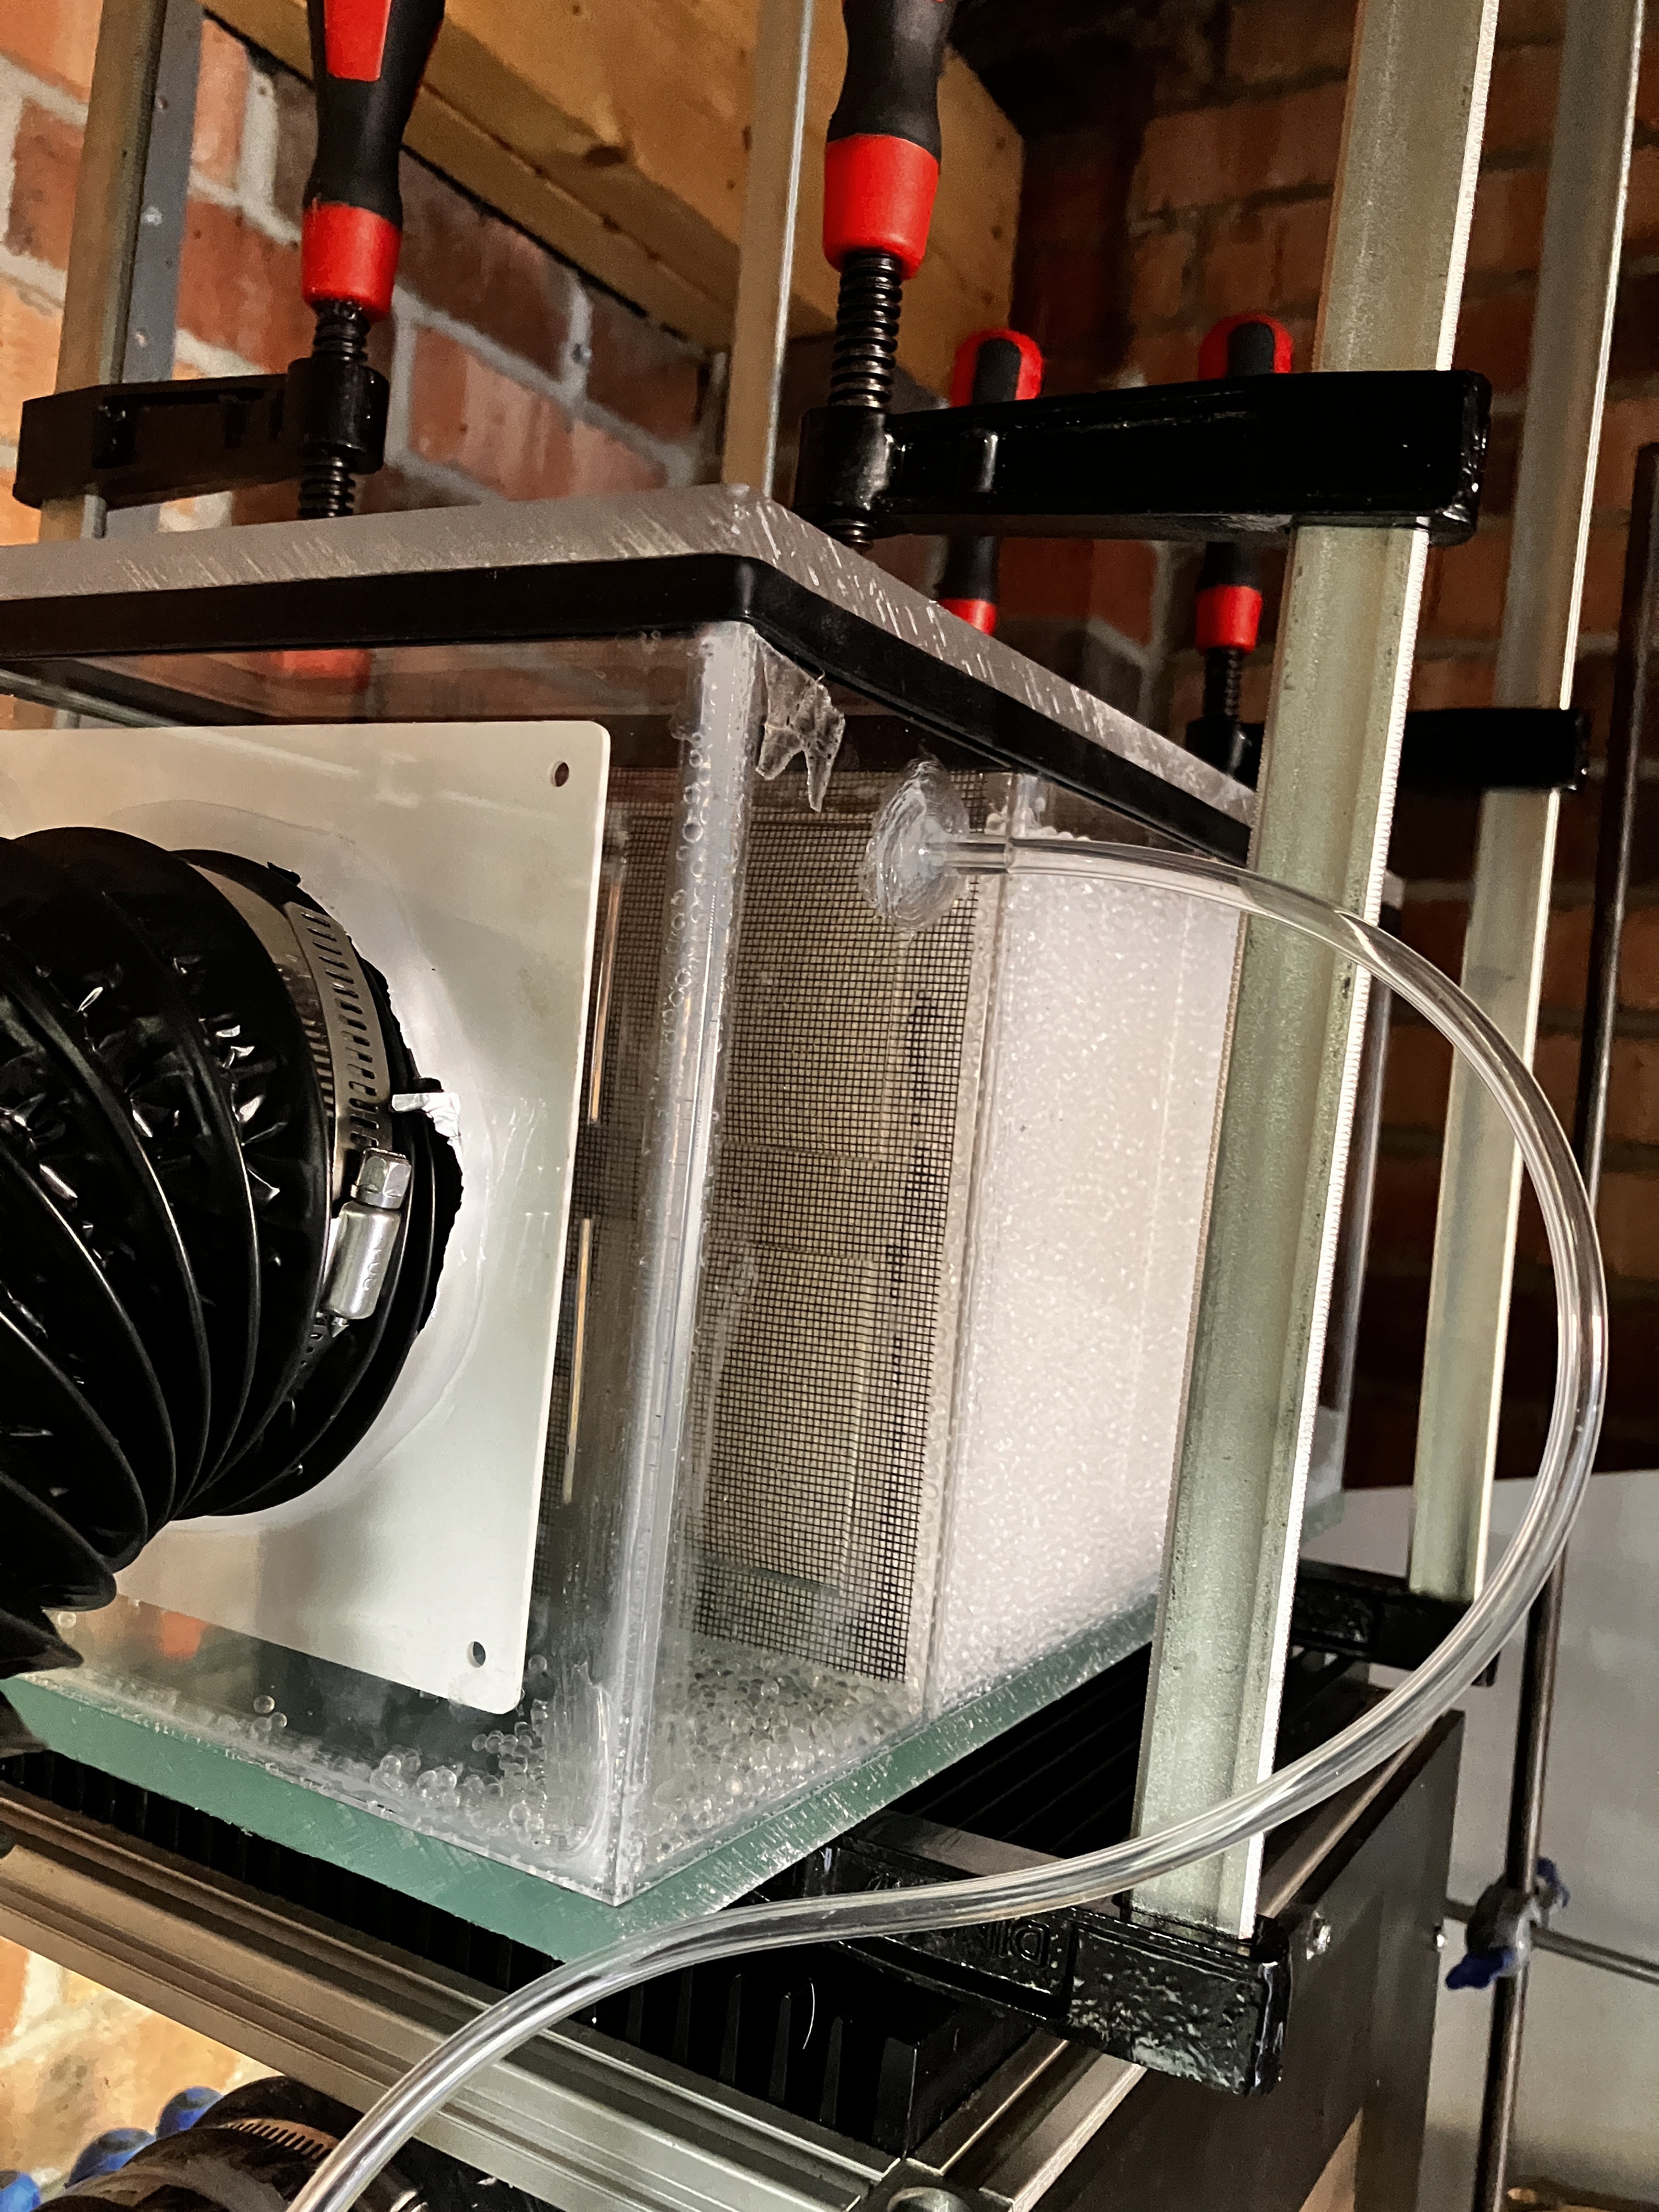
The biggest problem I had in my previous experiments was humidity saturation, which maxed out the sensors. I created an acrylic box (pictured above the fluorometer box) with a compartment in the centre full of desiccant silica gel, and a fan connected to a relay controlled by the Arduino with the si7021 sensor. Each time the humidity value hits 82%, the fan switches on for 15 seconds sending the value back to the low 80s and the cycle starts again. The data looks as follows:
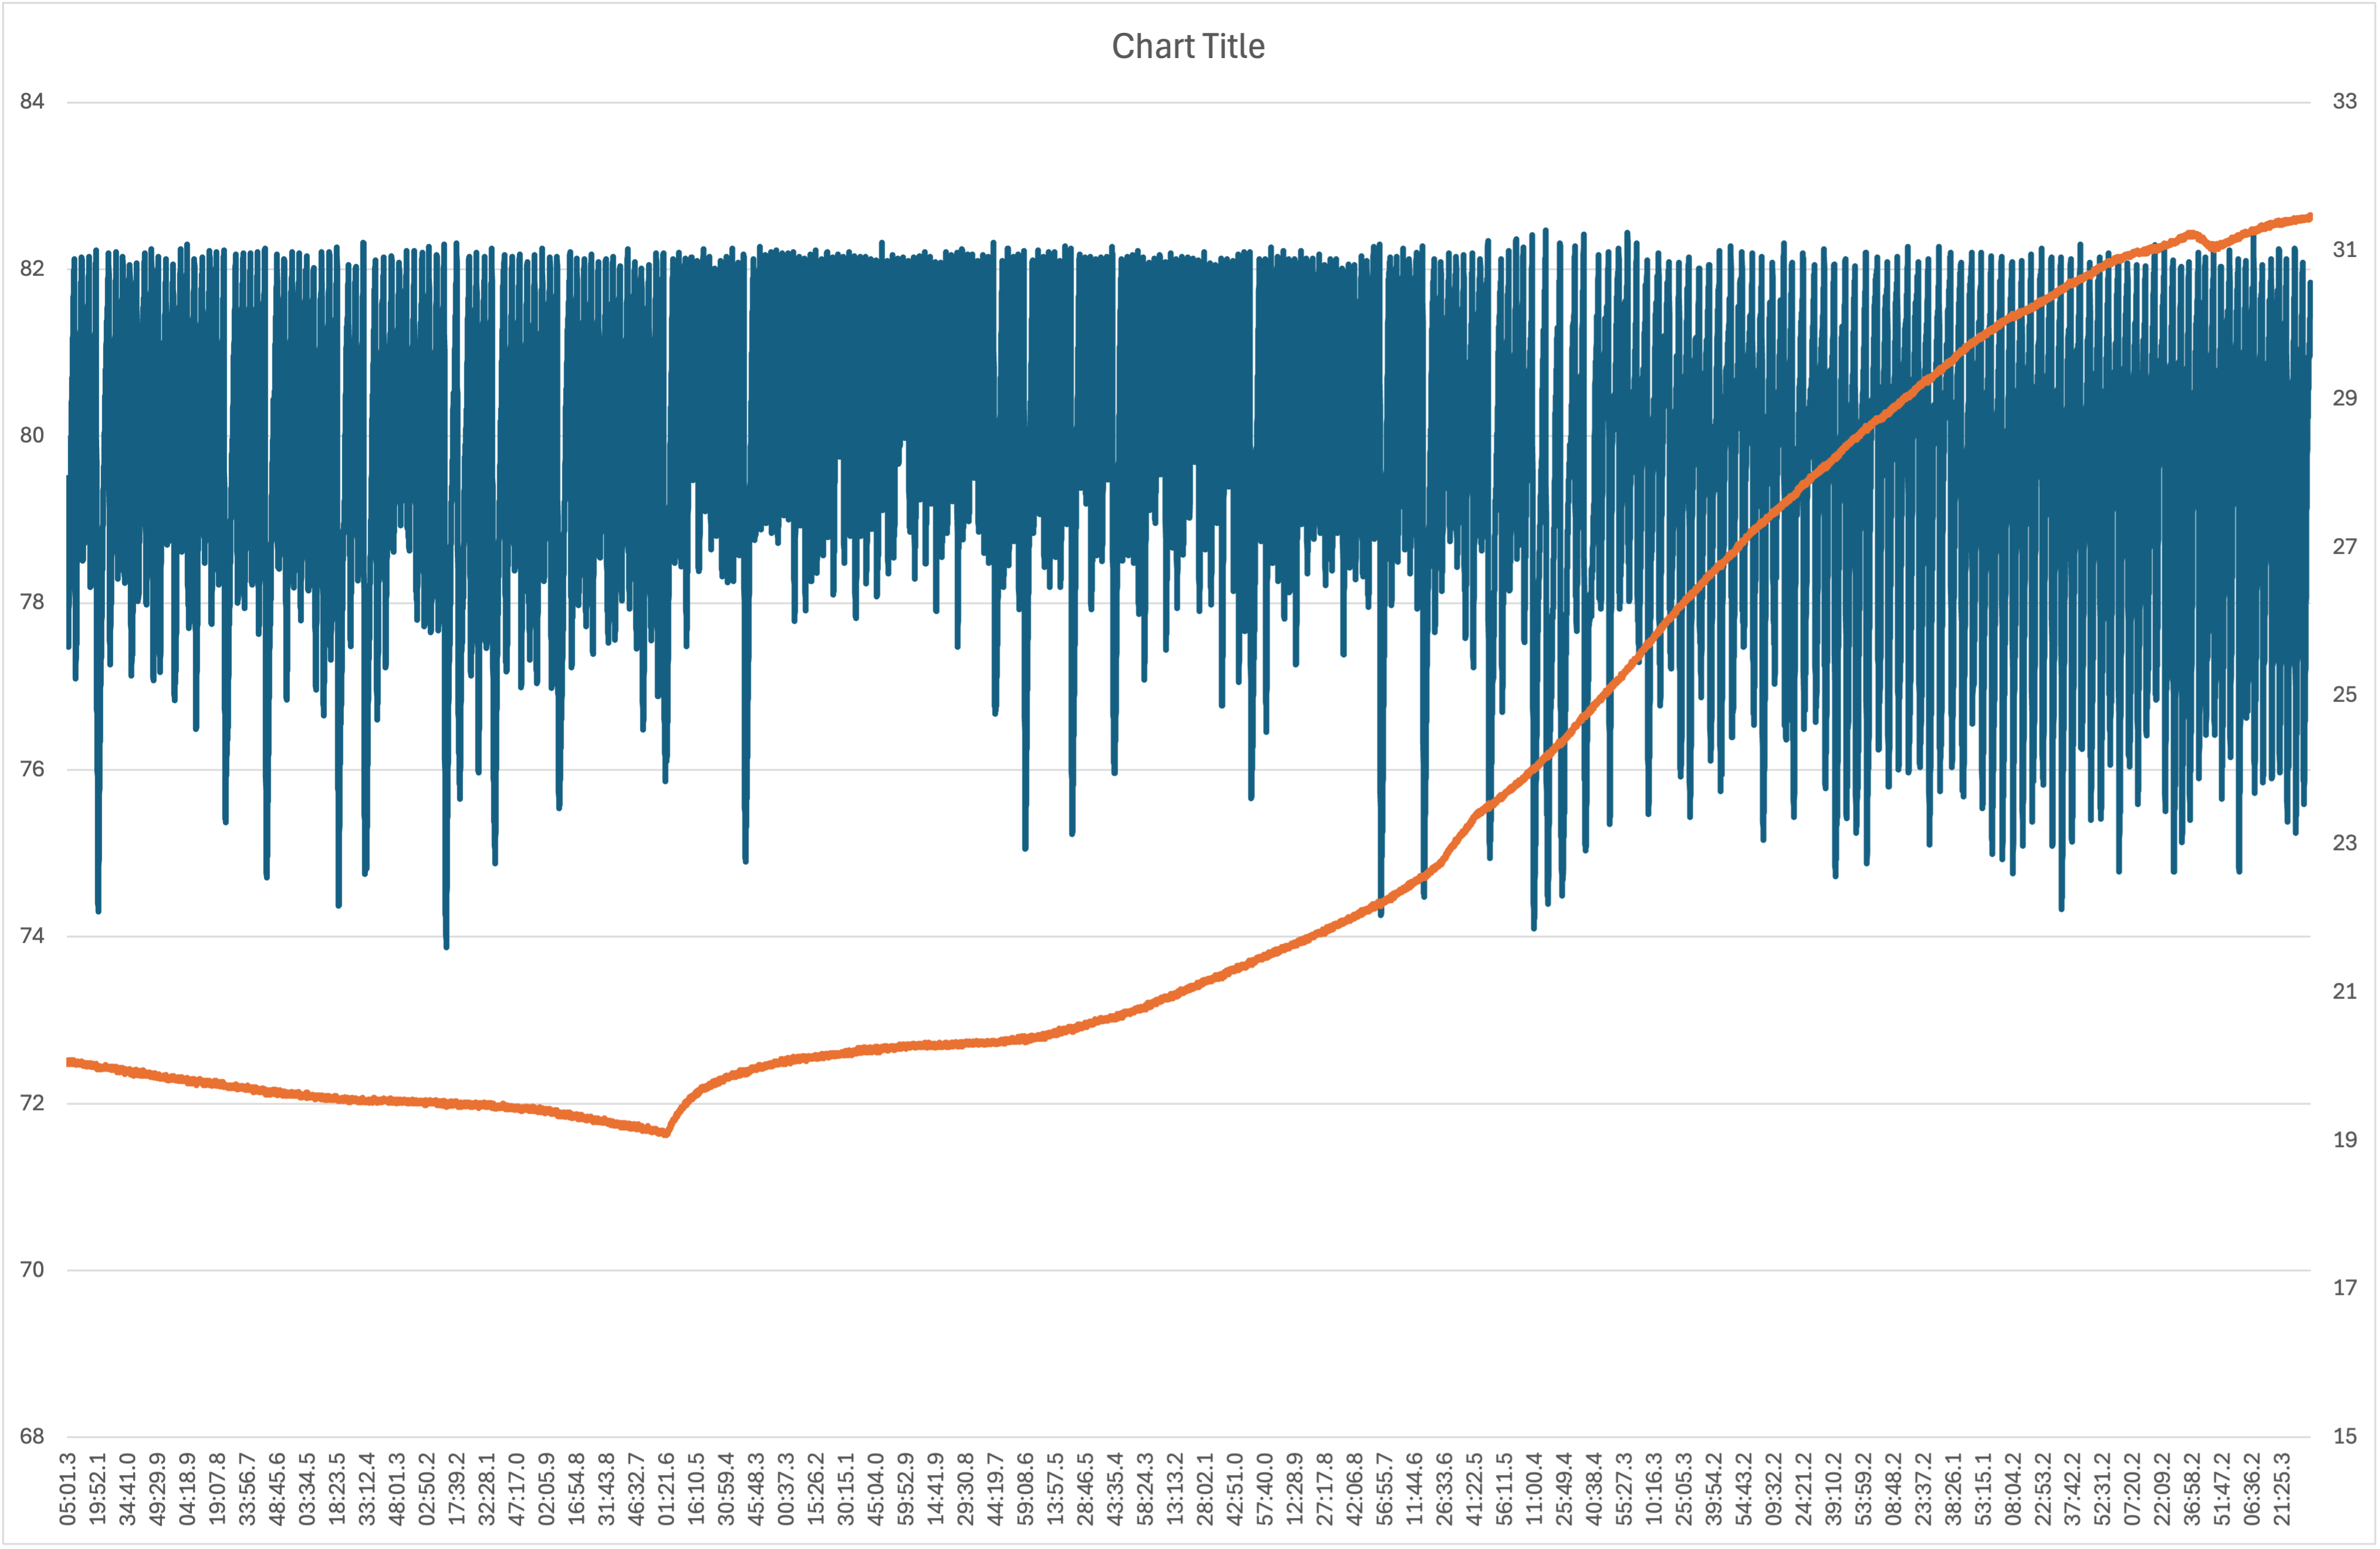
The average humidity in the graph is 79.34%, which is very good. It look a bit noisy but this is because of the scale of the graph (68-84%). The orange line is temperature.
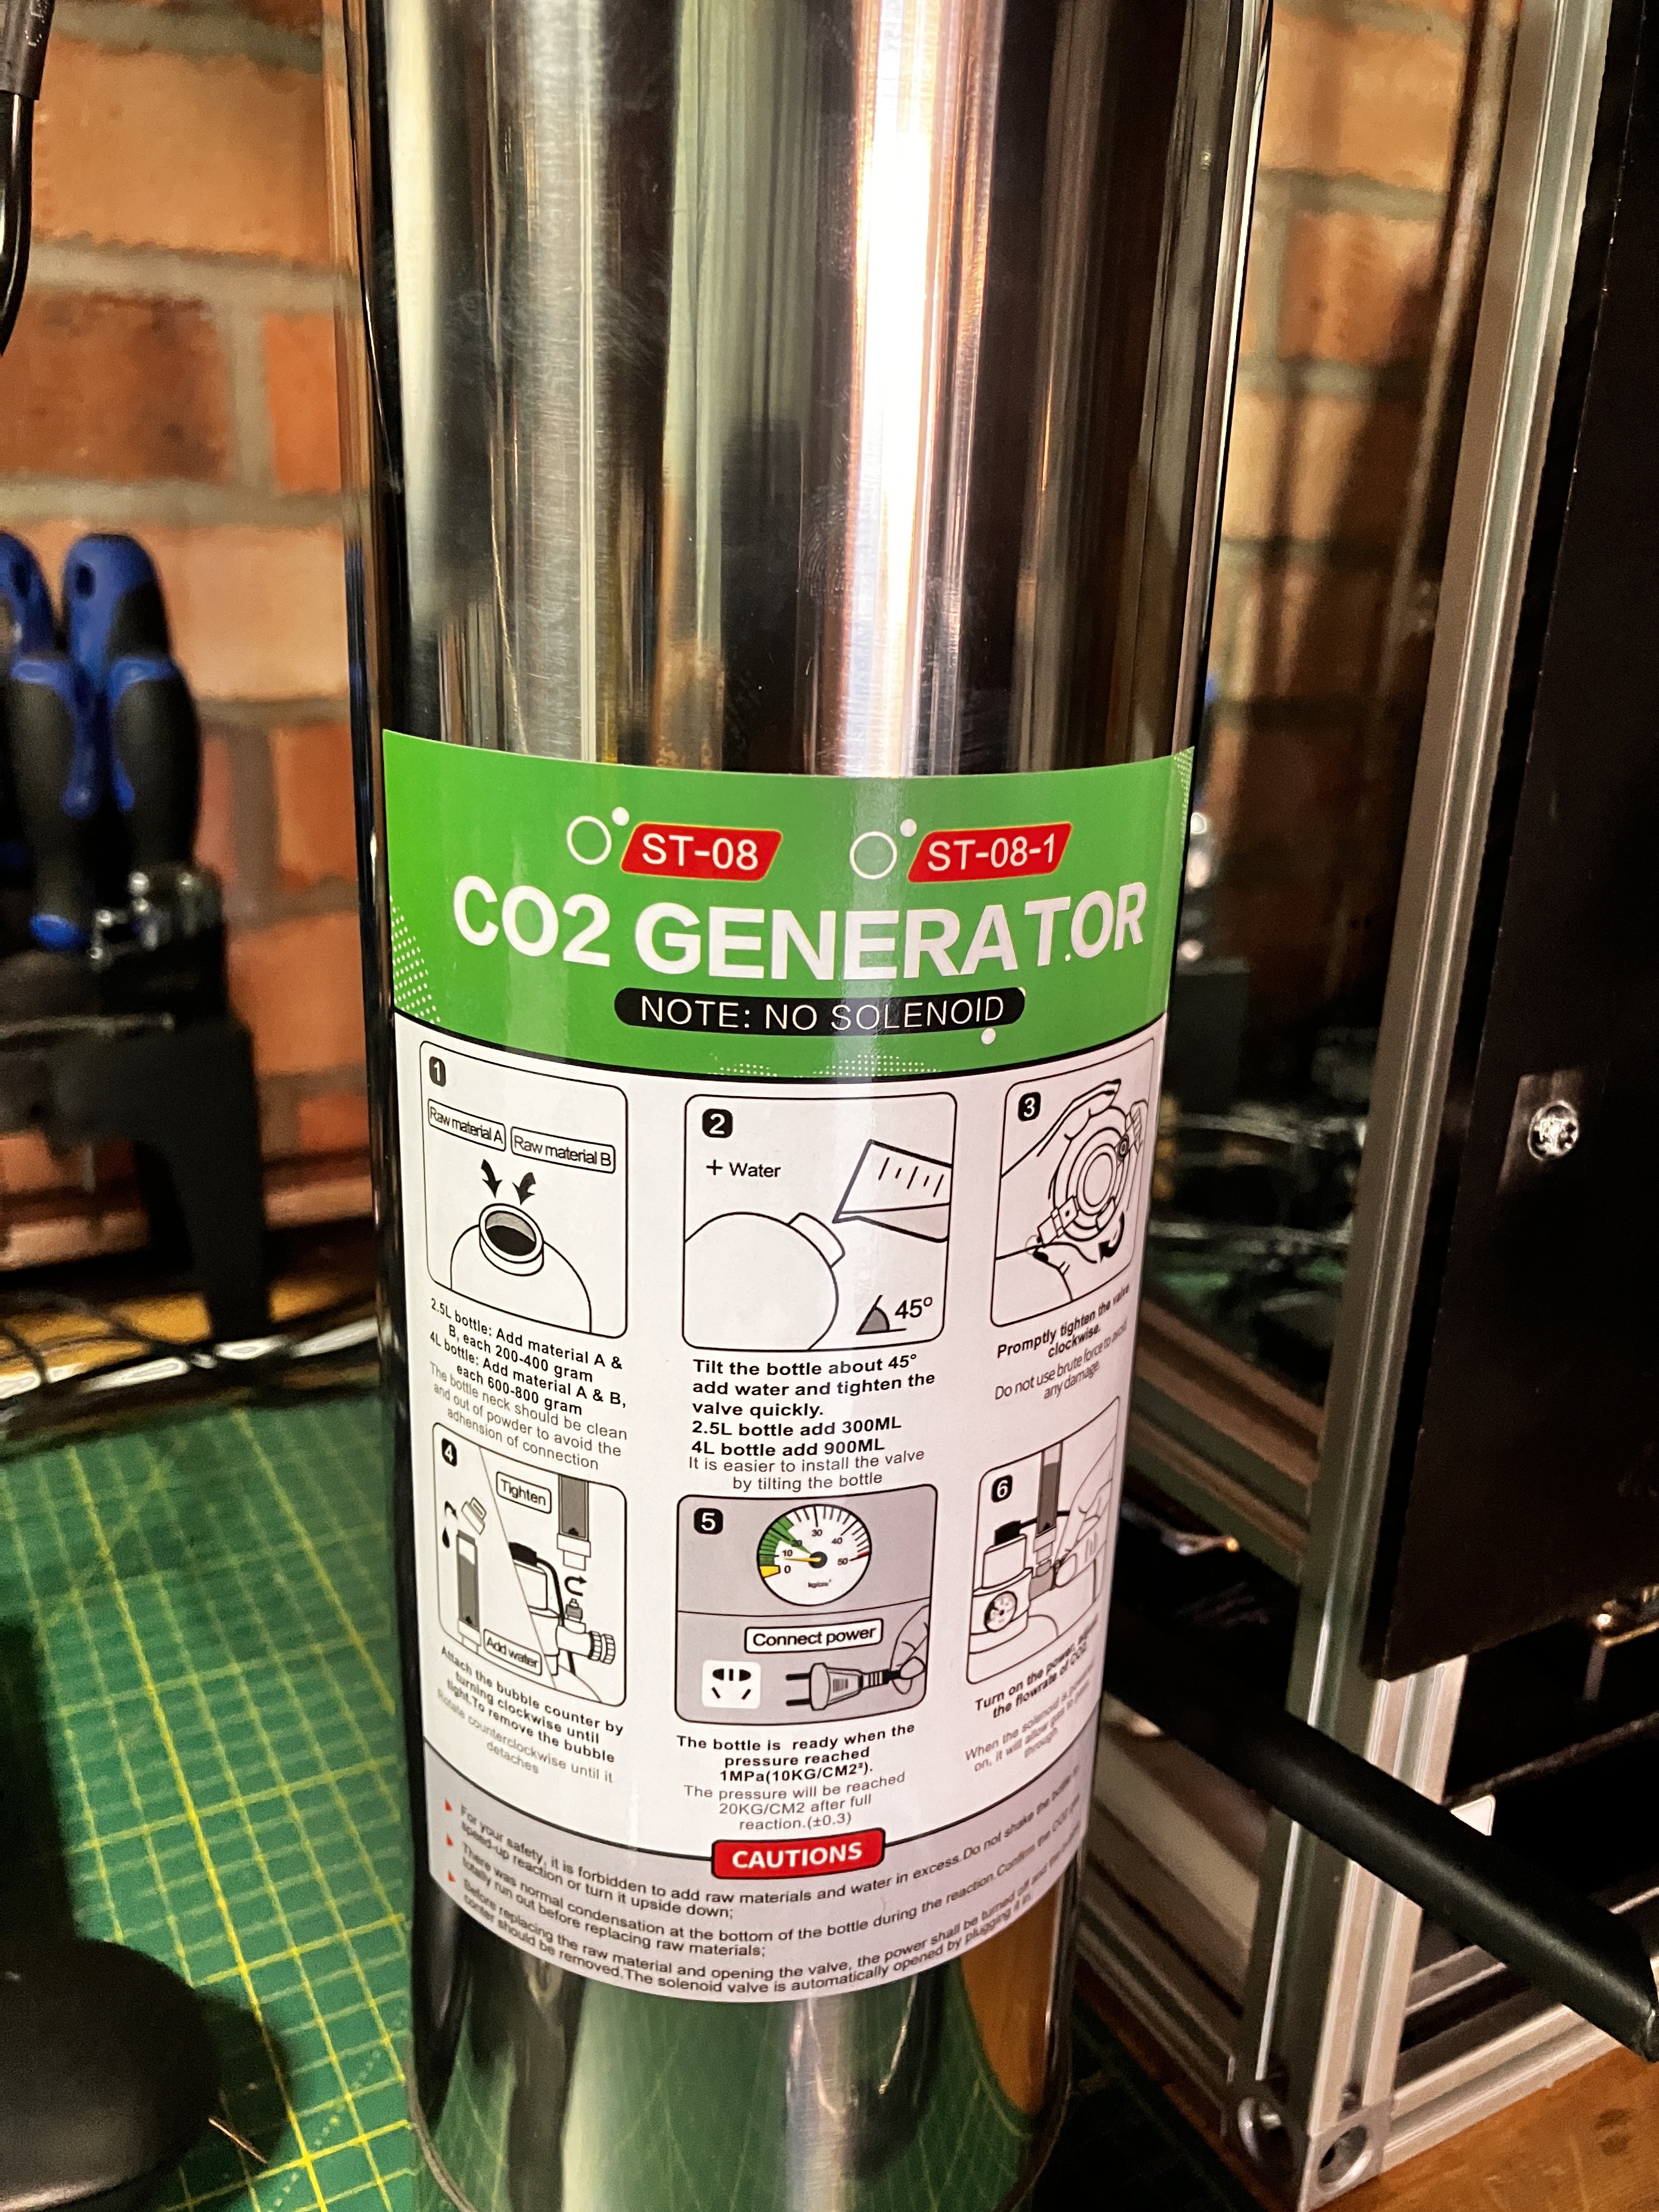
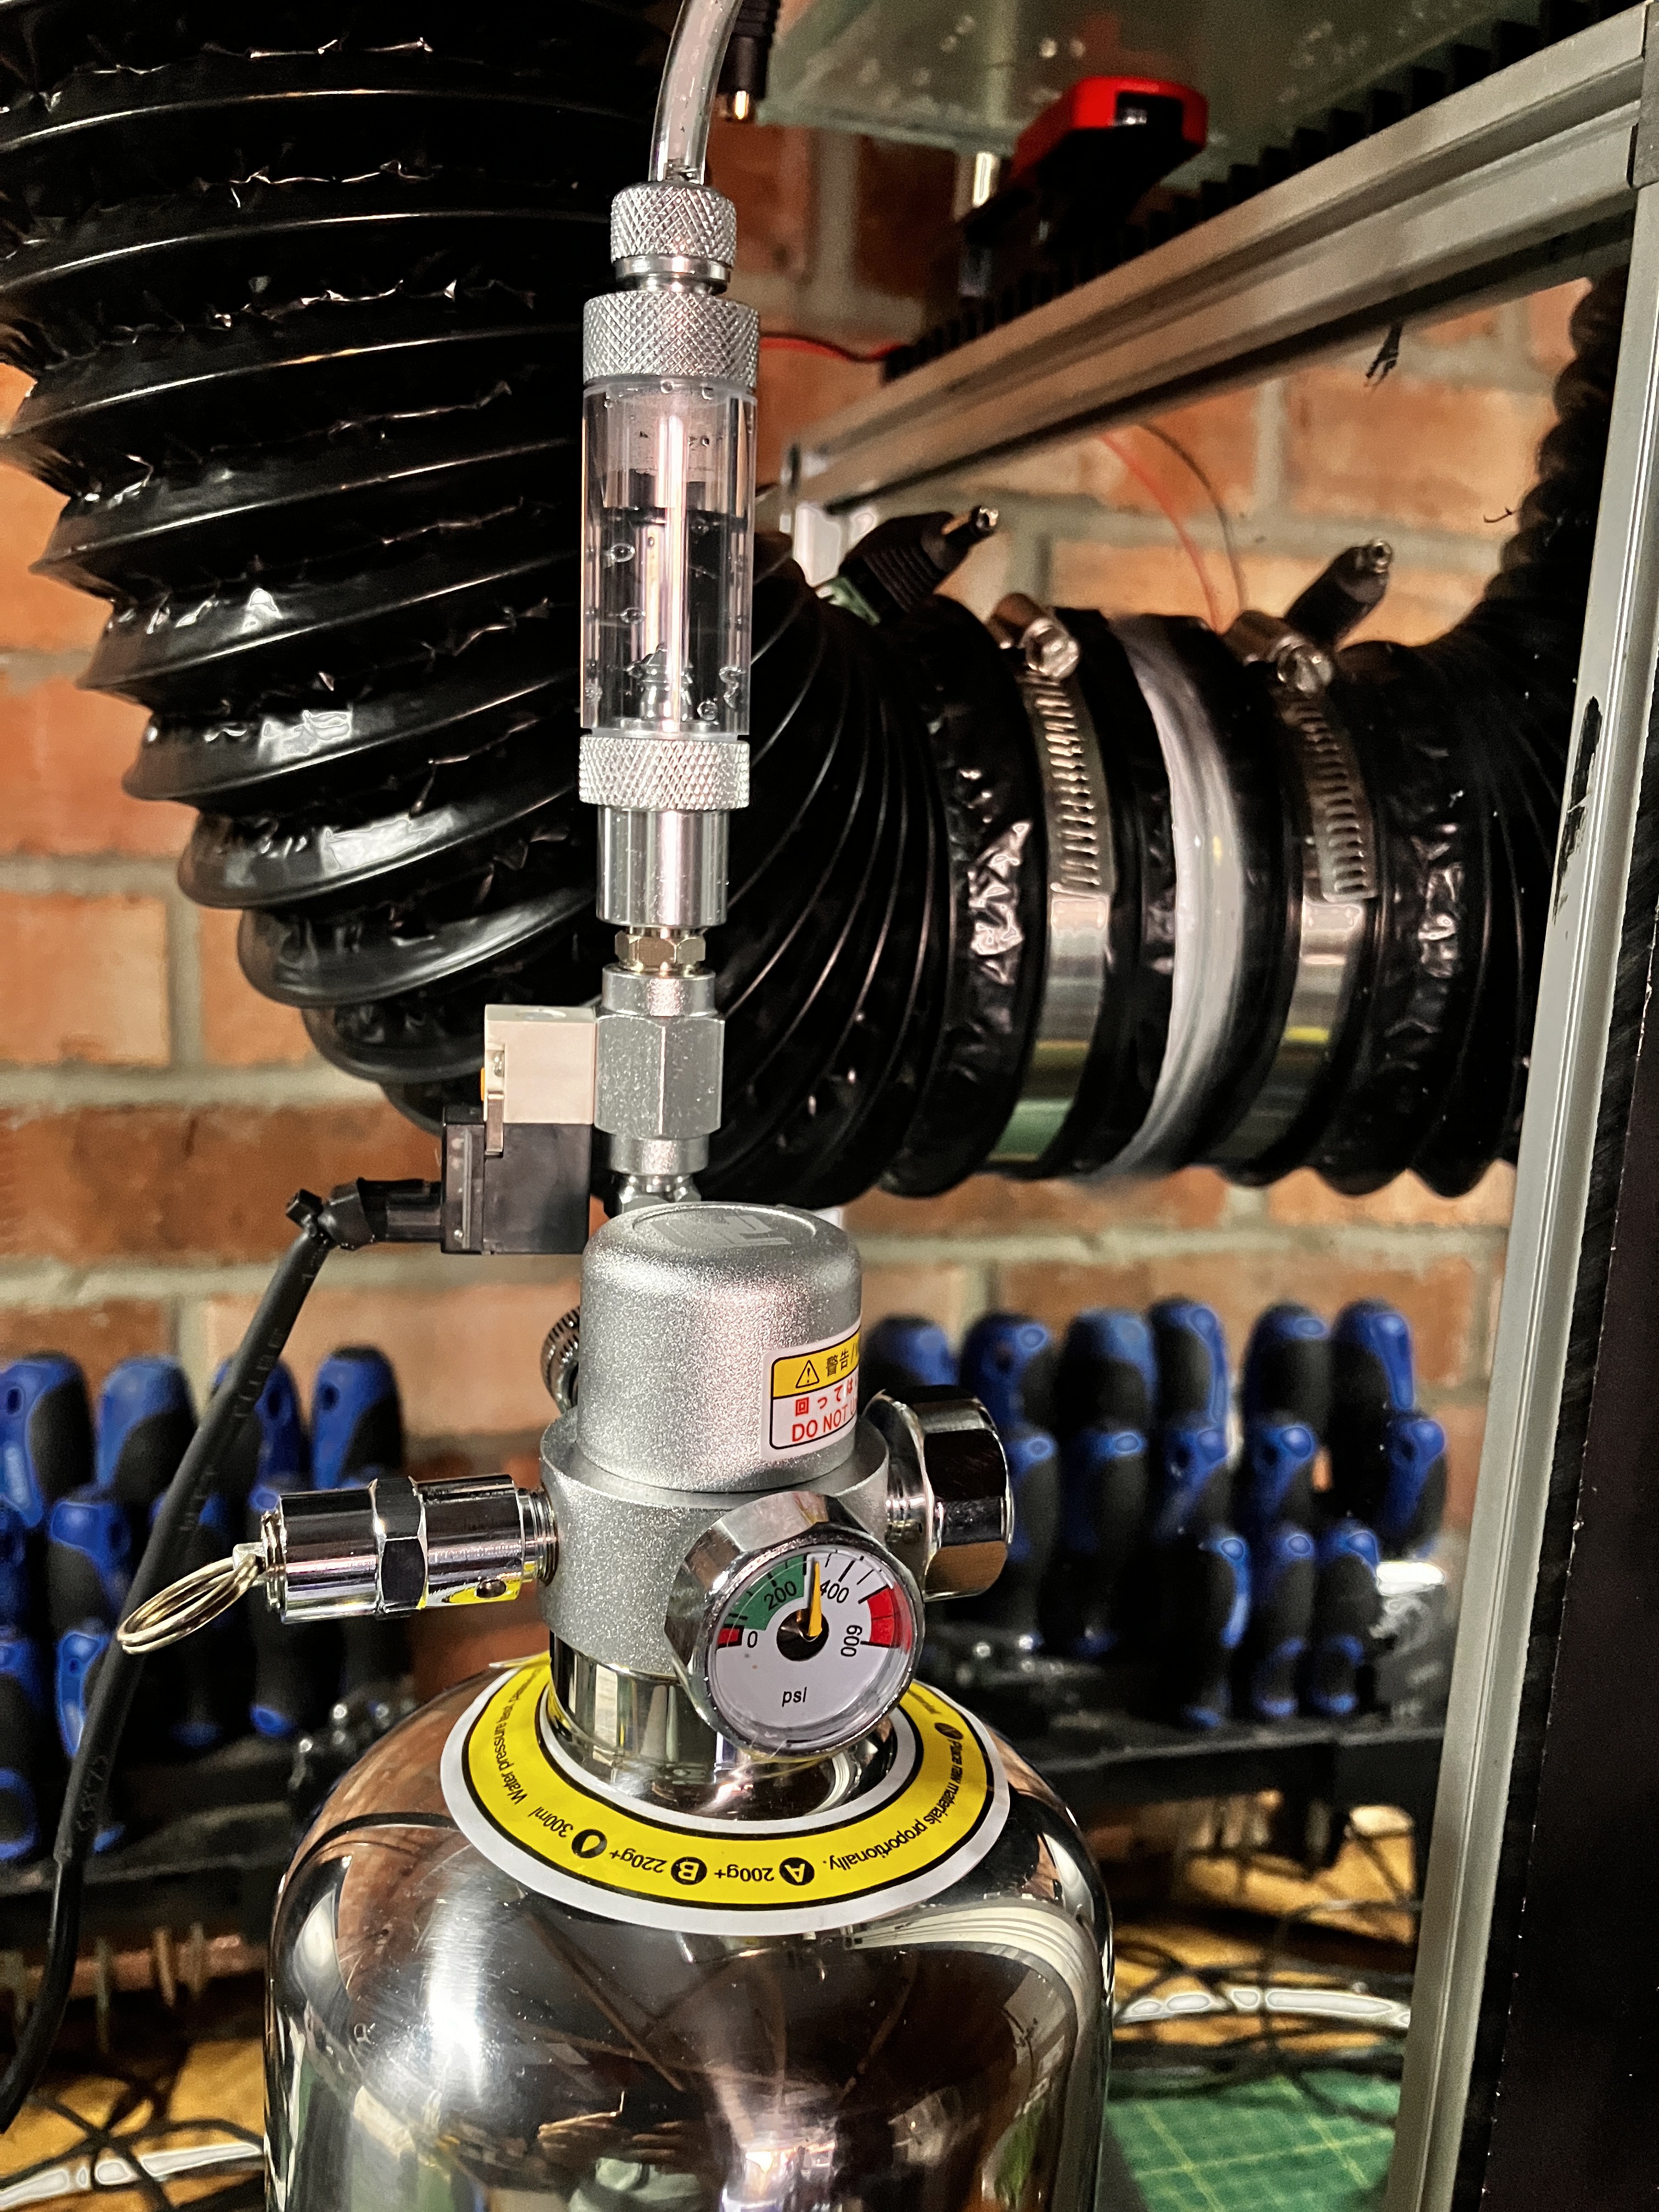
The second addition is a CO2 external tank which is connected to the dehumidifier box, next to the fan. Not a great idea since it takes some time to diffuse to the box, but I was avoiding drilling in the box itself. It takes some time to reach the box as such, particularly if the fan is not on, but it does the job. Some random data is shown in the following picture:
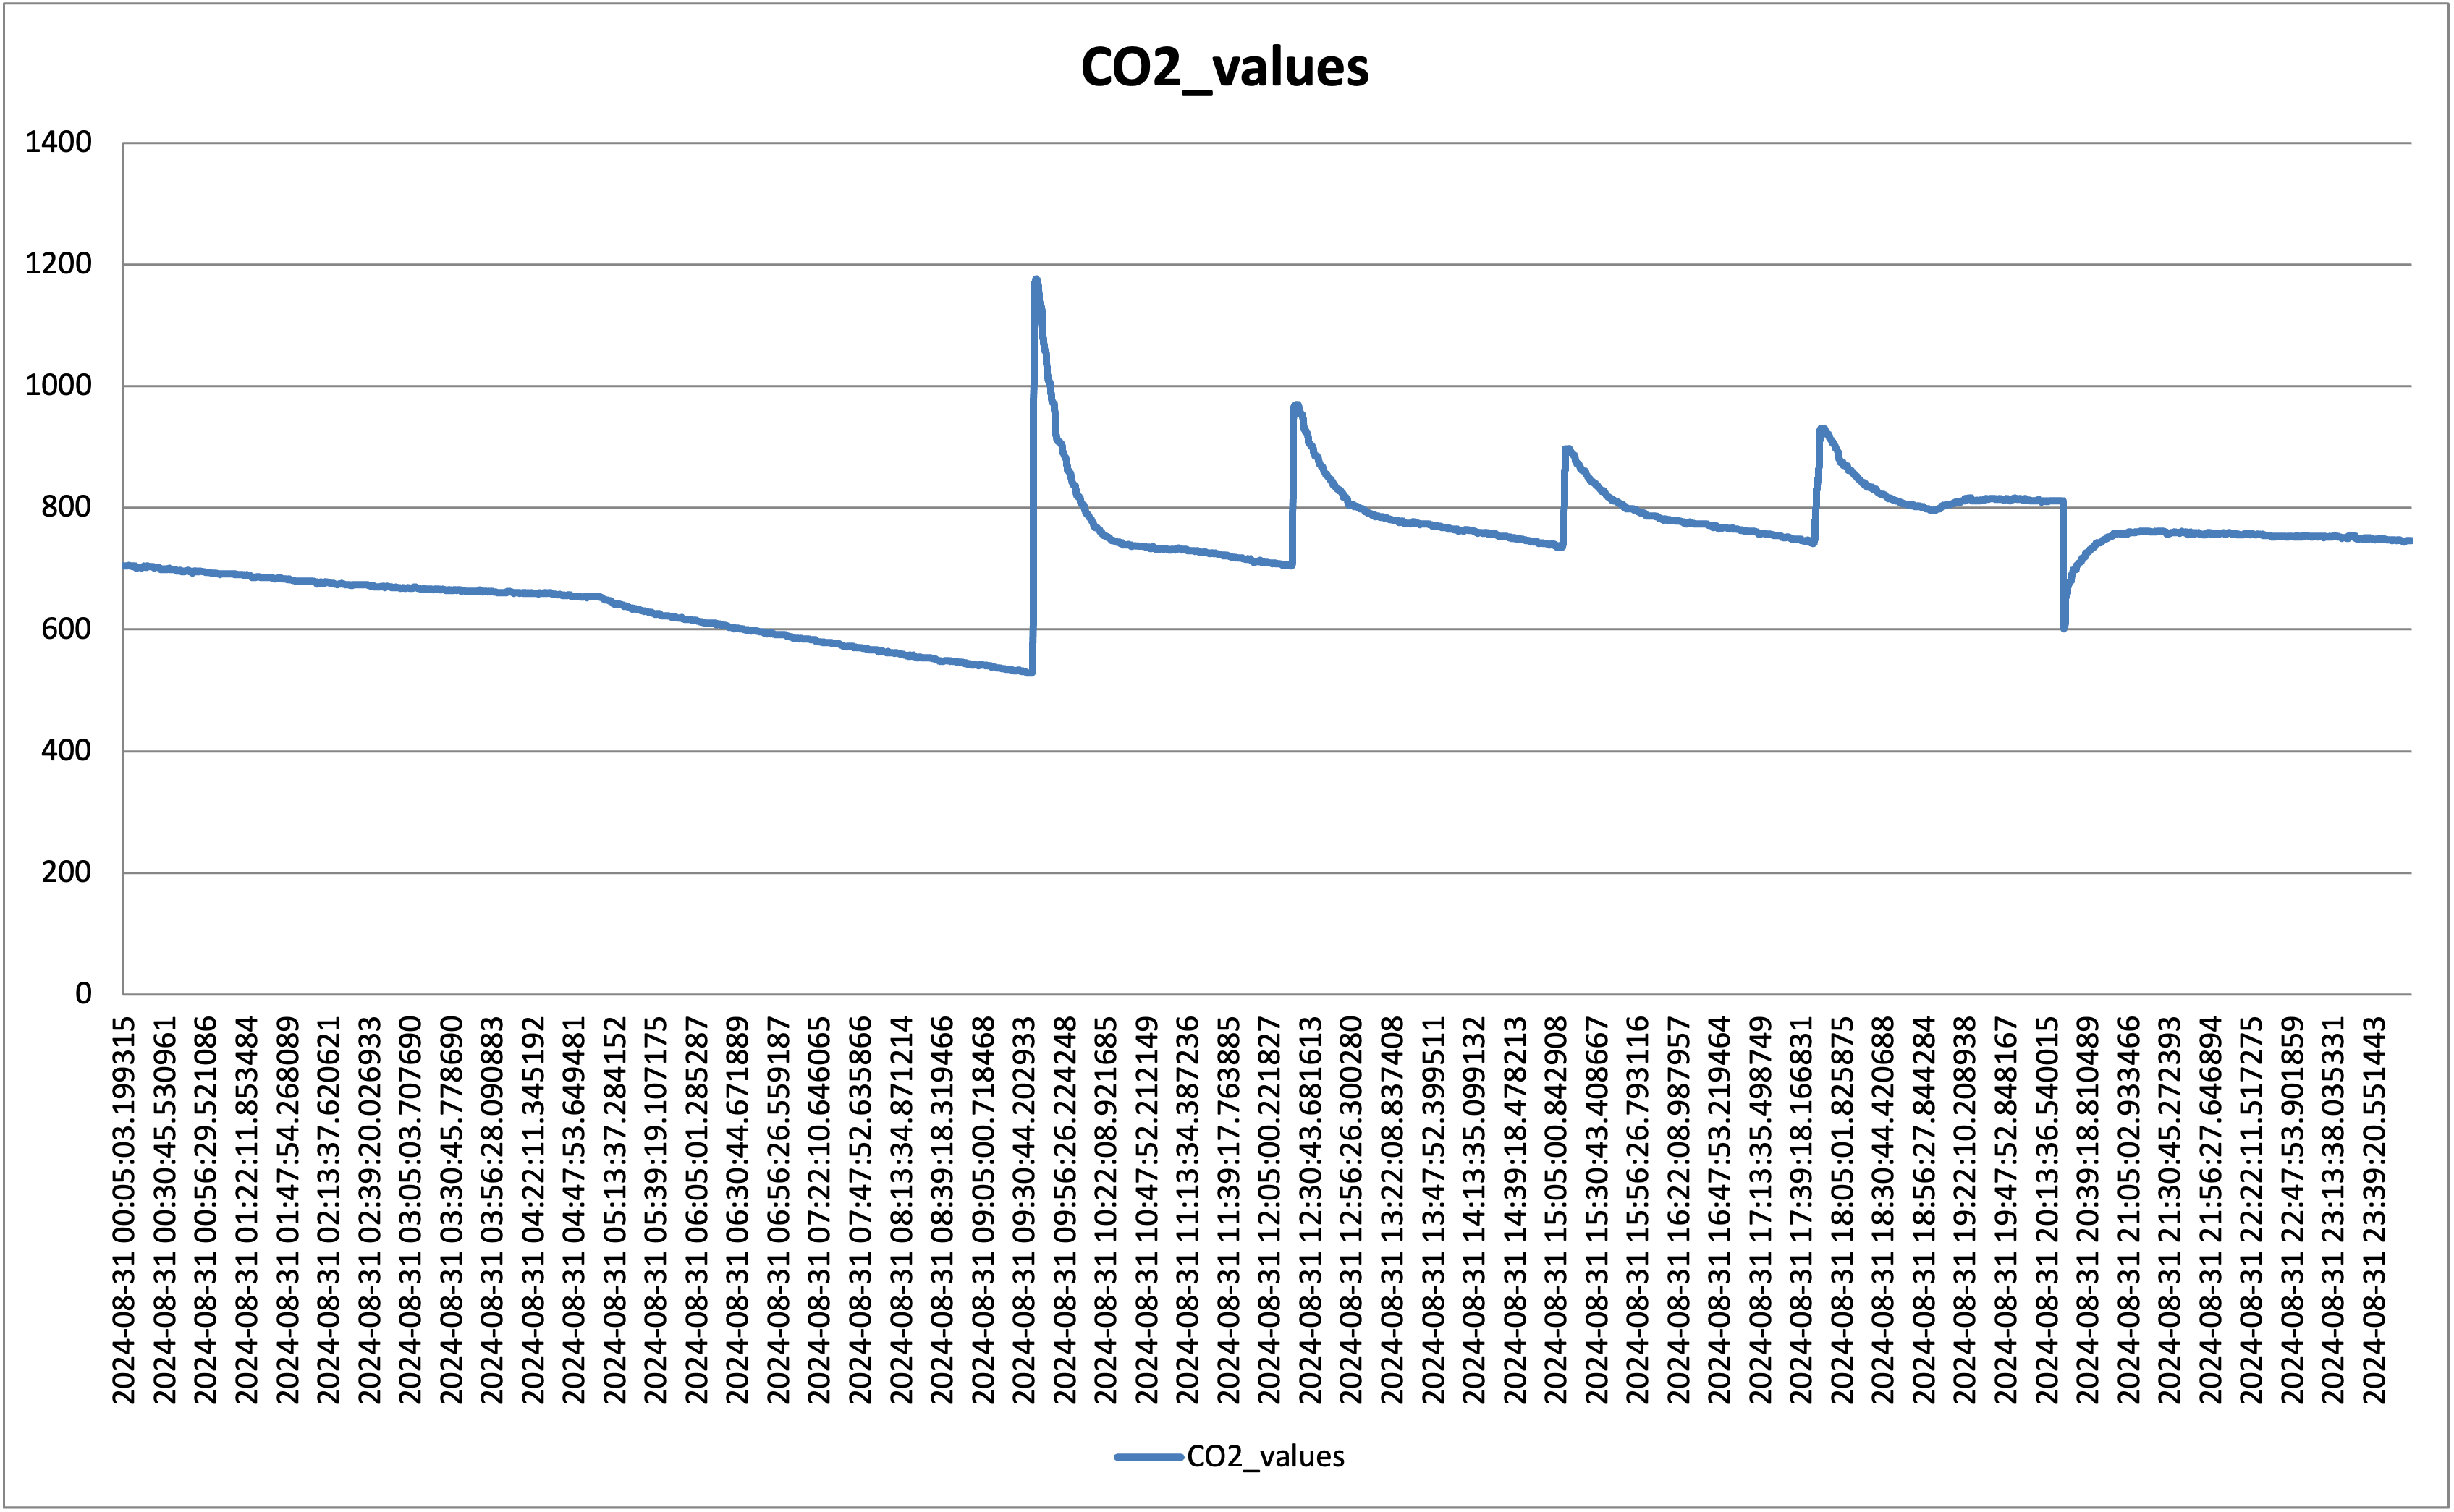
Peaks are random CO2 injection events. So far so good. I have noticed though that anything above 700 ppm would create a slow leak from the box (you can see the slow decline at the beginning of the graph); clearly, the box is not fully sealed, but below 600 ppm it holds as shown below:
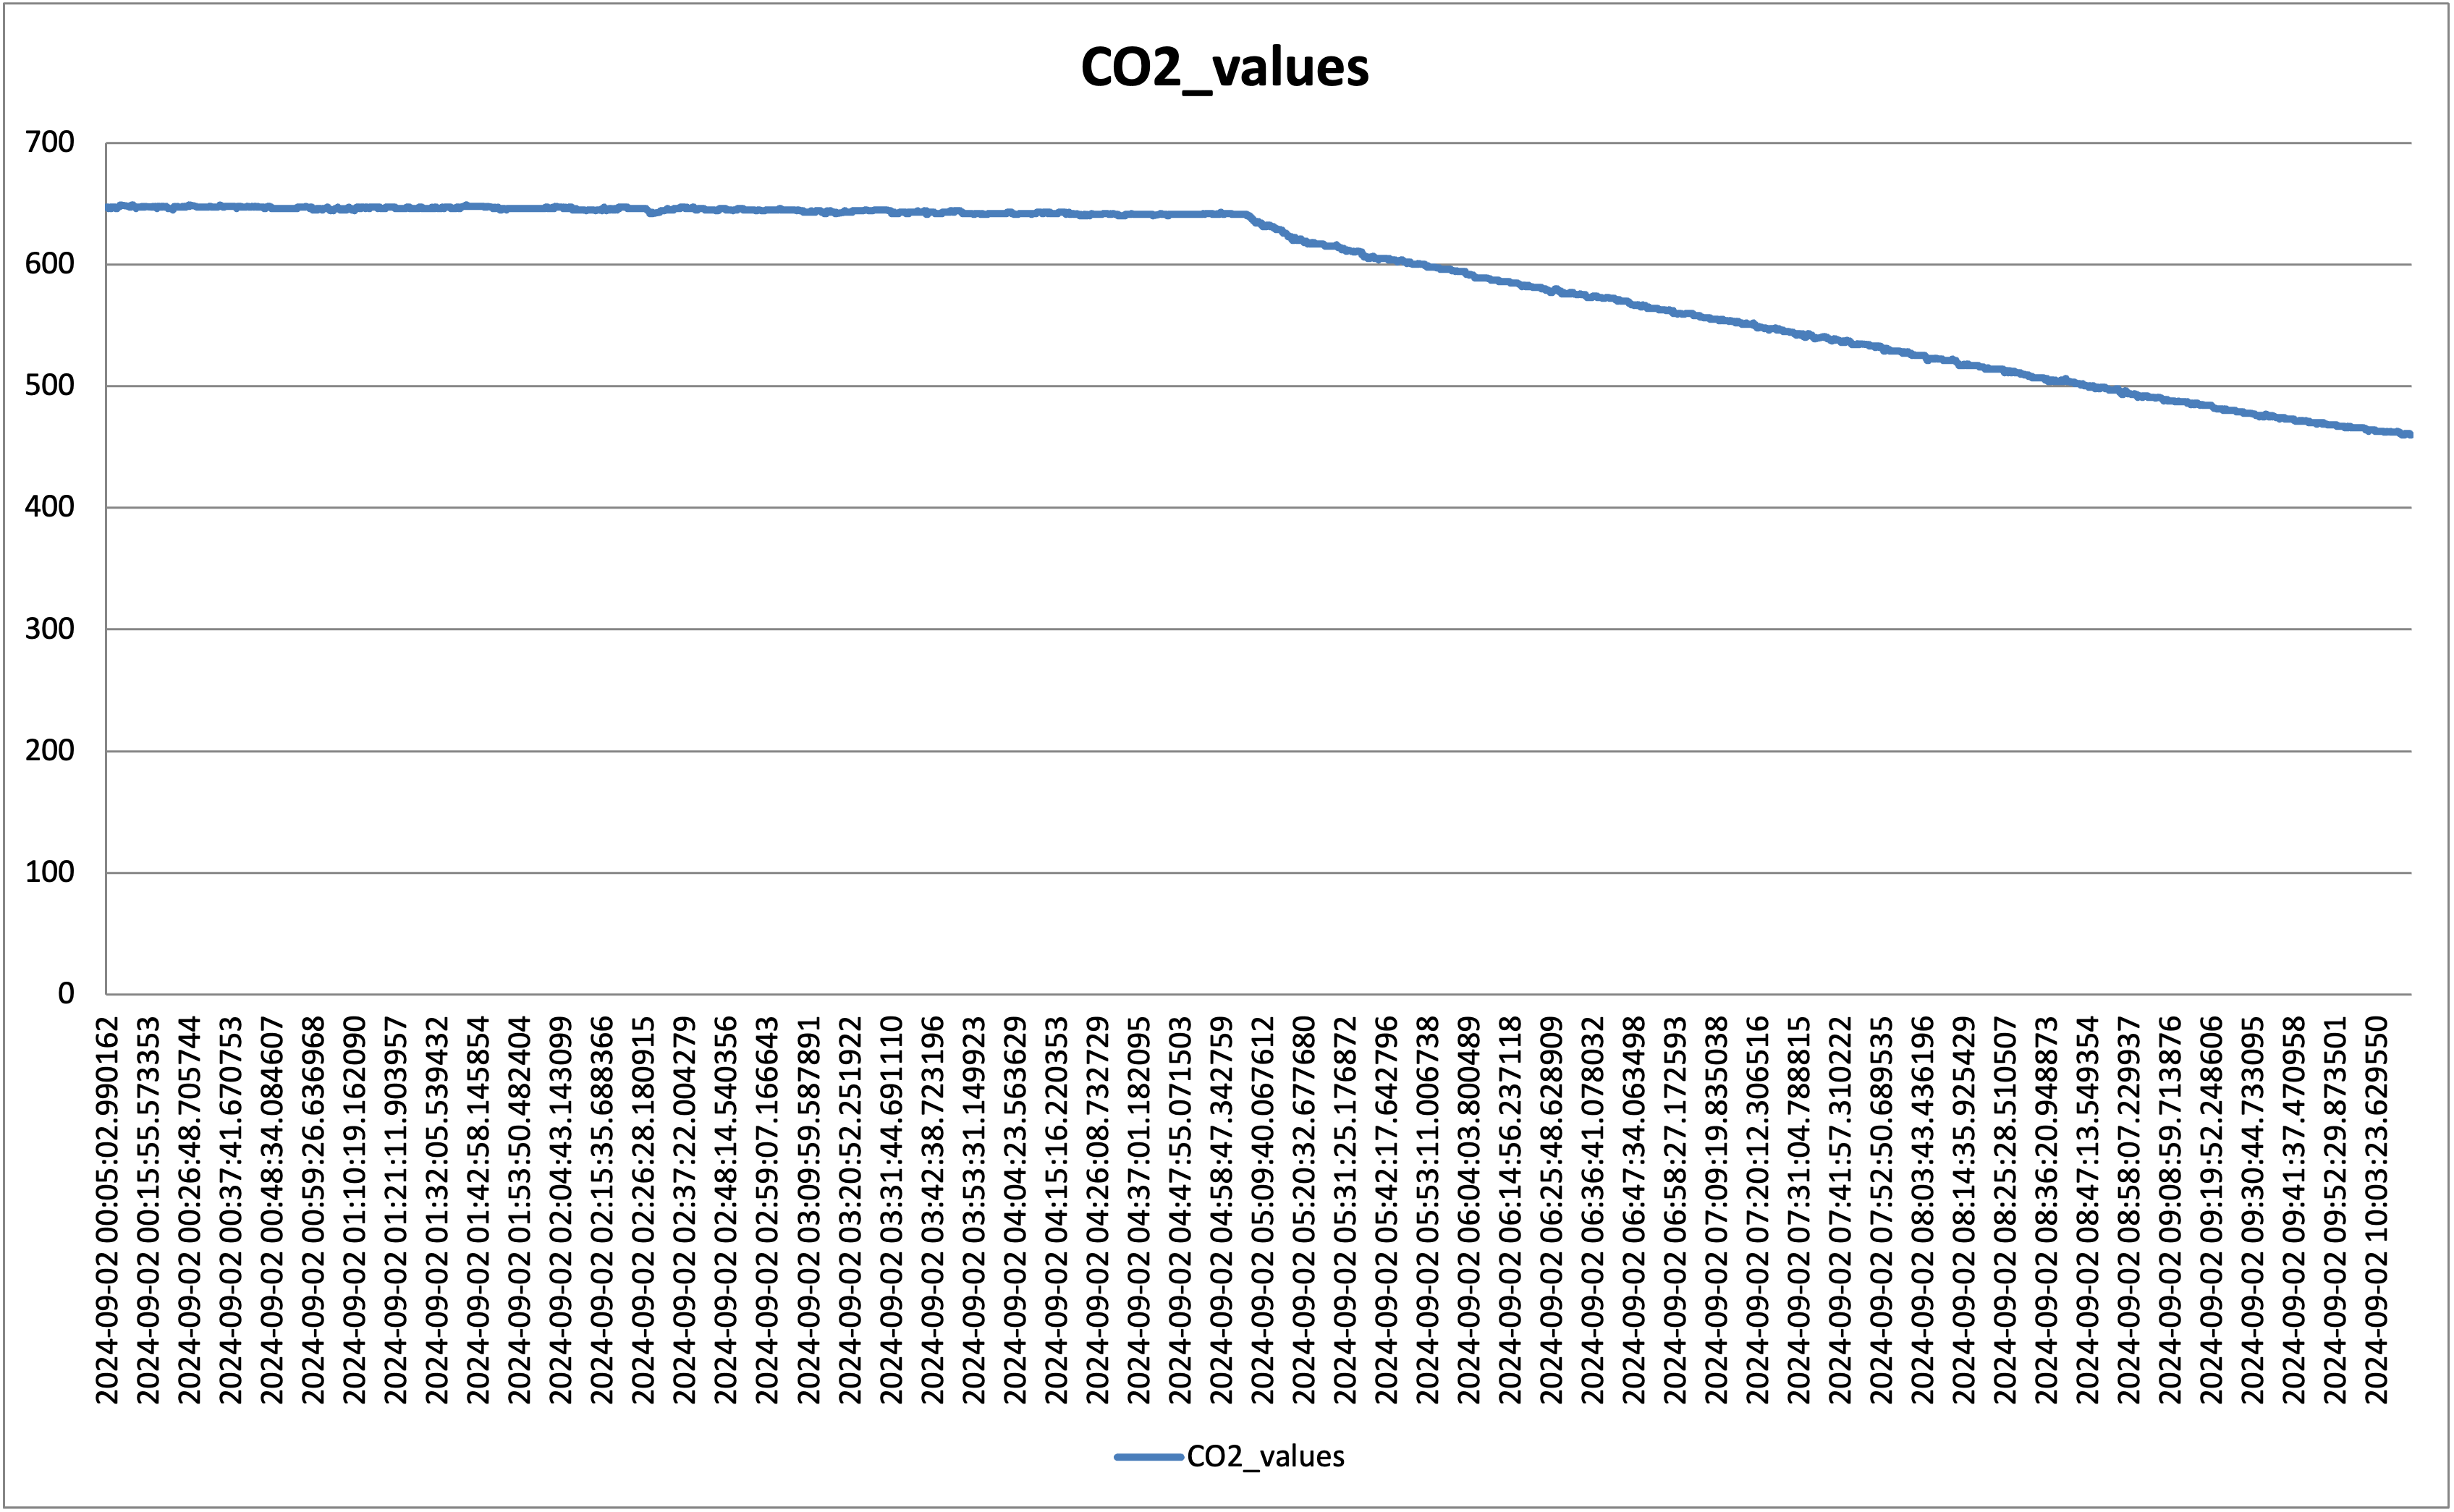
The steep decline in the graph above is due to the lights going on and the plants start the process of photosynthesis, swallowing as much CO2 as possible. Bear in mind that these are still small plants, the older and bigger they get, the steeper that line.
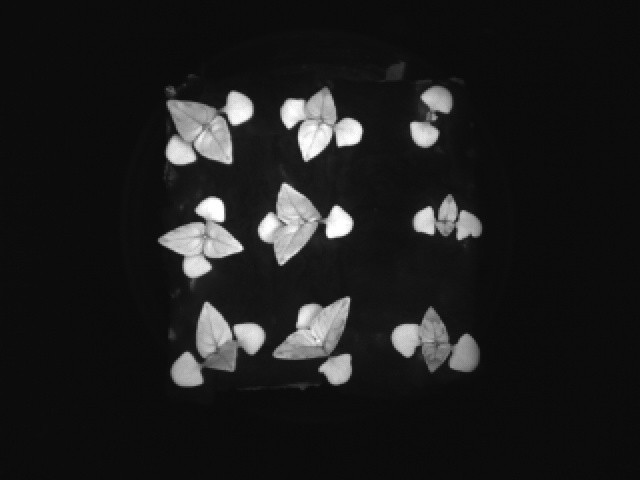
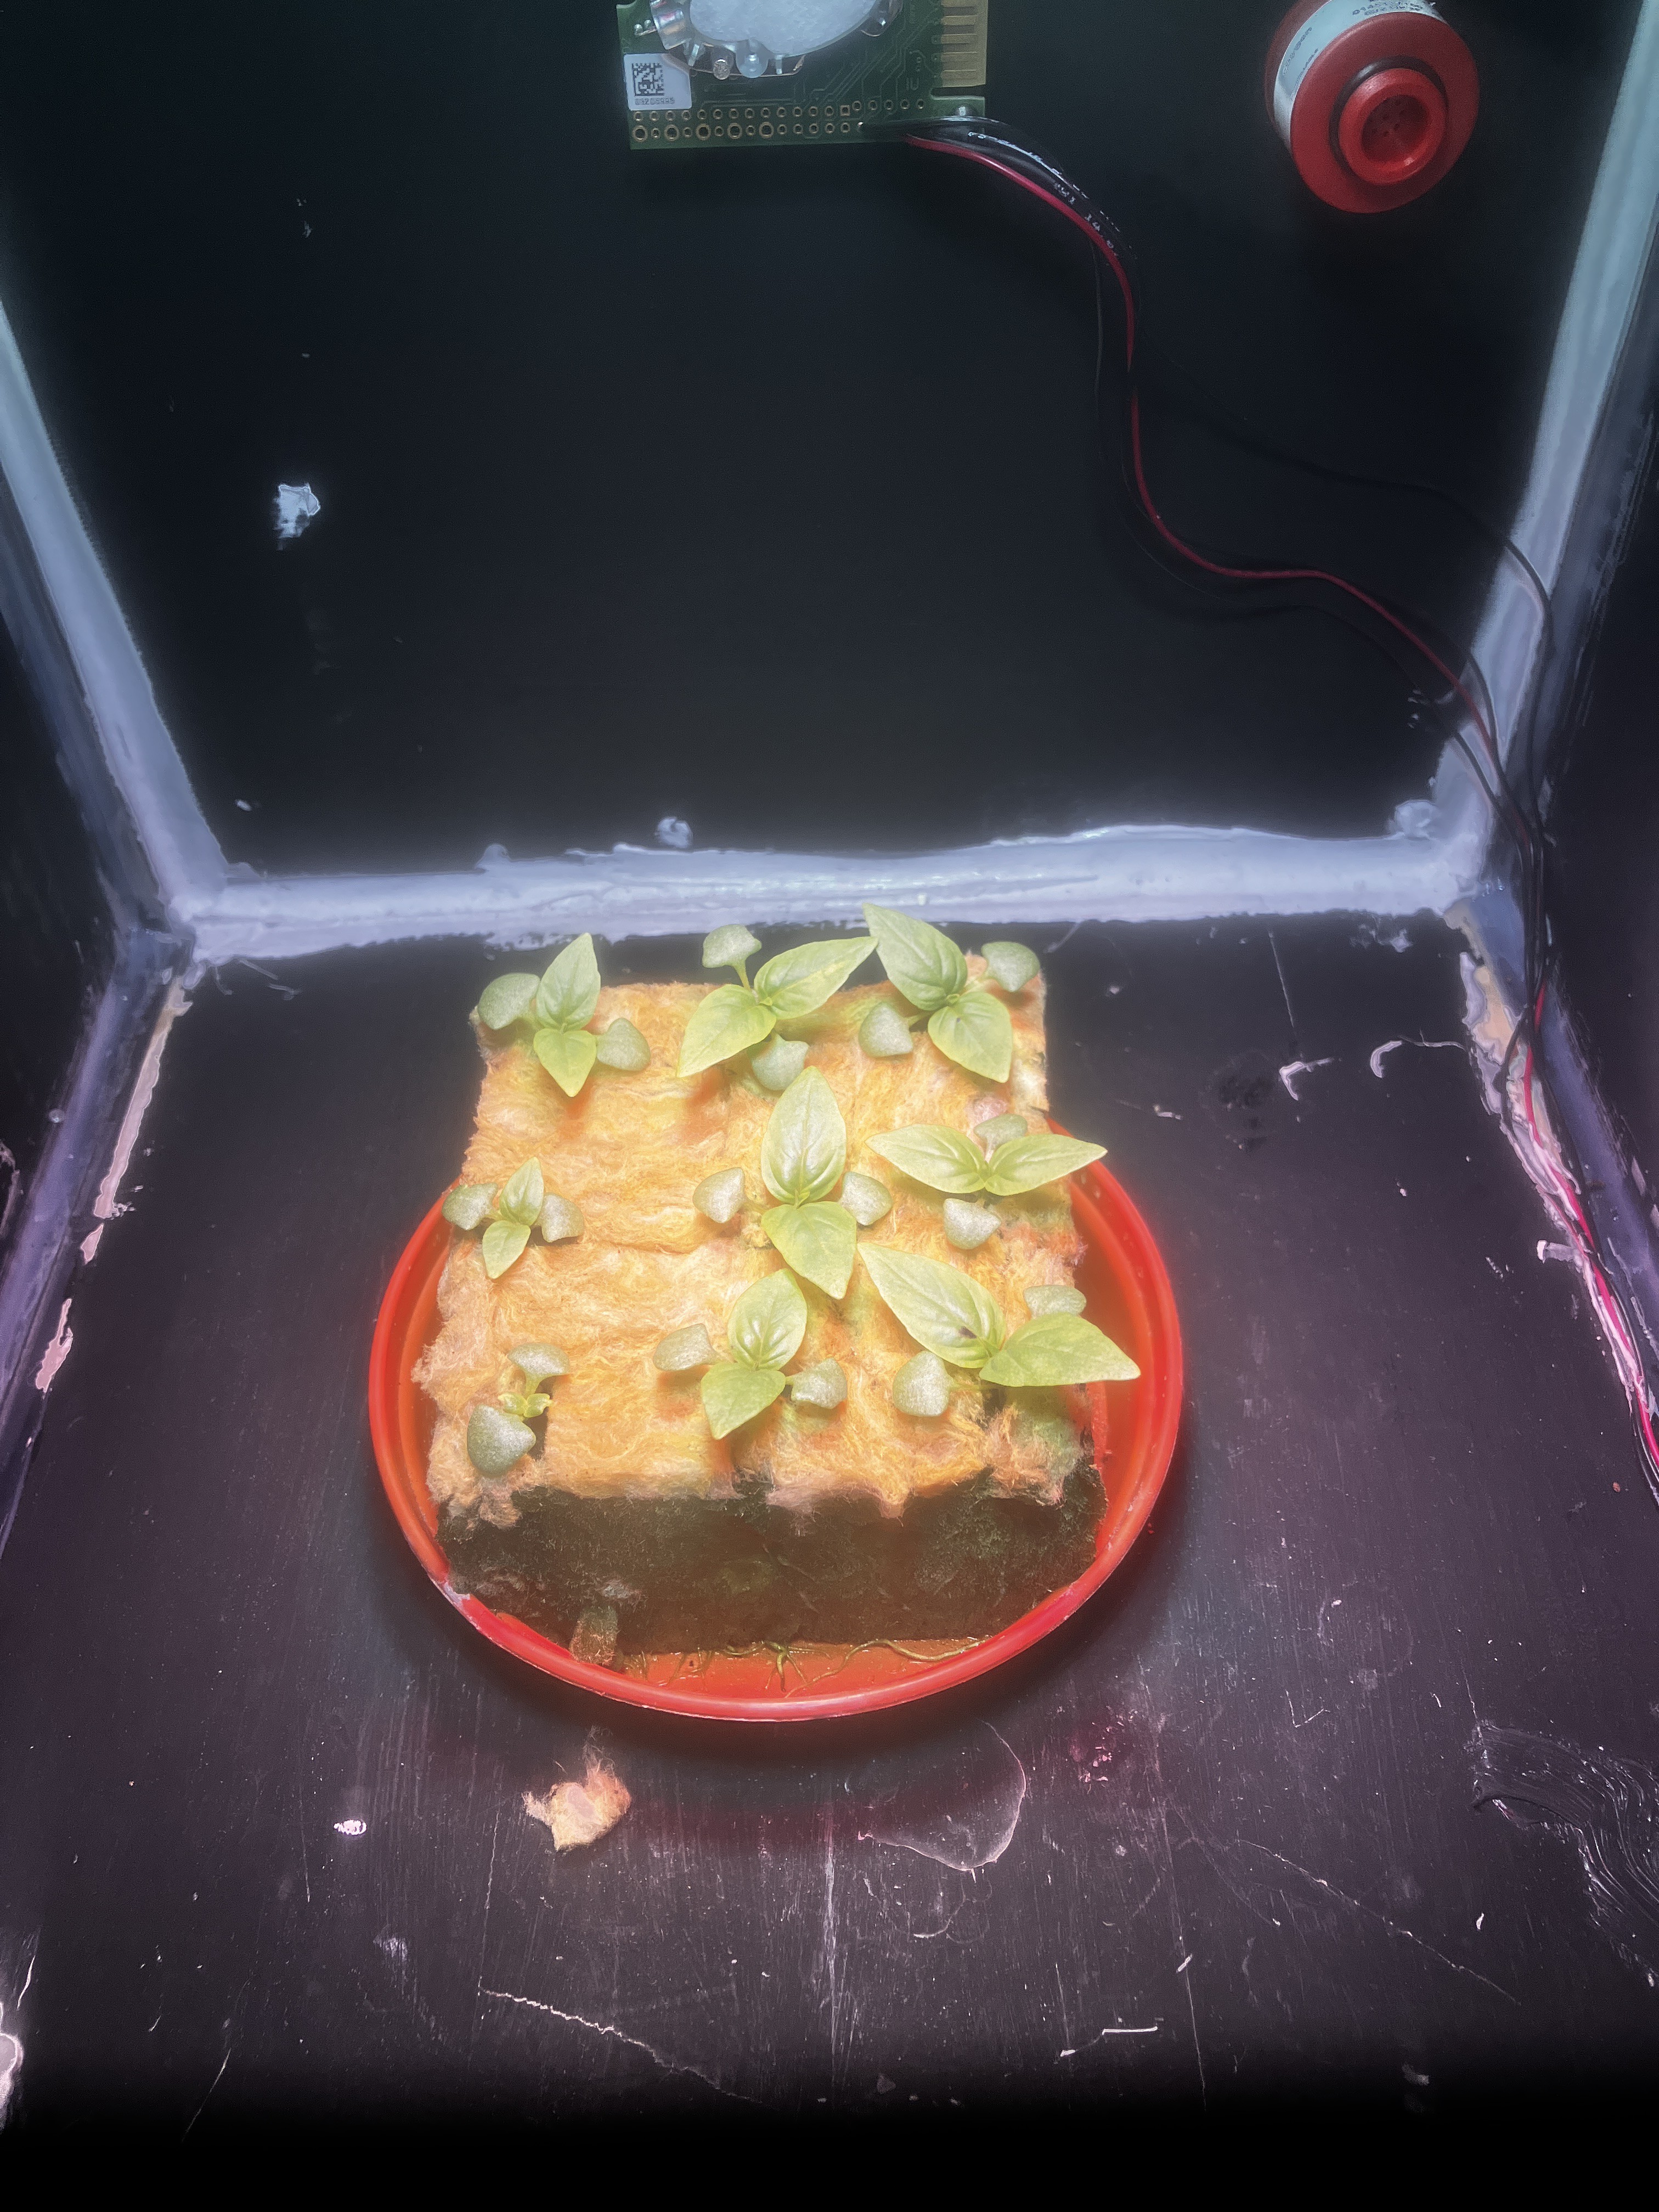
The 10 days old thai basil plants as of publication. Another picture from the little window:
Now winter is coming so I need to create a separate box to control the temperature, attached the CO2 solenoid valve to a relay controlled by the Arduino monitoring the CO2, and possibly run the thermal camera from an external raspberry pi or similar to get leaf temperature readings. I may also need som EC data from the rockwool cube holding the plants to see if there are any significant variations. More on this on my next update which, hopefully will come live around October.
Discussions
Become a Hackaday.io Member
Create an account to leave a comment. Already have an account? Log In.