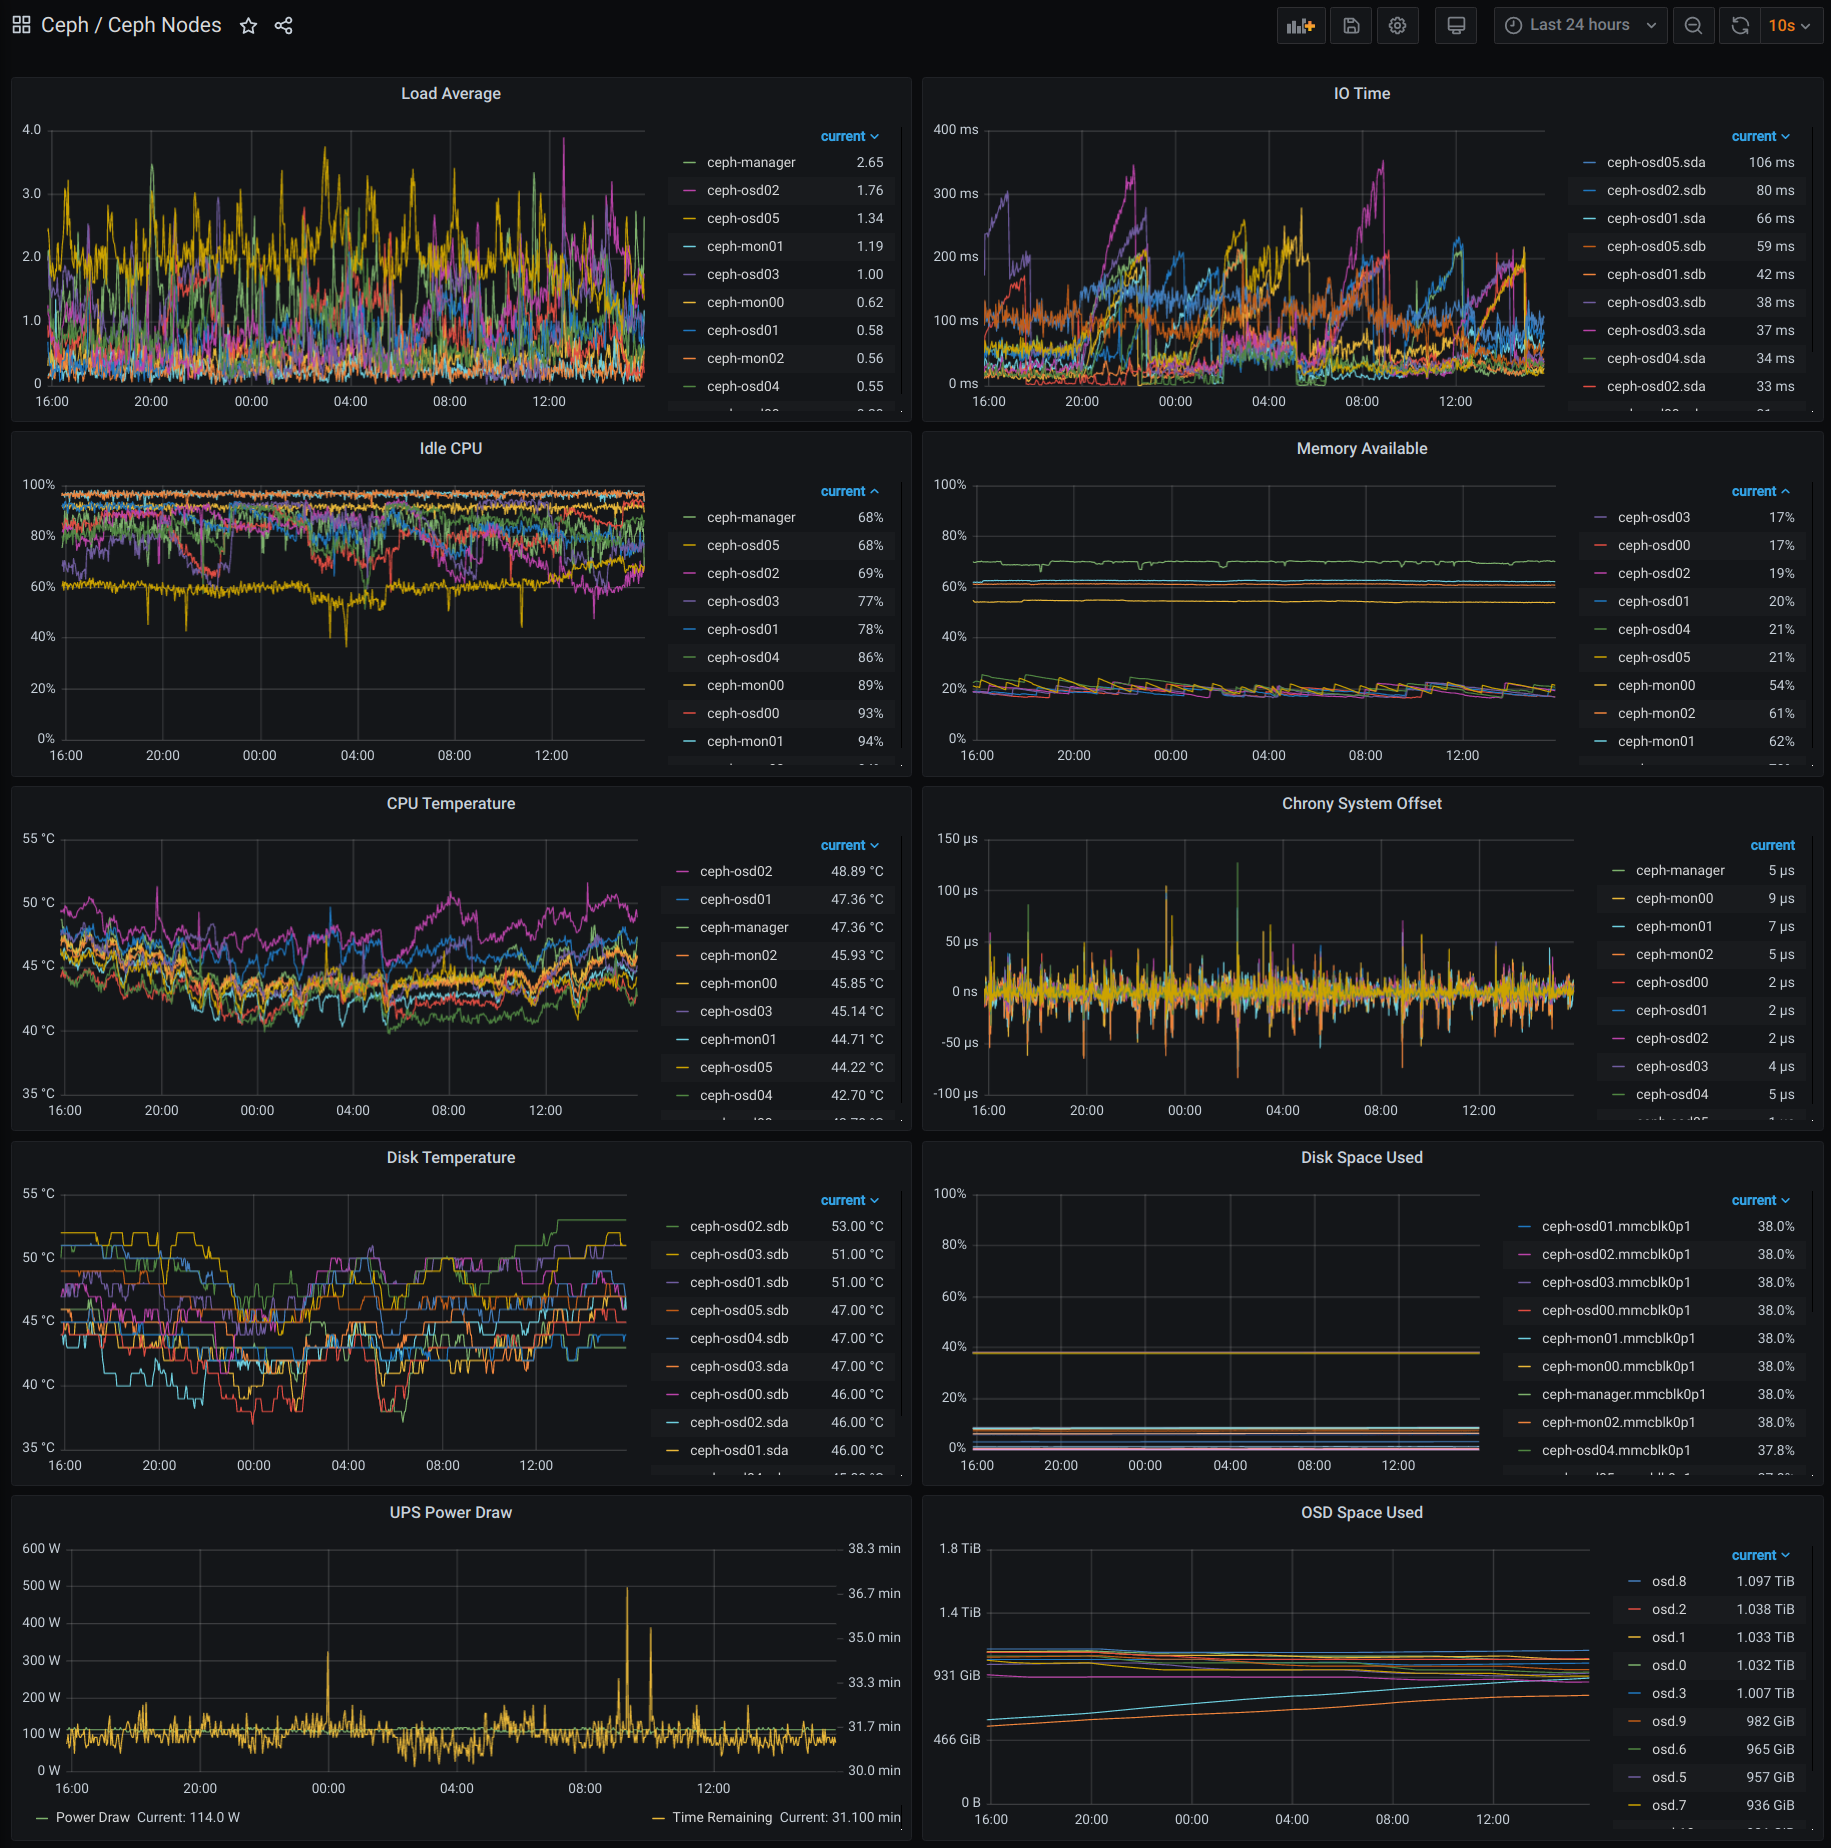
I added a dashboard to my grafana server to show the telegraf data from the ceph cluster. You can see the disk io and cpu load from the cluster rebalancing from 10 osds to 12 osds.

A project log for Raspberry Pi Ceph Cluster
A Raspberry Pi Ceph Cluster using 2TB USB drives.
I added a dashboard to my grafana server to show the telegraf data from the ceph cluster. You can see the disk io and cpu load from the cluster rebalancing from 10 osds to 12 osds.
Discussions
Become a Hackaday.io Member
Create an account to leave a comment. Already have an account? Log In.