tl;dr
Intro
Recently, I grabbed an IMU and was looking around for some tools I could use to log and visualize data. I saw some YouTube videos where people showed off their IMU code by rotating a simple cube on their PC with data being sent through a serial port. I was soon disappointed to find no generic tool I could use to visualize and capture various data returned by an IMU.
So with this project, I went on (initially) a month-long break from IMU to put together a comprehensive tool for capturing, visualizing, logging and manipulating generic sensor data. Its application, although tailored to IMU, can be widen to other types of sensors and sources of real-time numerical data.
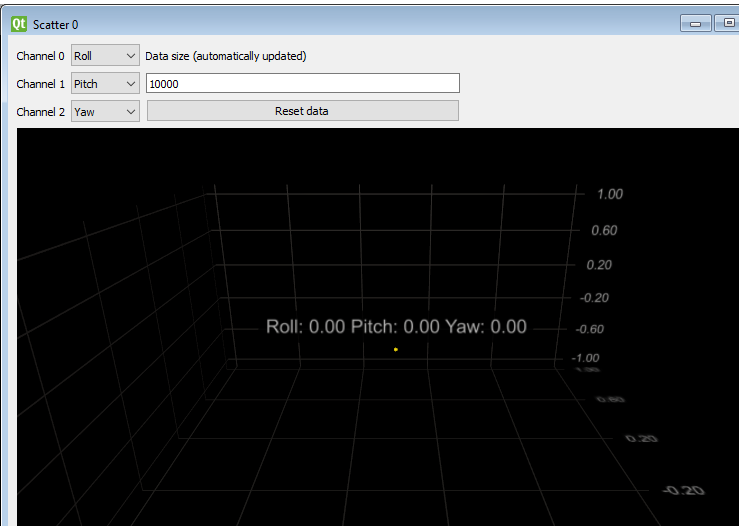
The result is a QT application which currently features 3 ways of visualizing data: 3D orientation cube, 3D scatter plot and a line plot. Data is received through a serial port, although I plan to expand it to a network port as well, and can be selectively visualized in the ways mentioned above. In parallel, input data can be logged to an external file (e.g. .csv) and there's an option to perform simple math operations on input data.
Video an screenshots demonstrate current capabilities, which I think are sufficient and stable enough. However, this being a non-professional software, some minor kinks can be expected.
All that is very nice, but what actually works
It's currently possible to:
- Read data from serial port or network socket, in a customizable frame format
- Perform simple math operations (add, subtract) on serial channels to create virtual math channels
- Visualize any 3 channels as 3D orientation in Euler angles or any 4 channels as a quaternion
- Visualize any 3 channels in a 3D scatter plot. Zoom, pan select individual data points
- Visualize any number of channels in line plot(s).
Zoom, pan, auto-adjust axes to inspect regions of interest - Log all data channels into a file
- Retain configuration between app restarts
- Run precompiled release for Windows & Linux; compilation instructions
- Internal run log saves events during runtime, making it easier to report and diagnose faults
What is not possible:
- Visualization at high data rates (currently tested up to 200Hz, 5 input channels)
- Running scatter plot on Ubuntu 16.04/18.04 (something related to LLVM) - seems fixed in v1.0
 Vedran

 Bharbour
 Dylan Brophy

 Adrelien