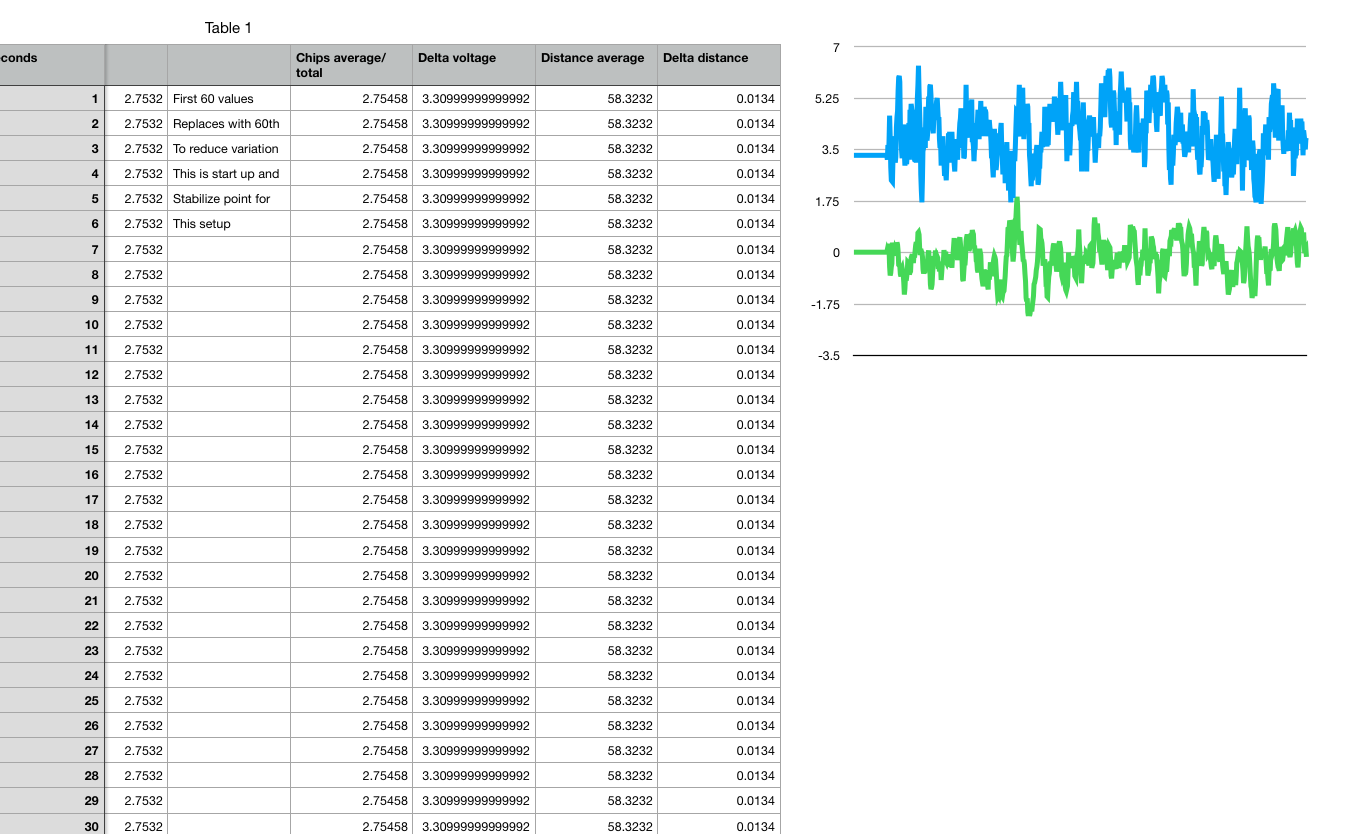
the blue color is voltage variation x 100 the distance is scaled by 1. i dc offset the voltage by 5 for so they could be seen next to each other. they do not perfectly overlay, but it is enough for me to design a run that takes distance_mm-((ΔchipV) x100) and see if total distance variation reduces
my average voltage per the setup is
2.75458
so i will take sample distance -(vsample-2.75458)x100 to get my adjusted distance.
for original data range of min to max was 2.1688mm measuring a distance of 58mm with 800 averaged samples of 1 sec (but averaged each 30 times a second)
here is how it samples with voltage compensation.
Discussions
Become a Hackaday.io Member
Create an account to leave a comment. Already have an account? Log In.