 MartMet
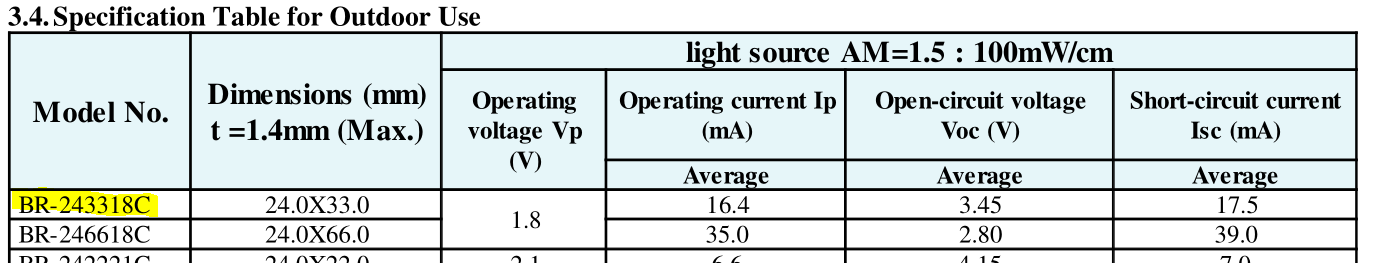
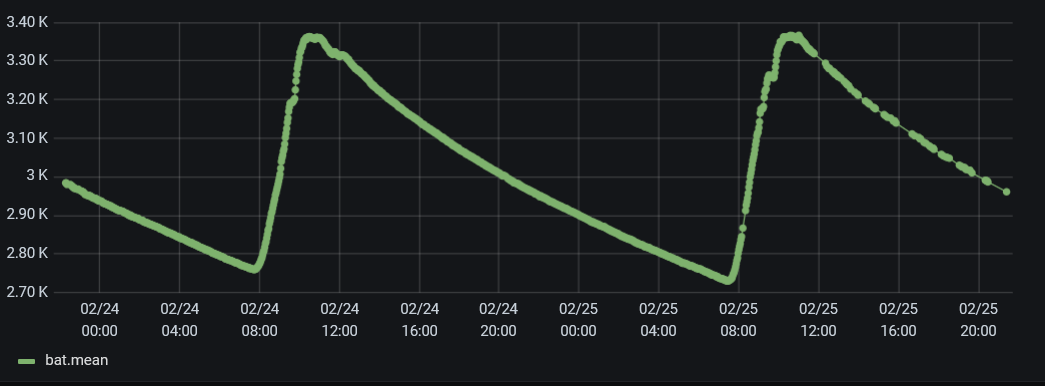 The devices is placed on the balcony and charged with a small solar panel BR-243318C.
In direct sunlight the small version of the solar panel gives max. ~3.45V (- 0.3V of the Ge-Diode)
In ambient light the voltage is about 2.5V so the supercapacitor is not fully used .... this solution is suboptimal for indoor use.
Discussions
Become a Hackaday.io Member
Create an account to leave a comment. Already have an account? Log In.
Very nice, I've been thinking on doing this exact same configuration but wasn't sure the small solar panel would be enough indoor. I'm definately trying your hack soon !
One question : why is the charging curve only rising from 8am to 10am ? I would expect a steady phase until the afternoon (solar power > module consumption) then a slow decrease (solar power < module consumption) then the normal decrease (solar power=0, power provided by the cap alone).
Ok actually to questions : with what tool did you log the bat voltage ?
Are you sure? yes | no
Thanks for your response. Glad you liked it. :)
To answer your questions: As it was a sunny february day at this time, so exposed to direct sunlight the capacitor will charge very quickly. Or in other terms: the solar power is few magnitudes more then the actual consumption of the bluetooth thermometer. (in direct sunlight)
As you can see there the module can keep up the voltage to ~13PM. But it's not like it stops after that. The discharge curve of the supercapacitor is flattened by the constant energy input of the module. From about 16 PM in the afternoon it was dark and the module delivers only a few µA.
If you are intrested in a i can search for data from the bigger solarmodul under ambient light conditions only.
The thermometer does measure and transmit the actualy battery/supercap voltage over bluetooth. A very neat feature. :)
Currently I use the following setup to log the data:
Raspiberry Pi3:
NodeRed to log data from 6 Bluetooth thermometers via BLE ( https://github.com/MartMet/ATC_MiThermometer/blob/master/node-RED/nodered.md )
InfluxDB for time stamped storage Grafana for displaying
If you have any further questions please contact me.
Are you sure? yes | no