With my control nodes quietly collecting data, it is time to start doing some analysis.
The entire point of this project has been to visualize the distribution of the soil moisture in my yard.
I want a heat map, or topographic map of the yard showing the moisture, and I want it animated to show how the moisture changes with time.
I don't know of a standard program that can do what I need (Veusz could probably do it, but I'd have to export the data to csv or something.)
The simplest thing for me is to (again) use the Mud-Py Django project as a library, and write my own analysis software.
That sounds like a lot of work, but it isn't, not really. At least, not if you use the right tools.
The right tools for this are Python, NumPy, PyQtGraph, and PyQt5.
- Python gets me access to Django and the database.
- Numpy gets me easy access to complex math stuff.
- PyQtGraph gets me easy access to powerful, good looking charts.
- PyQt5 lets me join all the parts in an easy to build GUI.
I'm sure it is possible to do all of the needed things completely inside Django using Leaflet for the graphing, but that would require more contact with HTML and Javascript than I want to subject myself to.
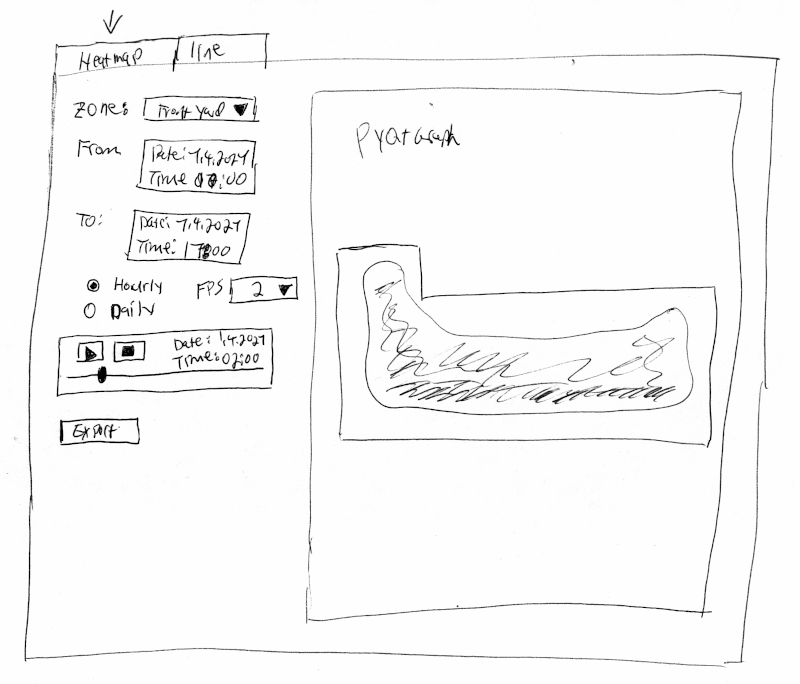
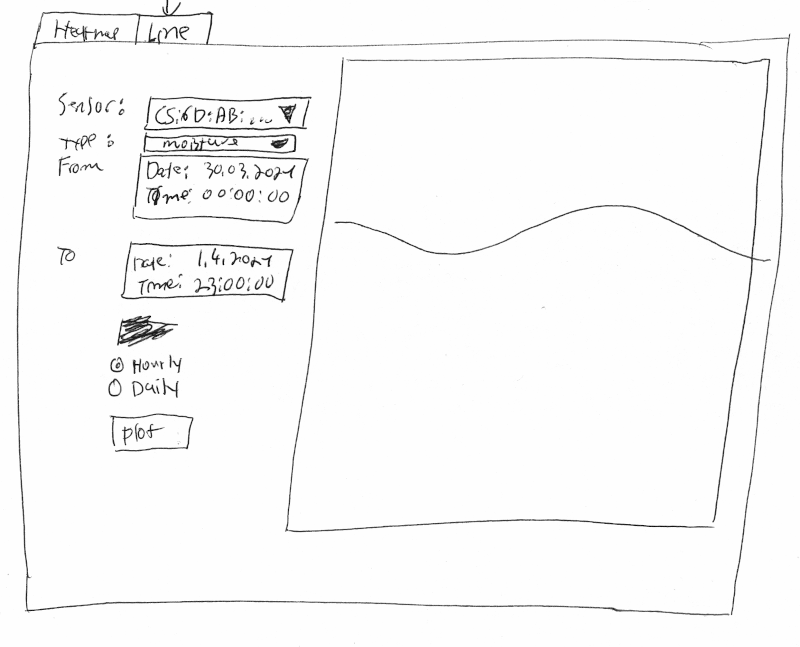
Before I start on GUI projects, I usually make a rough sketch. There are two this time around: One for the heatmap/topographic chart, and one for a line chart.
Heatmap:
 Line chart:
 I did say they were rough sketches.
The heatmap has a selection for the zone to plot and the time range. The idea is to pull the data by hours or days from the Mud-Py database. Each sensor is then averaged by the time step (day or hour) and used to plot a heatmap using the NumPy interpolate function to make a smooth surface out of the individual peaks.
The line plot will pull data for a single sensor for a specified time range and plot is as a simple line. It also has a selection for hourly or daily averaging.
That's what I'm going to implement as a start. There'll be more bells and whistles added as I go along, but that's the basic thrust.
 Joseph Eoff
Discussions
Become a Hackaday.io Member
Create an account to leave a comment. Already have an account? Log In.