I haven't posted anything in the last few days, but I haven't been (only) loafing over the Easter holiday.
I spent some time on Saturday putting together the framework of a PyQt5 project to do the data analysis.
I got back to it this evening, and implemented parts of the GUI.

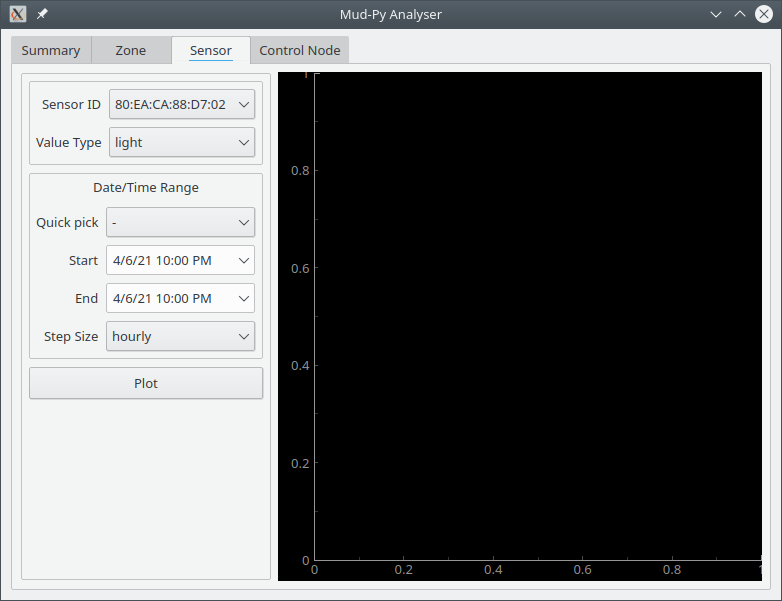
I started with the somewhat simpler single sensor plot.
It follows the sketch fairly well, expect that I added some additional features.
The "Sensor ID" and "Value Type" fields are filled from the Mud-Py database - I've already implemented that part. The API is somewhat limited right now, but it just needs a few more methods to get the data for the plot.
The "Date/Time Range" block is a custom control that I built. I'll need it on most of the other tabs, so I went ahead and made a control rather than putting all of the bits and pieces on each tab.
I like PyQt5, but getting those few items to look like they should while still automatically adjusting to the window size and the content was a pain.
At any rate, it is making progress.
25 April is coming up fast, though, so I'm going to have to get moving or else miss the cutoff date for the "Data Loggin'" contest.
As with all the software for this project, the analyser got its own GitHub repository.
 Joseph Eoff
Discussions
Become a Hackaday.io Member
Create an account to leave a comment. Already have an account? Log In.