 Joseph Eoff
A couple of days ago, I extended the Mud-Py software to record the received signal strength indication (RSSI) values from the sensors and the control nodes.
Due to a bug in the Mud-Py-MQTT-Bridge component, I didn't get data until last night - the bug prevented the system from recording any data at all.
That's fixed, so I thought I'd share a first look at the radio signal distribution in my garden.
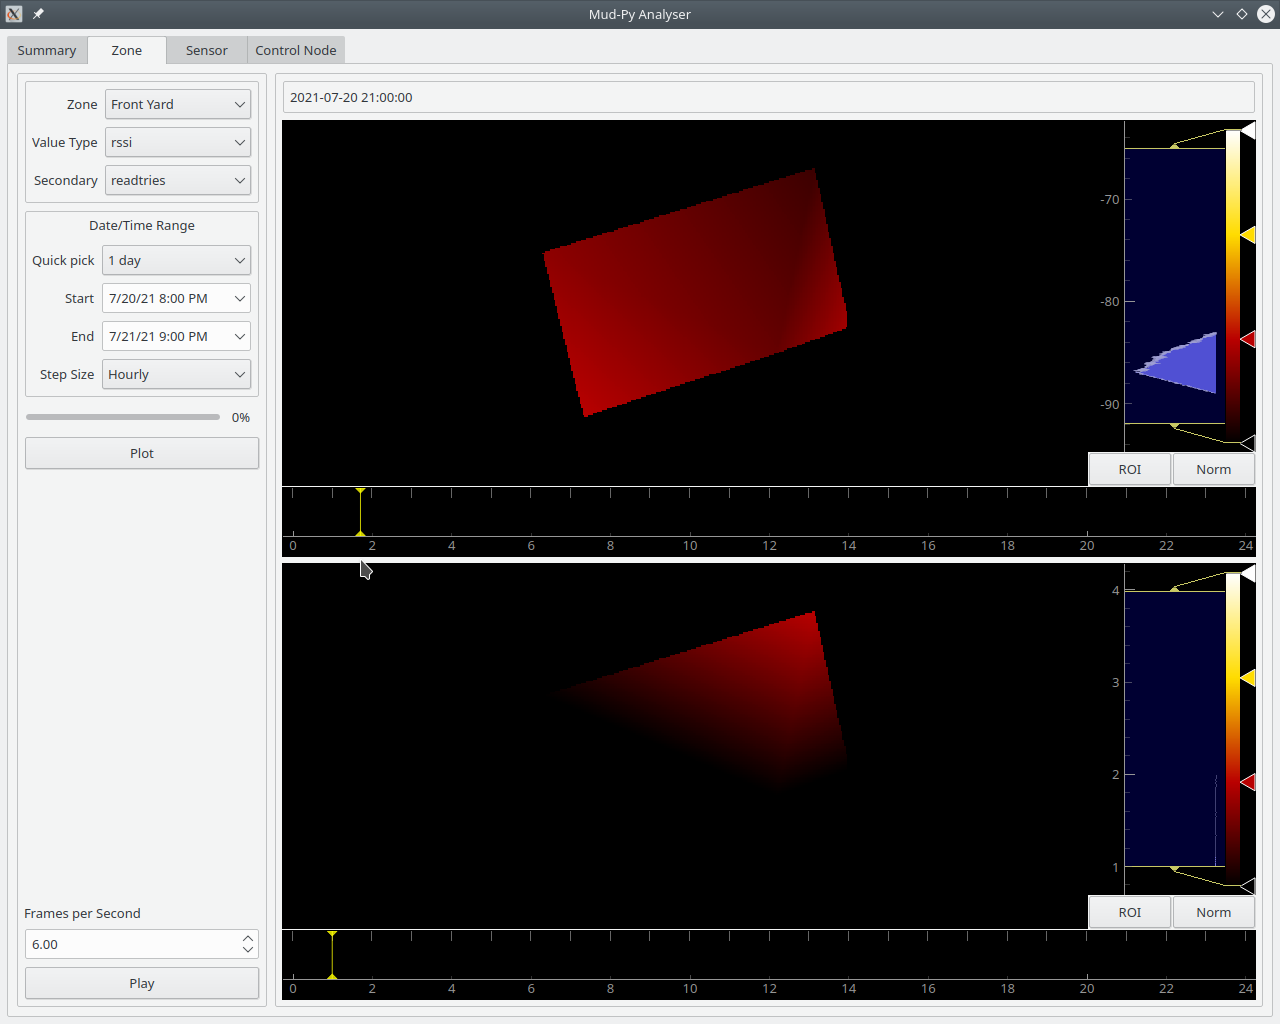 The upper plot is the RSSI, the lower plot is the read-try pseudo-sensor.
They sort of match.
Ideally, the lower plot should be black, indicating data read on the first try.
The upper plot would ideally be an even color color all over.
The RSSI plot shows the upper right corner being slightly weaker than the rest of the yard while the read-try shows that it took more attempts to read the sensor in the upper right corner than it did elsewhere.
So far, so good.
It doesn't always line up that well, however:
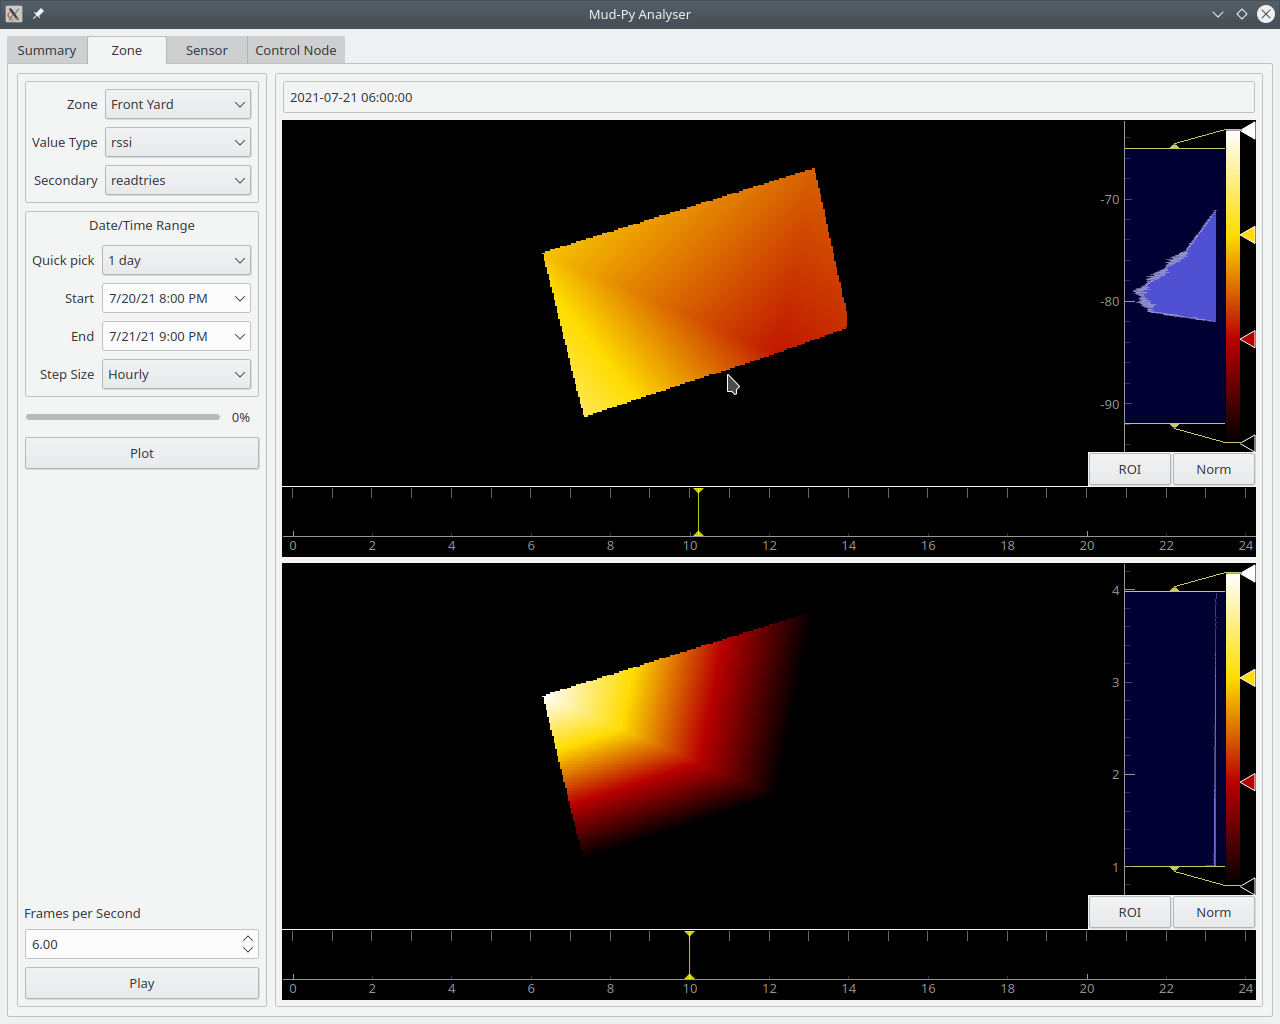 That's the same layout as above, but from about 6 o'clock this morning.
 The upper left corner shows a fairly strong signal, but it still took the four try maximum to read from the sensor in that spot.
The interesting test will come when we get some rain.
The forecast says we won't be getting rain until next week sometime, though we may get some thunderstorms before then.
I can't wait to see what the RSSI numbers look like when it is raining.
Discussions
Become a Hackaday.io Member
Create an account to leave a comment. Already have an account? Log In.