Live-A-Little makes a prediction of how many years you have left to live based on actuarial life tables and your current age.
In particular, it uses the 2017 actuarial life table reported by the United States Social Security Administration. The actuarial life table lists life expectancy data by gender, but the data used for the Live-A-Little prediction is an average of both genders. Consequently, Live-A-Little will slightly overpredict male life span by 1-3 years and slightly underpredict female life span by 1-3 years. It's easy enough to just use the life expectancy data for one gender, but I wanted to make the first prototype representative for both genders.

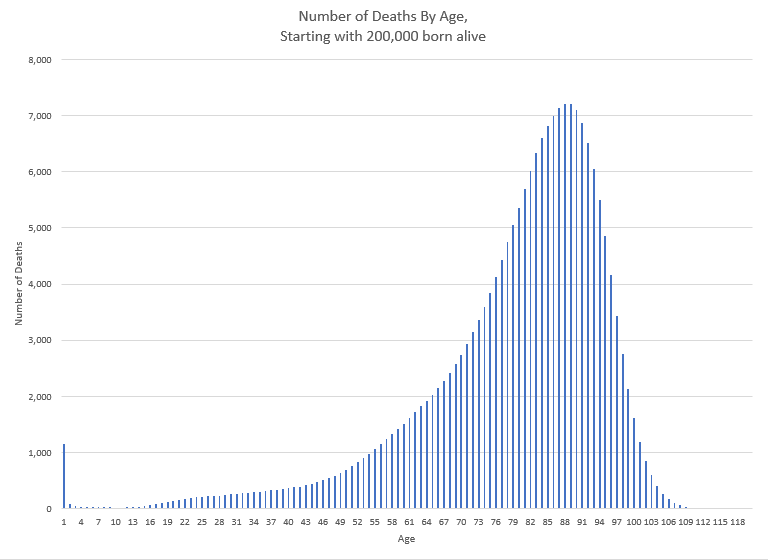
Some interesting things to note about the life expectancy data (see image above):
- infant mortality spike before age 1
- average age of death is close to 78 years old
- mode of age of death is close to 87 years old
The Live-A-Little approach to predicting life expectancy works as follows:
- sum all deaths at and above the current age
- generate a random number between 0 and the sum of all deaths at and above the current age
- counting up from your current age, the age "bucket" that the random number falls within is the age prediction
This prediction method ignores any lifestyle (i.e. "controllable") influence on life expectancy. It is most similar to picking a random person from a crowd of Americans who are at least as old as you and saying that you have the same life expectancy as as that person. More often than not that person will have average lifestyle and average luck that results in a near average life expectancy, but sometimes their life expectancy could be less or more depending on their unique combination of lifestyle and luck.
 John Opsahl
Discussions
Become a Hackaday.io Member
Create an account to leave a comment. Already have an account? Log In.