Overview:
-Animated Boot Screen: "from chaos to clarity"
Displaying a more realistic prism dispersing light into its components.
-Main menu:
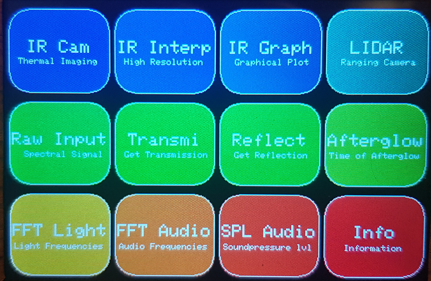
*The LIDAR-sensor VL53L5cx is build in µ-Spec finally, and its working !! *
Working measurements:
Thermo Cam
- Displaying Raw Data from 32x24 pixel Thermocam (MLX90640) with colorbar and dynamic min./max. temperatures at 1.9 fps (obsolete, due same refresh rate as 80 x 60 interpolated graphic)
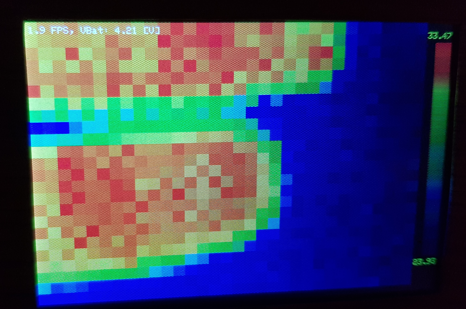
- Displaying interpolated Data from 32x24 pixel Thermocam (MLX90640) to resolution: 80x60 pixels with colorbar and dynamic min./max. temperature at 1.9 fps (fps breaks down above 80x60 pixels)
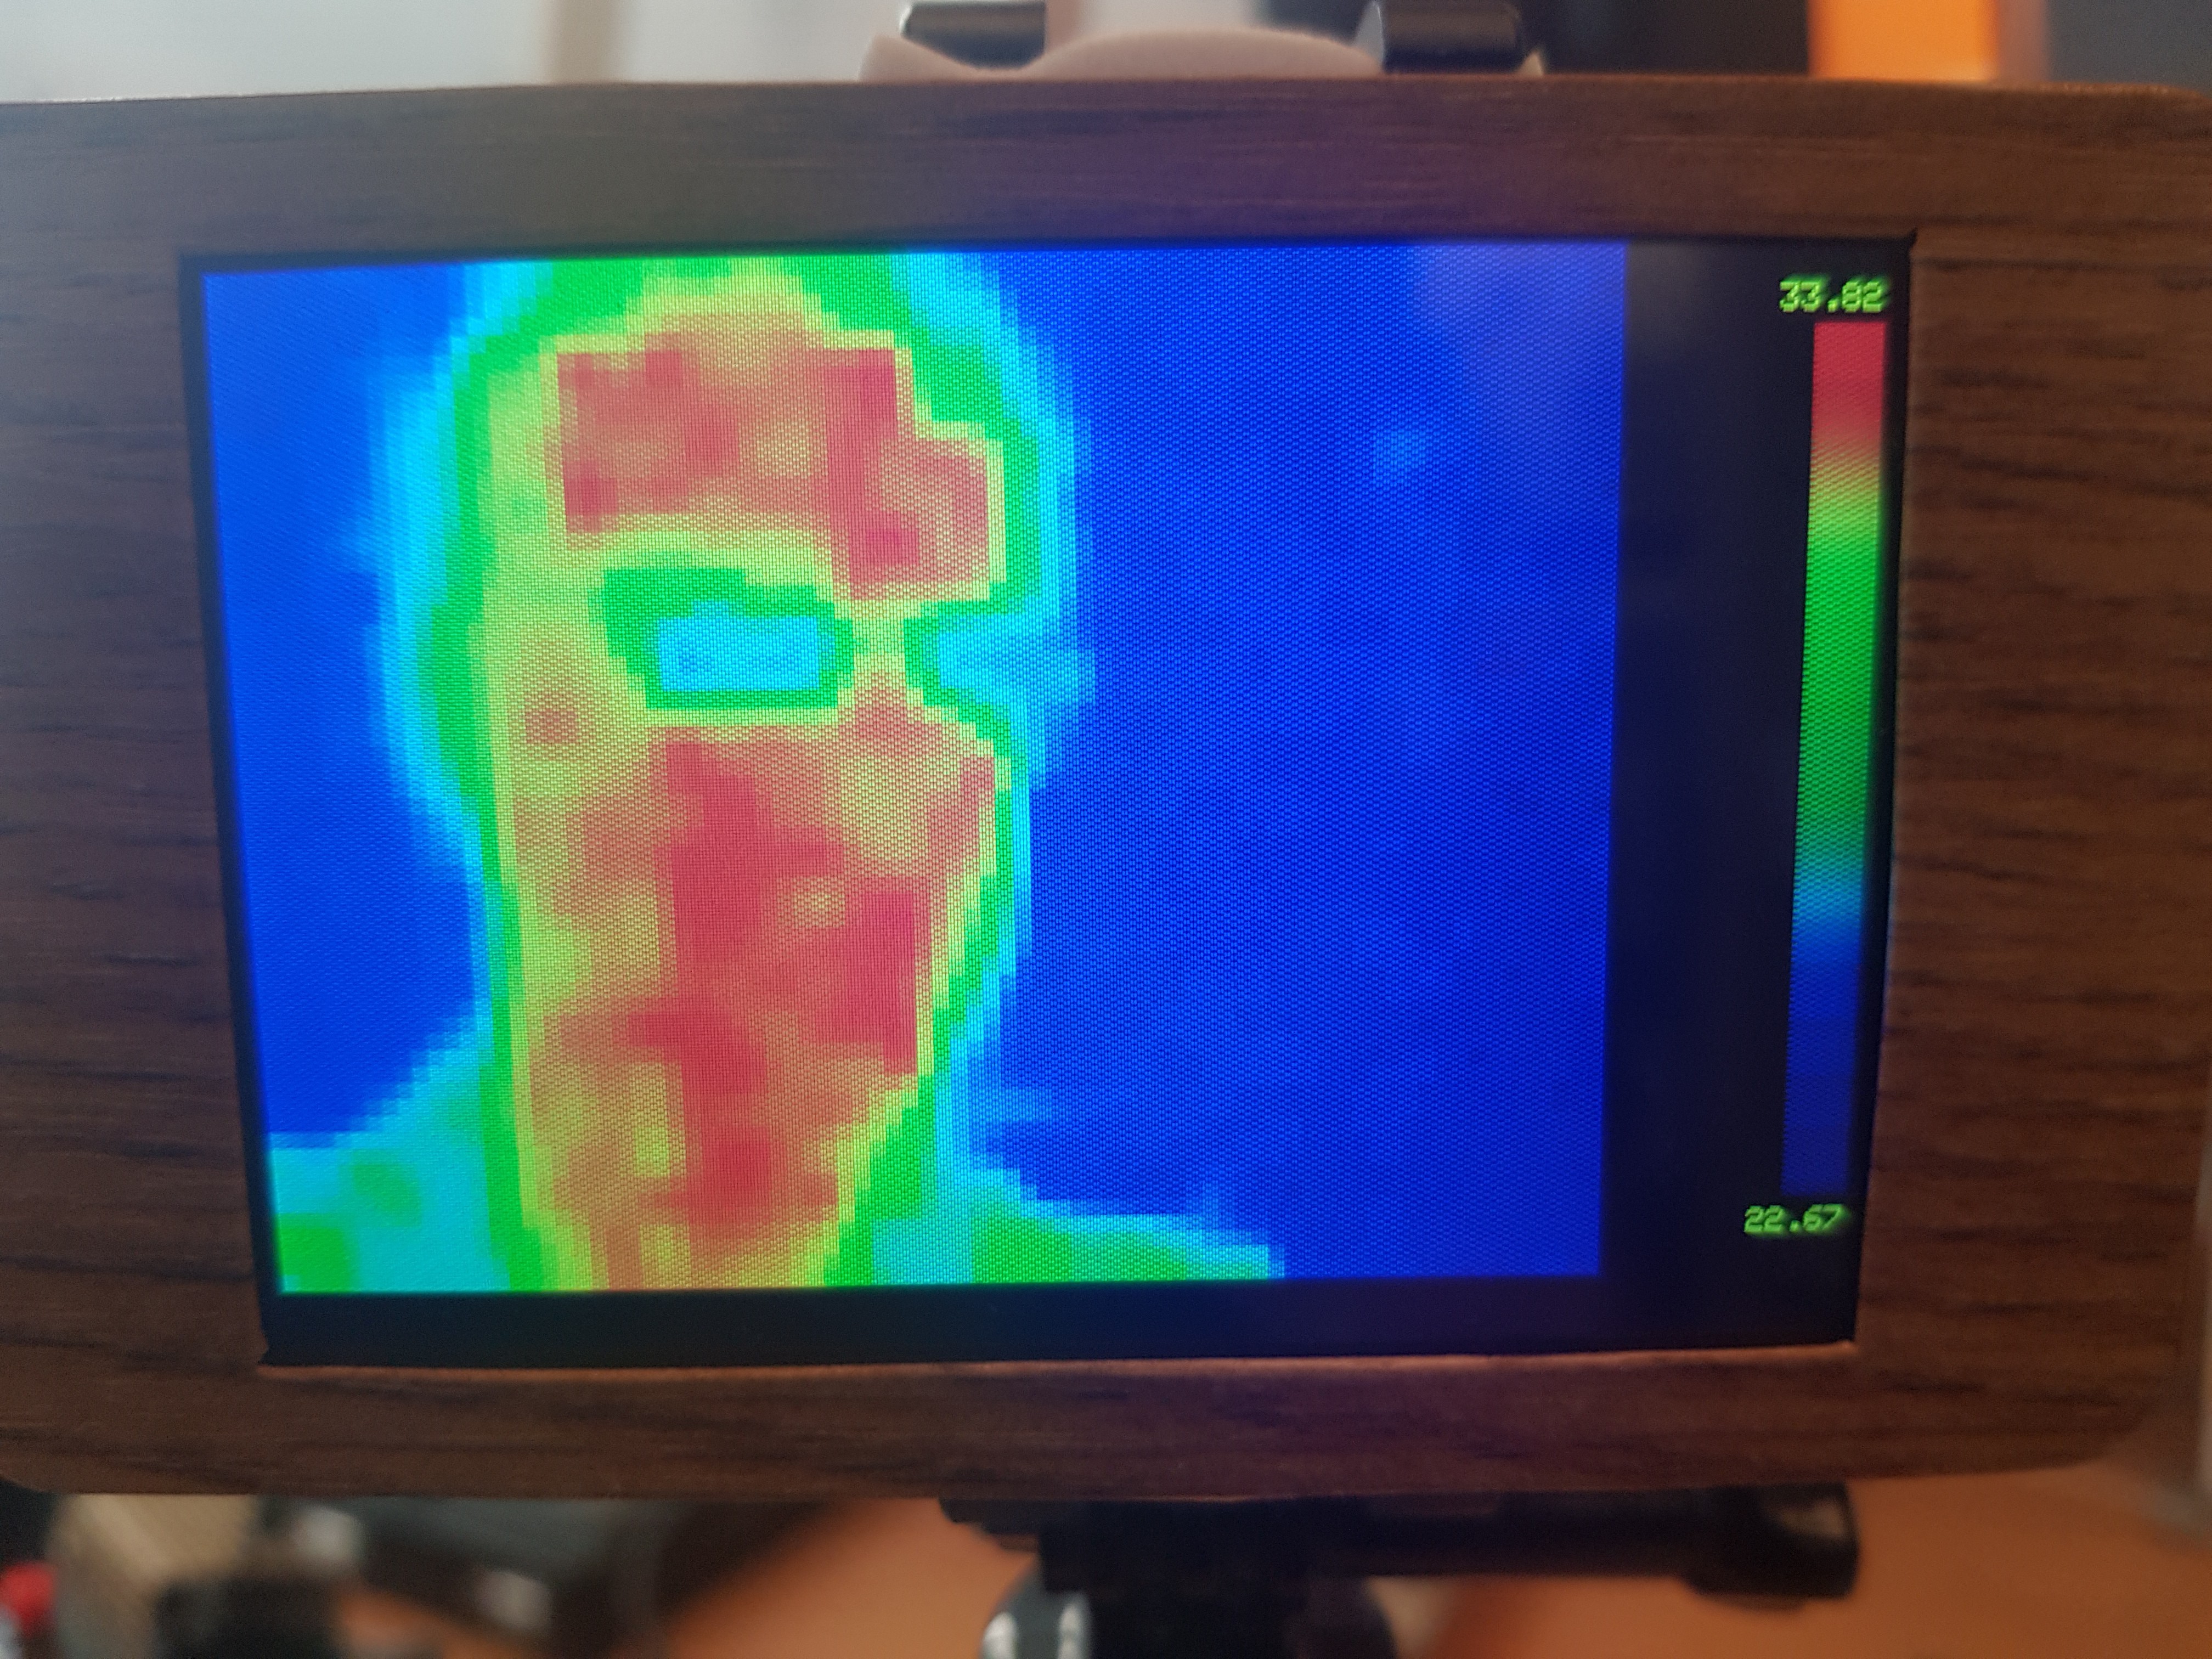
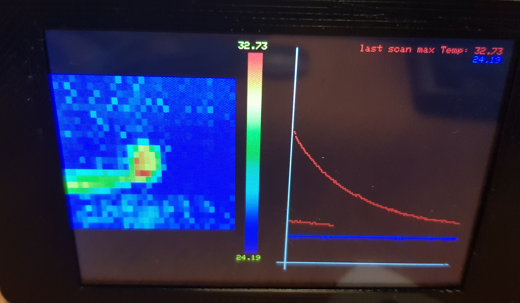
- Displaying Raw Data (MLX90640) 32x24 pixel plotting Min. & Max. Temperature graph
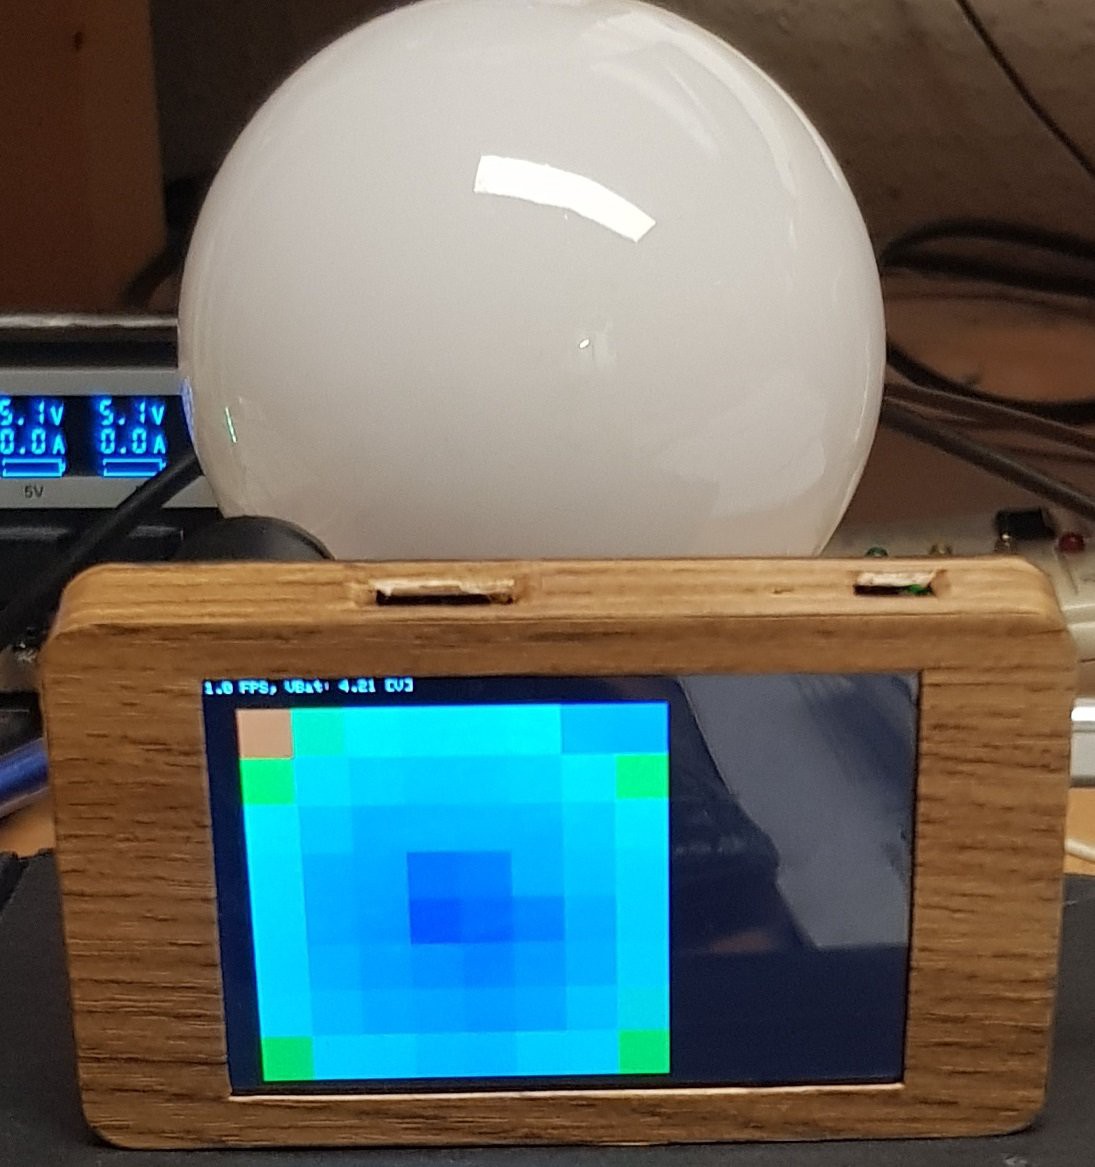
LIDAR 8x8
Raw data image of a sphere: (8.4 fps 8x8, 5.6 fps with 32x32)
Spectral Sensor
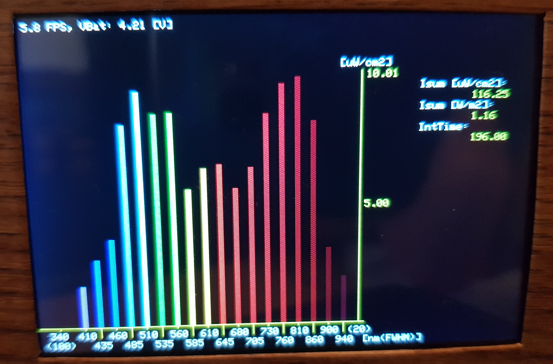
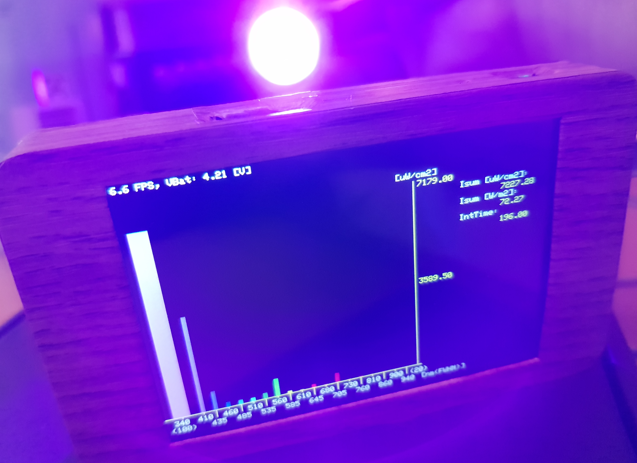
- Displaying Raw Data input from 1 + 18 spectroscopic channels (340 & 410 - 904 nm) from AS7265x and ML8511 sensors at 11.5 fps.
+ summed up light intensities in µW/cm²
+ summed up light intensities in "normalized" W/m²
+ Integration Time of exposure Time (adjusting dynamically)
+ lux in lumen/m² at the moment only from the 560 nm Channel (..its not that easy to convert and needs more lines in code for a nice value) thanks to hackaday.io/azvadva
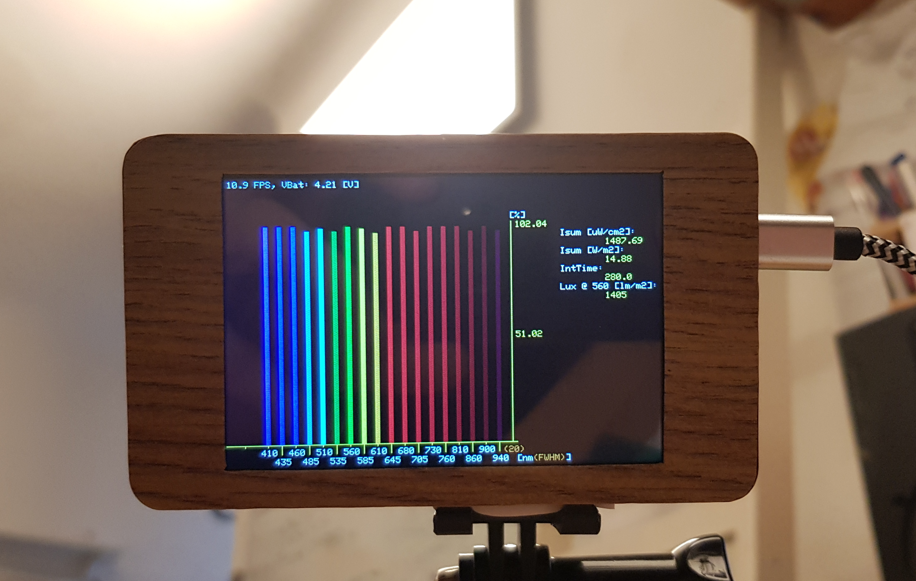
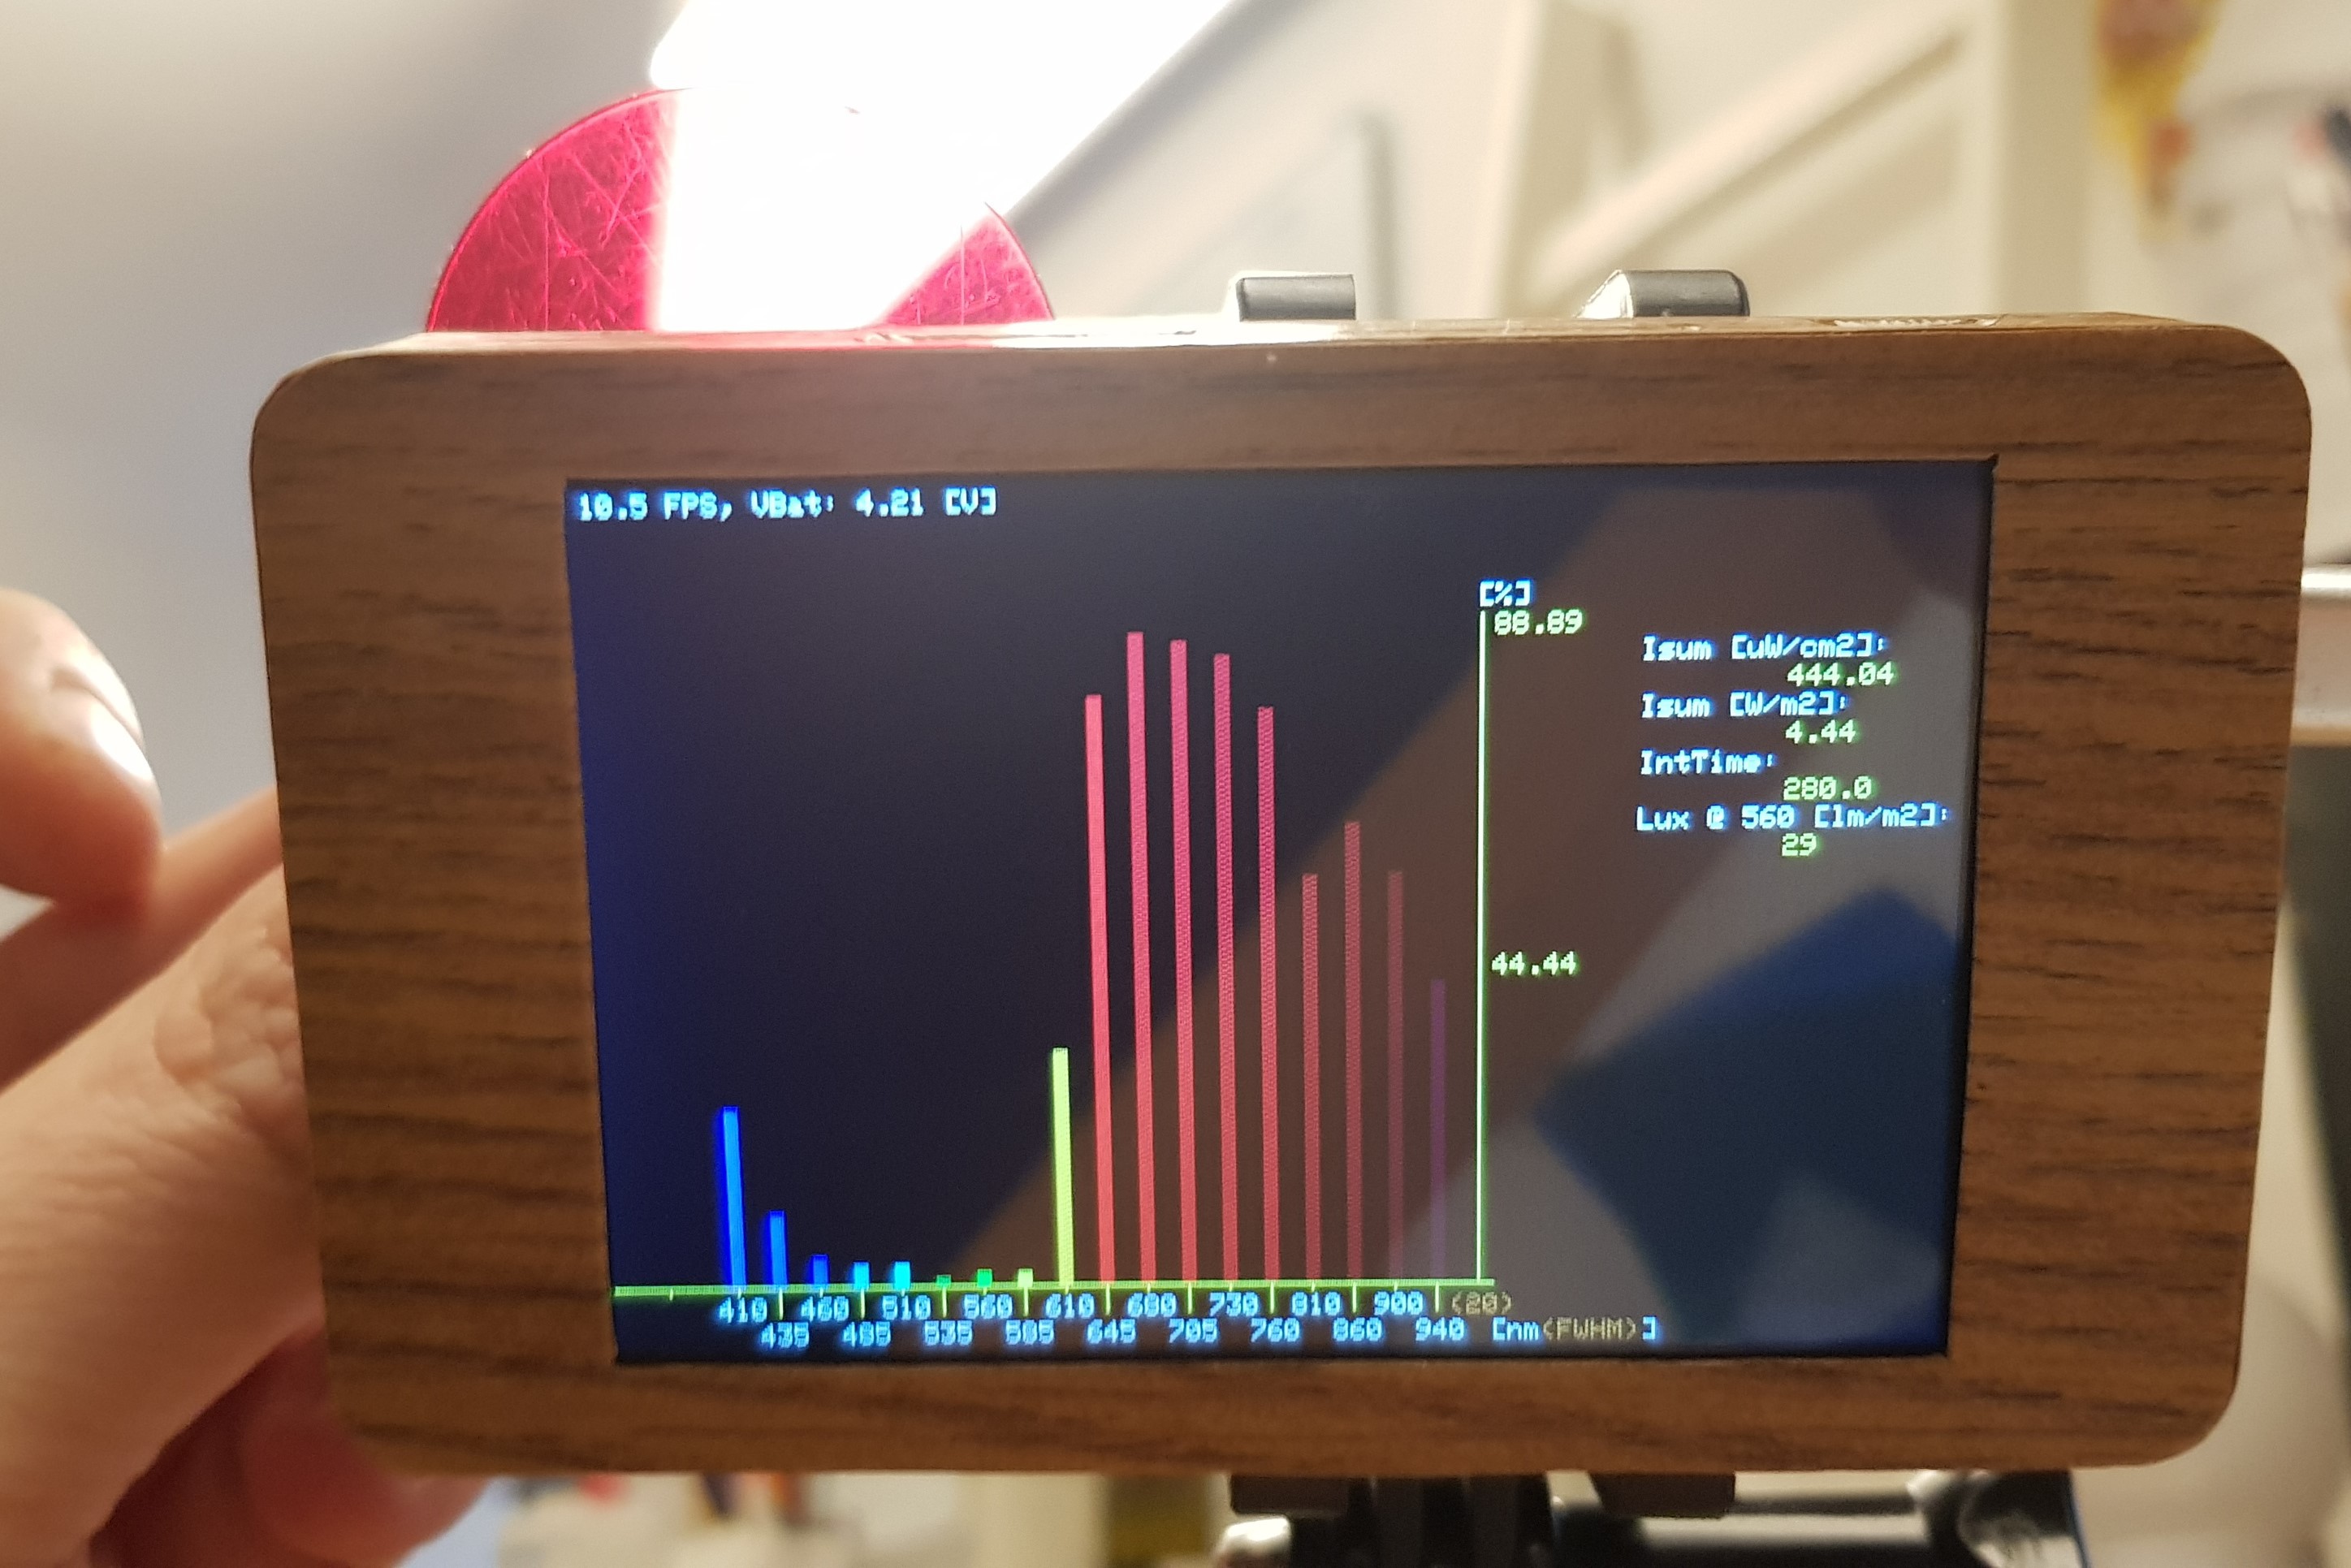
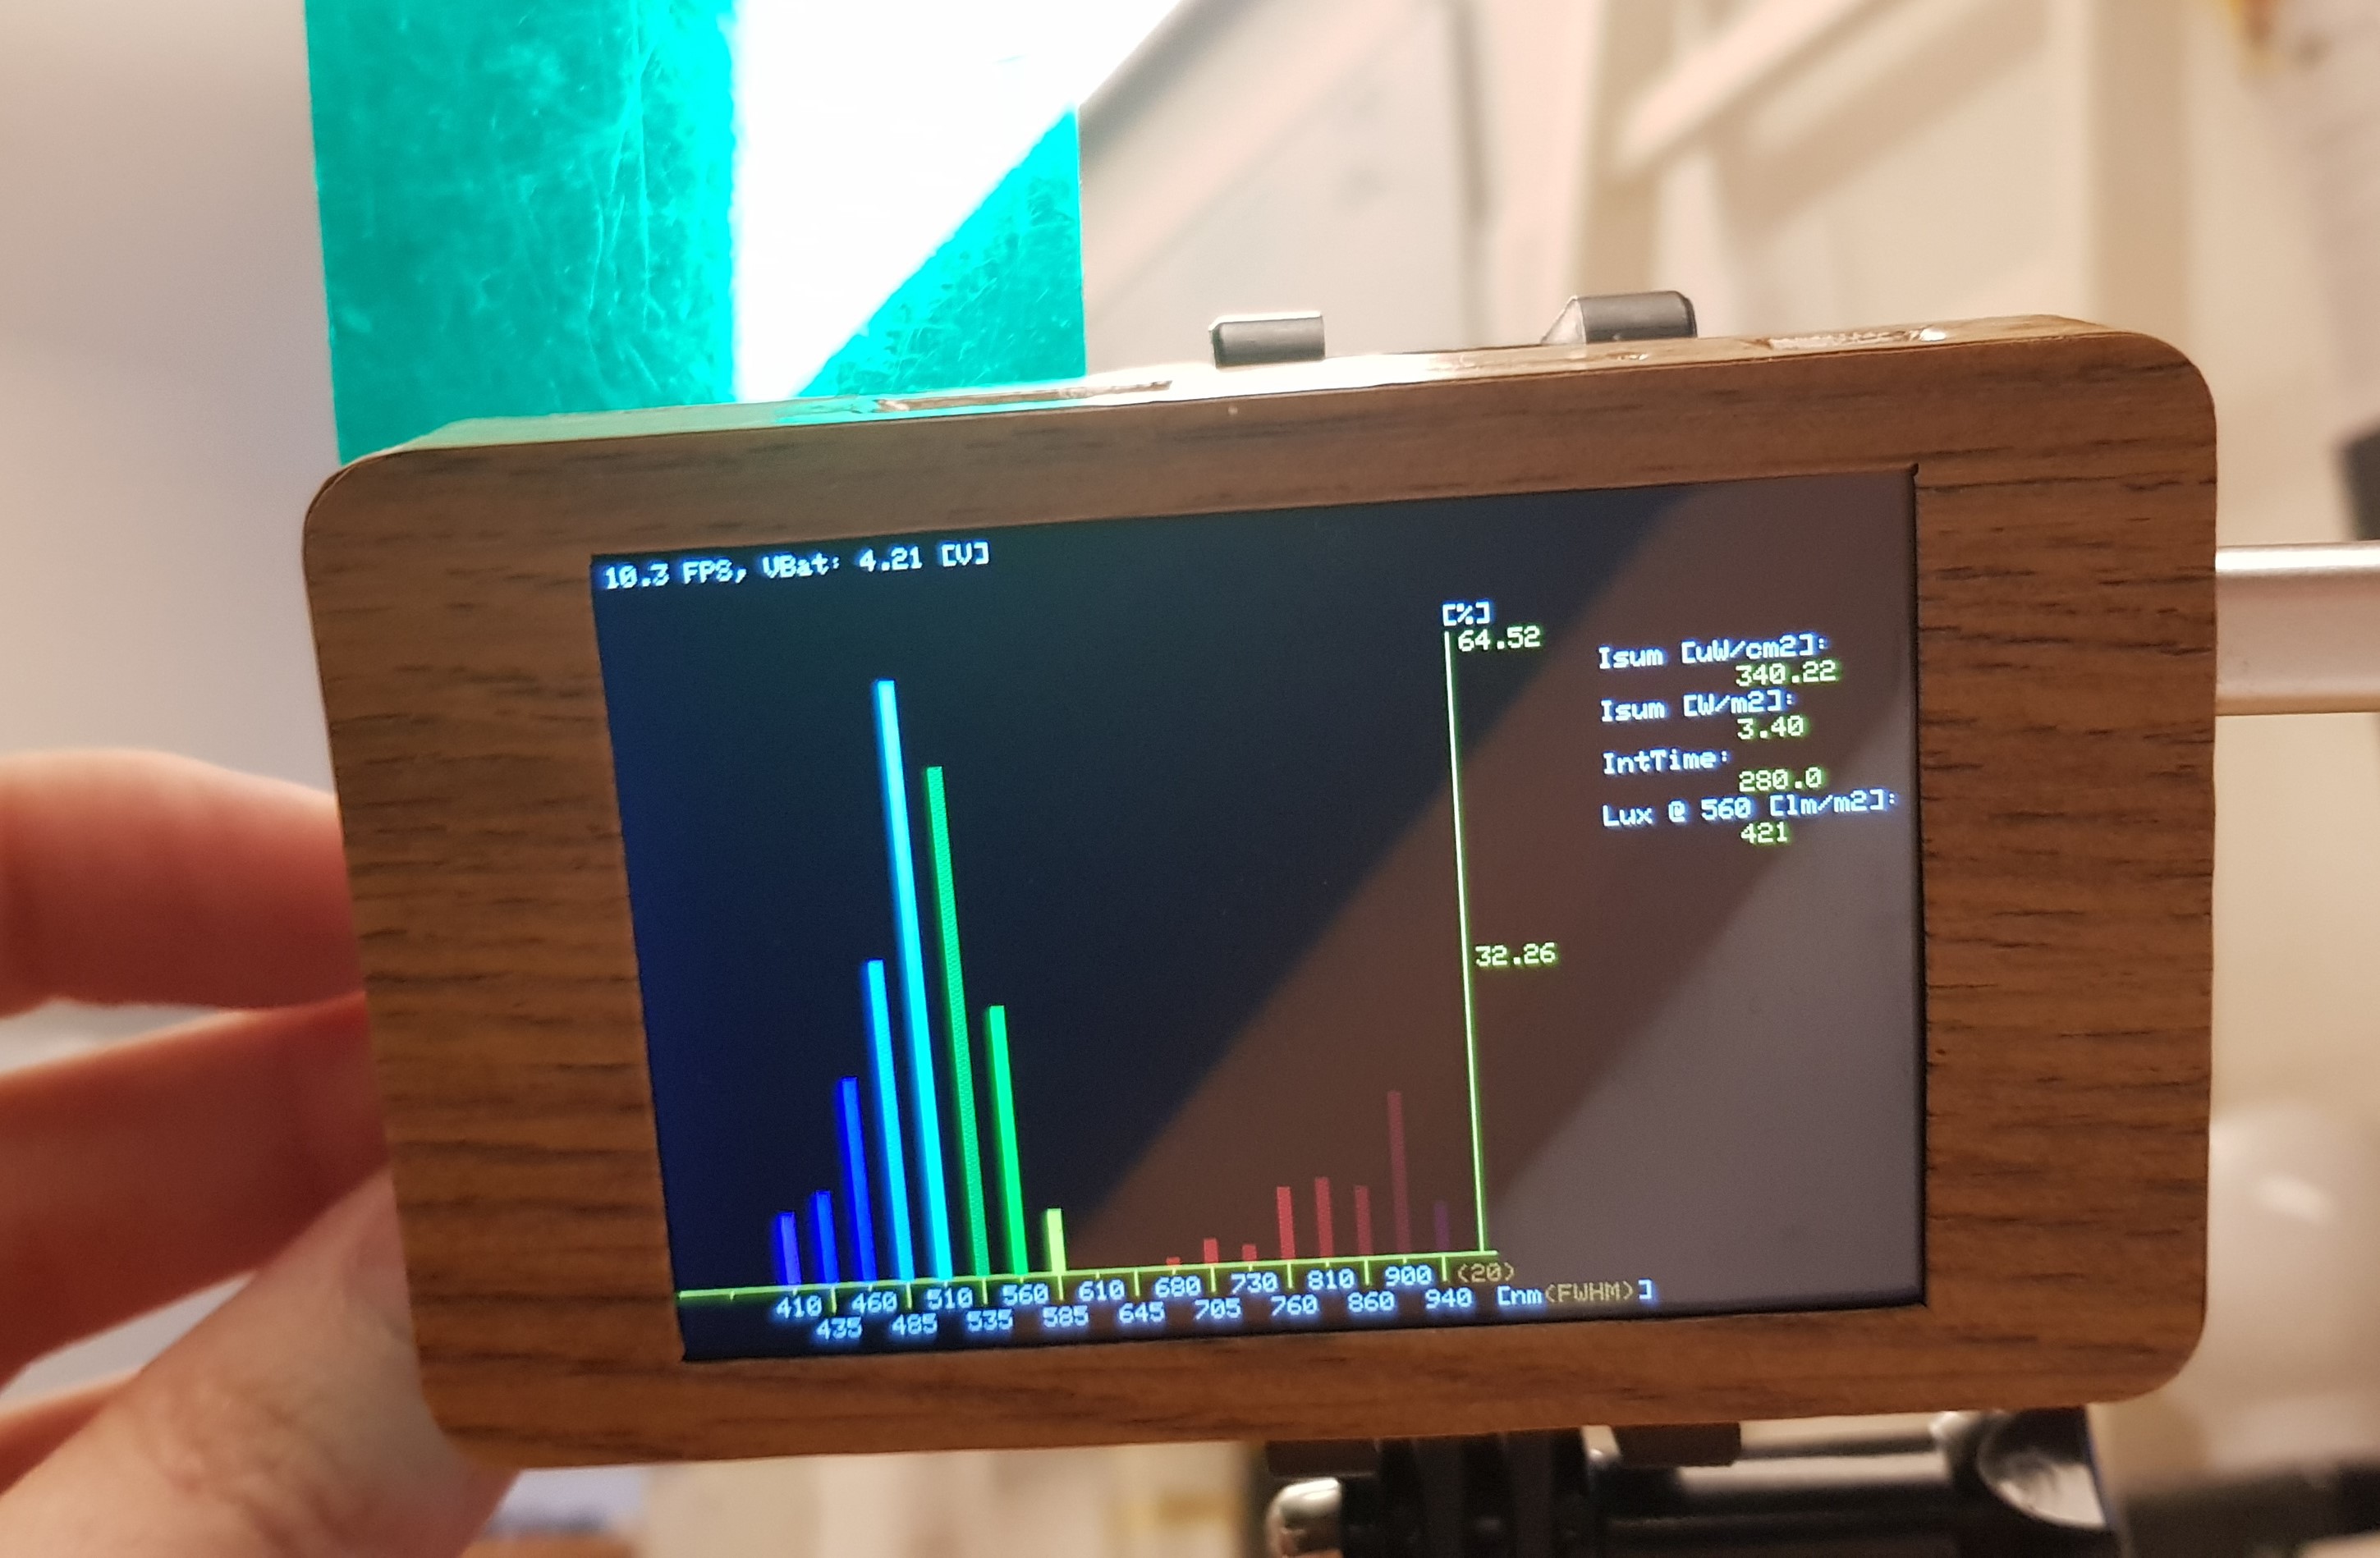
- Displaying Transmission Coefficient of translucent objects in percent after taking a reference measurement from static background / ambient light at 11.5 fps
Reference (100 % from ambient light):
Red filter:
Green filter:
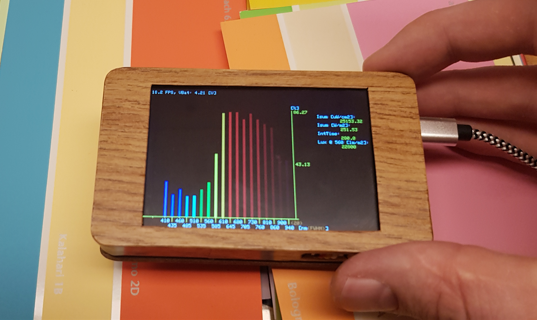
- Displaying Reflection Coefficient of objects in percent after taking a reference measurement at 11 fps. (hard coded reference of white paper or make a new own Ref.)
(normal) Light sensor
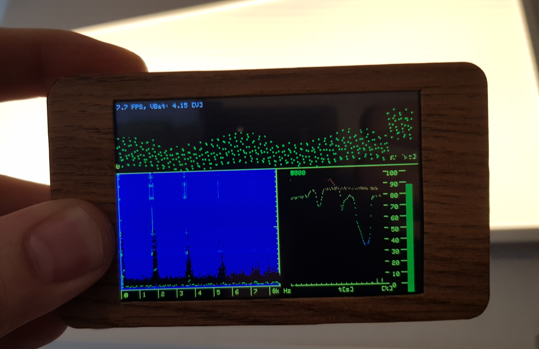
- Displaying LIGHT signal in time domain at 7.8 fps (old code) => 12.3 fps (tuned code)
Plotting:
+ 480 samples of light intensities in a 30 ms time frame
+ FFT 0-8,5 k Hz Amplitudes
+ color coded Waterfall diagram
+ Light-level in percent over long term time
+ Frequency with maximum amplitude
MEMS Mic
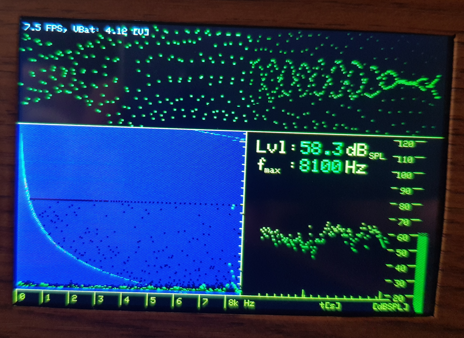
- Displaying calibrated Audio signal in time domain at 7.8 fps (old code) => 11.3 fps => 12.1 fps (tuned code)
Plotting:
+ 480 samples of audio in a 30 ms time frame
+ FFT 0-8,5 k Hz Amplitudes
+ color coded Waterfall diagram
+ Audio-level in dB_spl (Soundpresurelevel) over long term time with 92 dBmax (dampening the signal would give way bigger dB spl-levels)
+ Frequency with maximum amplitude
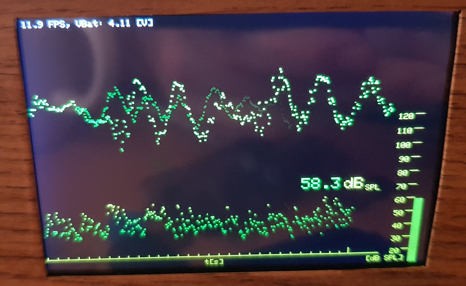
- Displaying calibrated Audio signal in time domain at 11.7 fps (old code) => 16.6 fps => 19.6 fps (tuned code)
Plotting:
+ Audio-level in dB_spl (Soundpresurelevel) over even longer term time
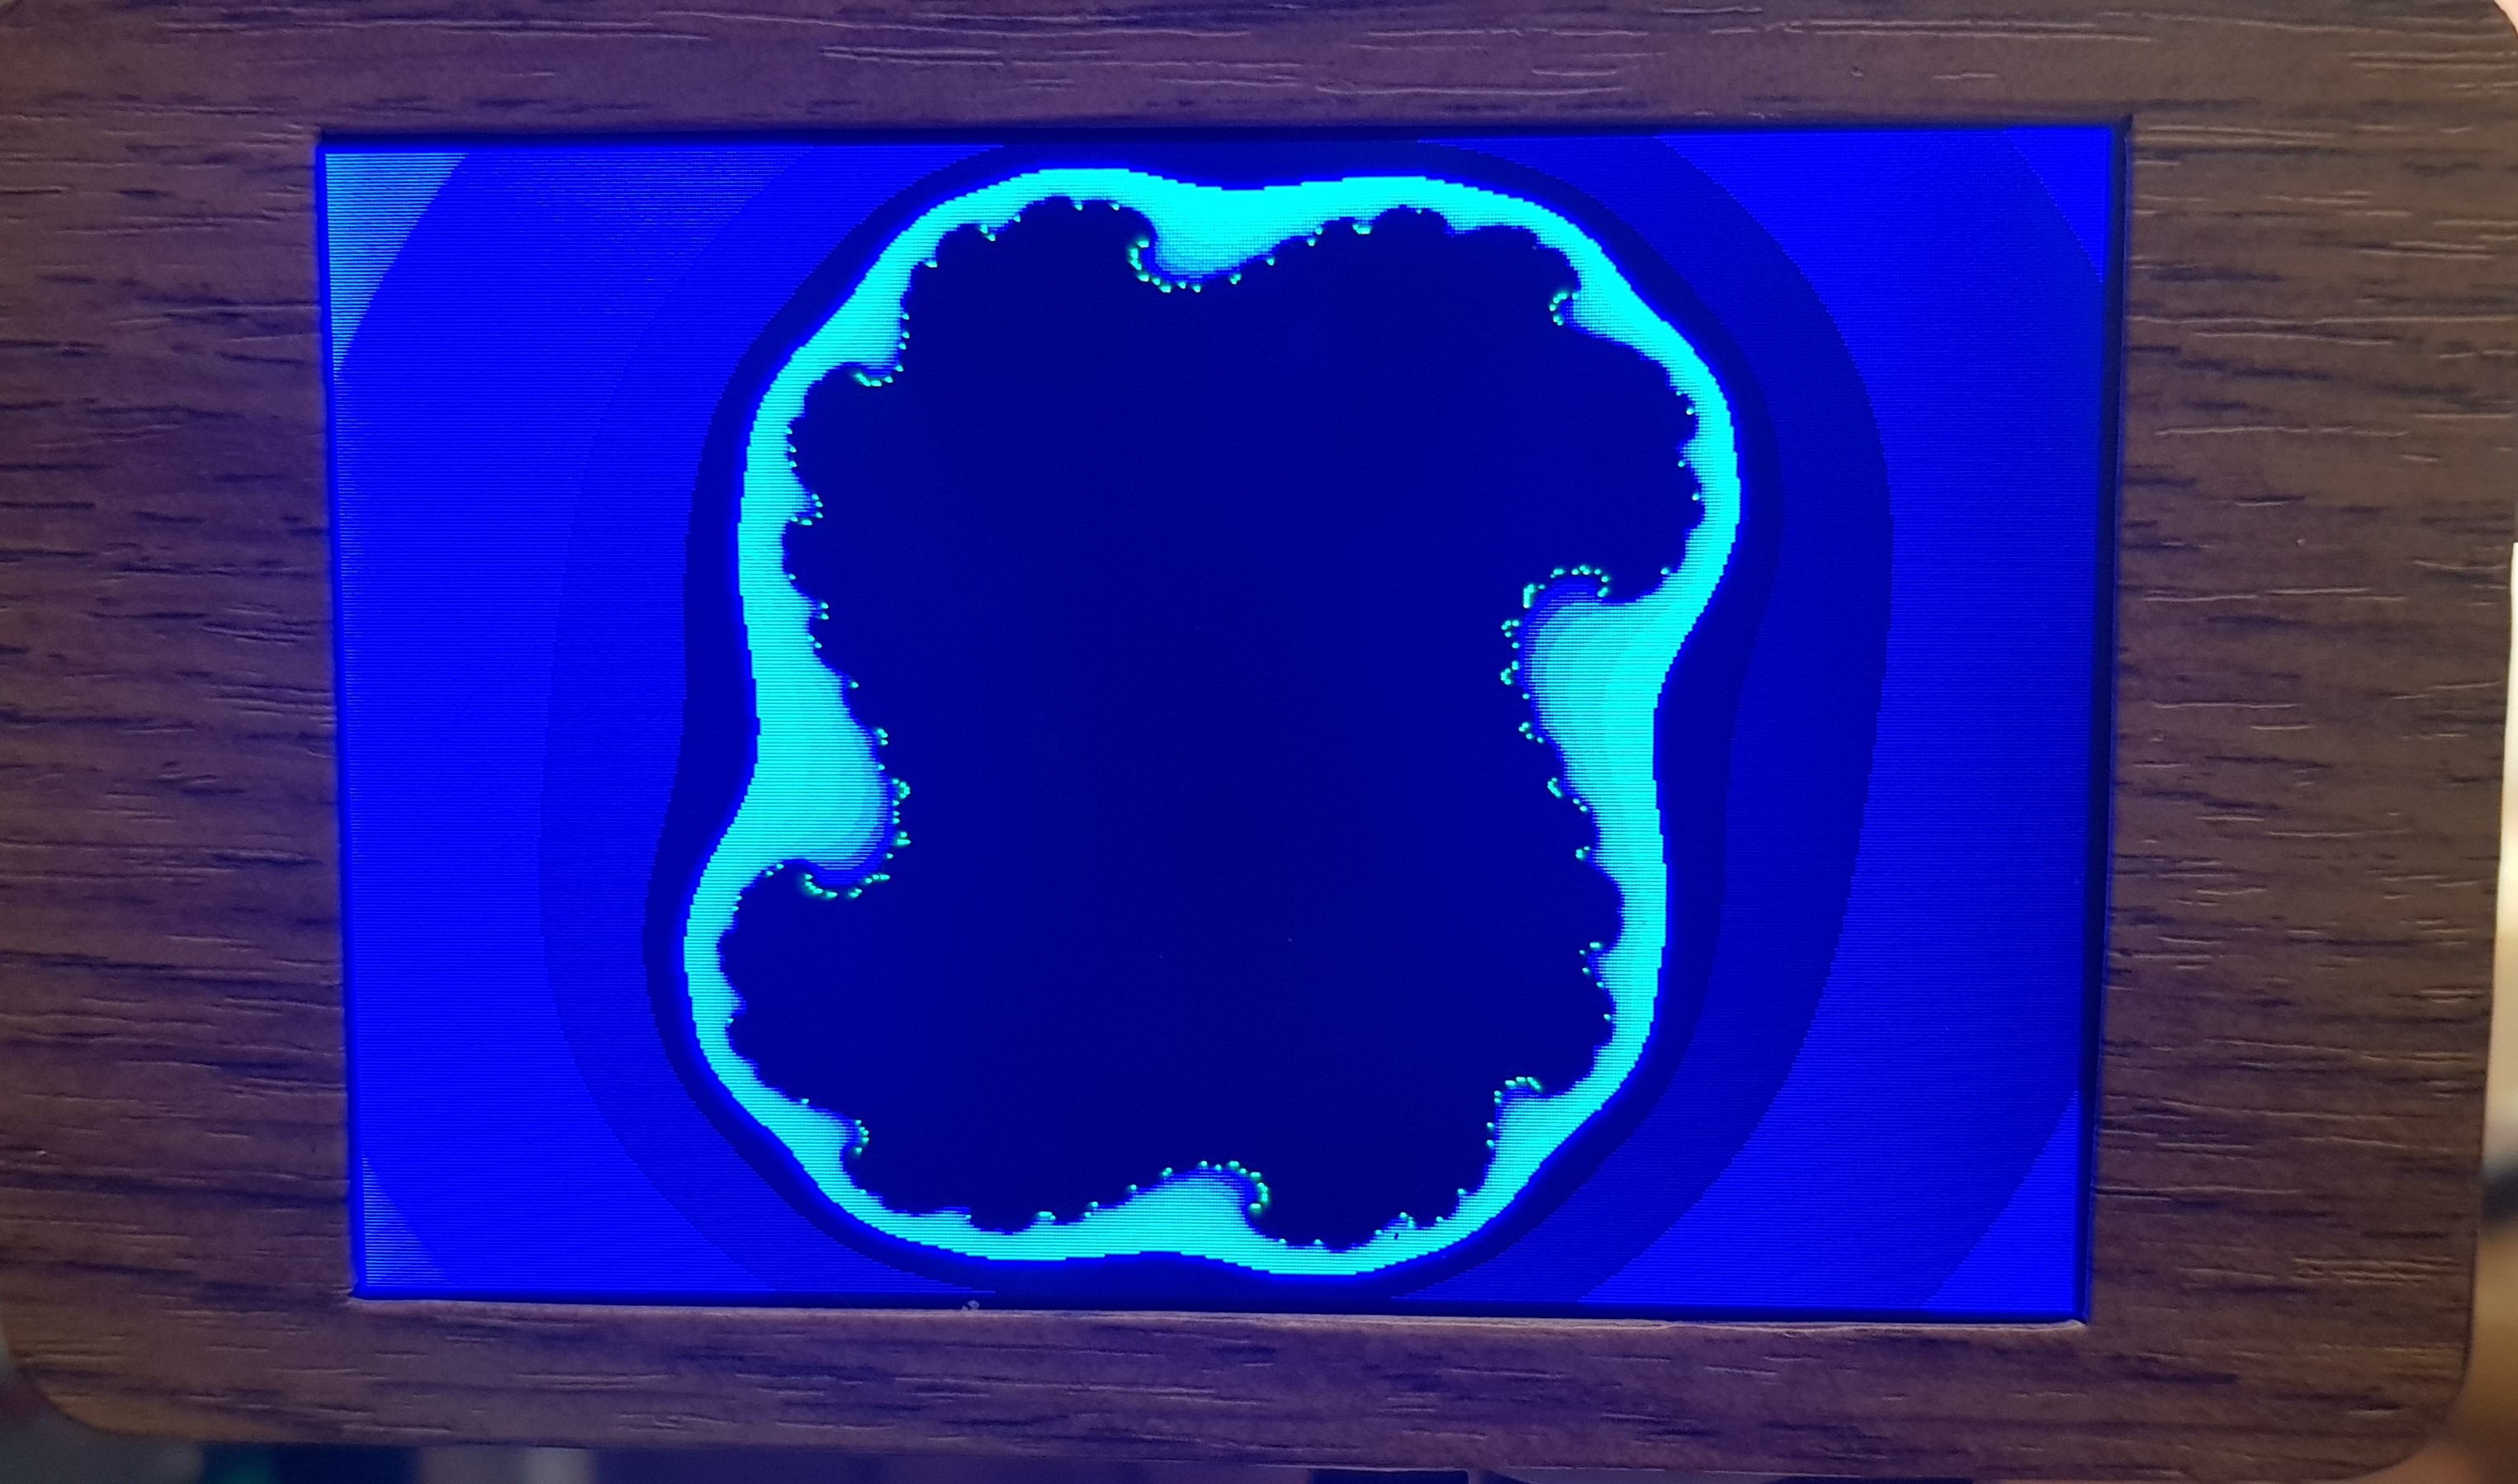
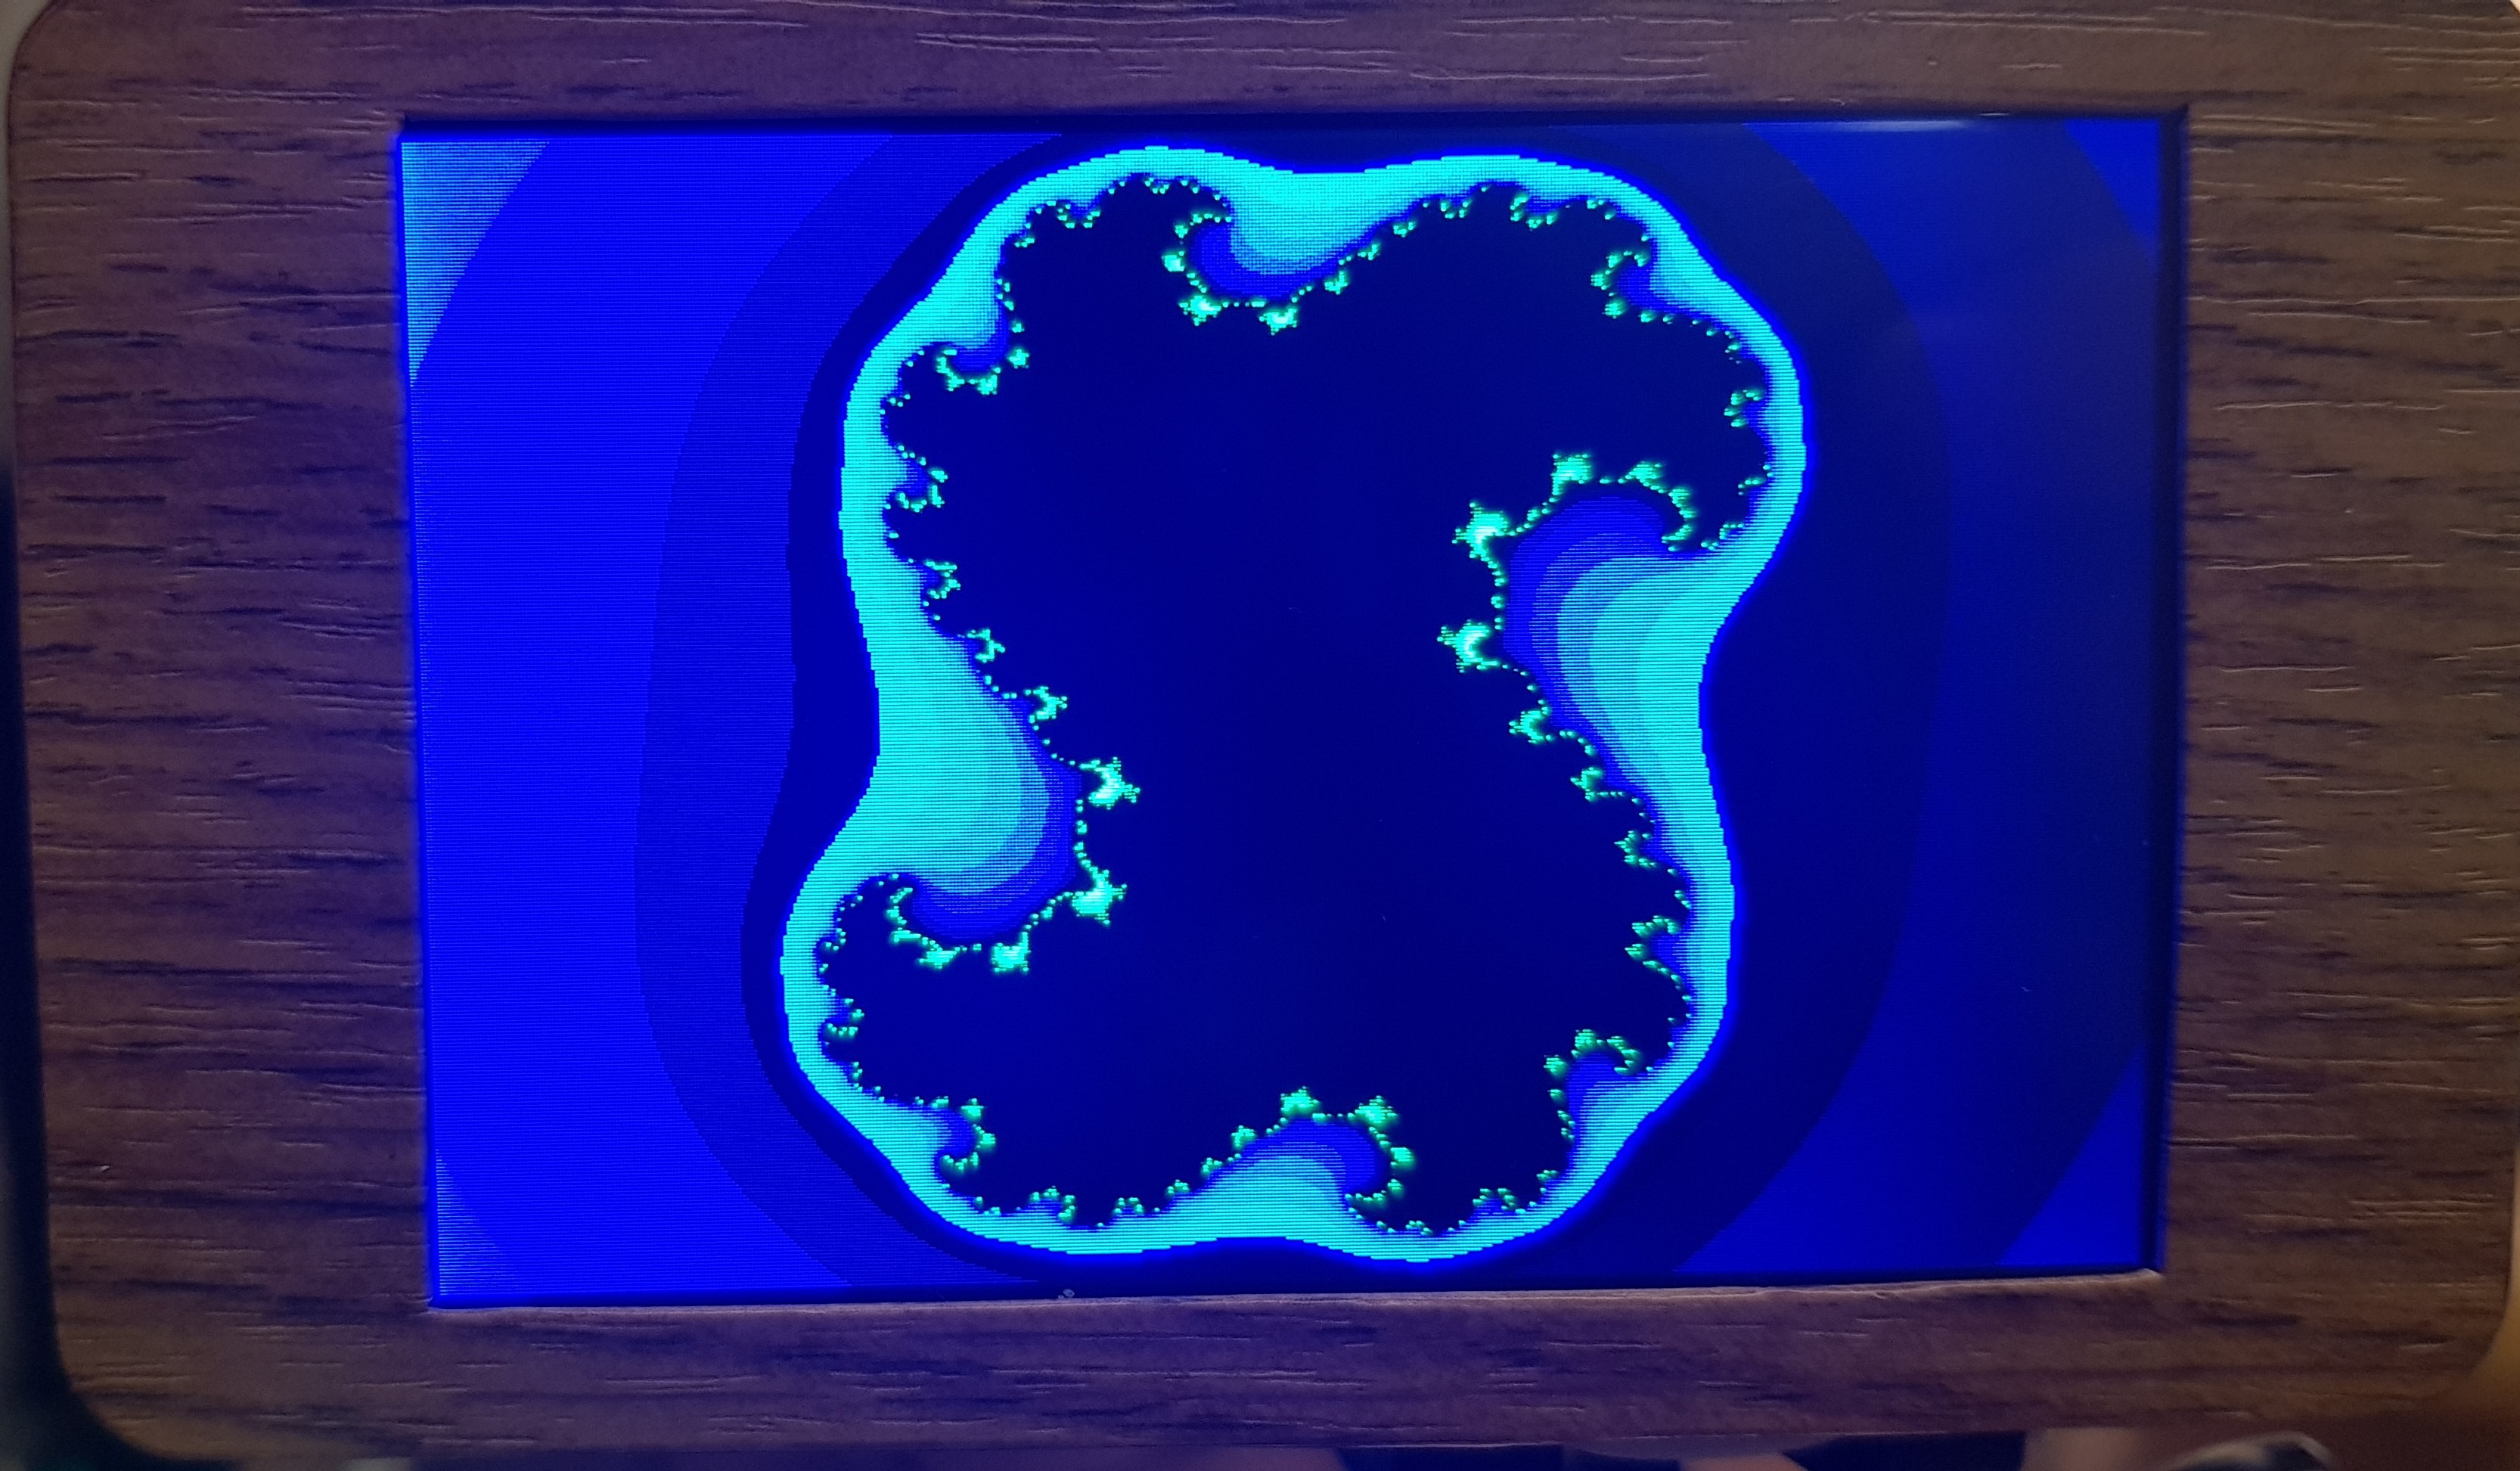
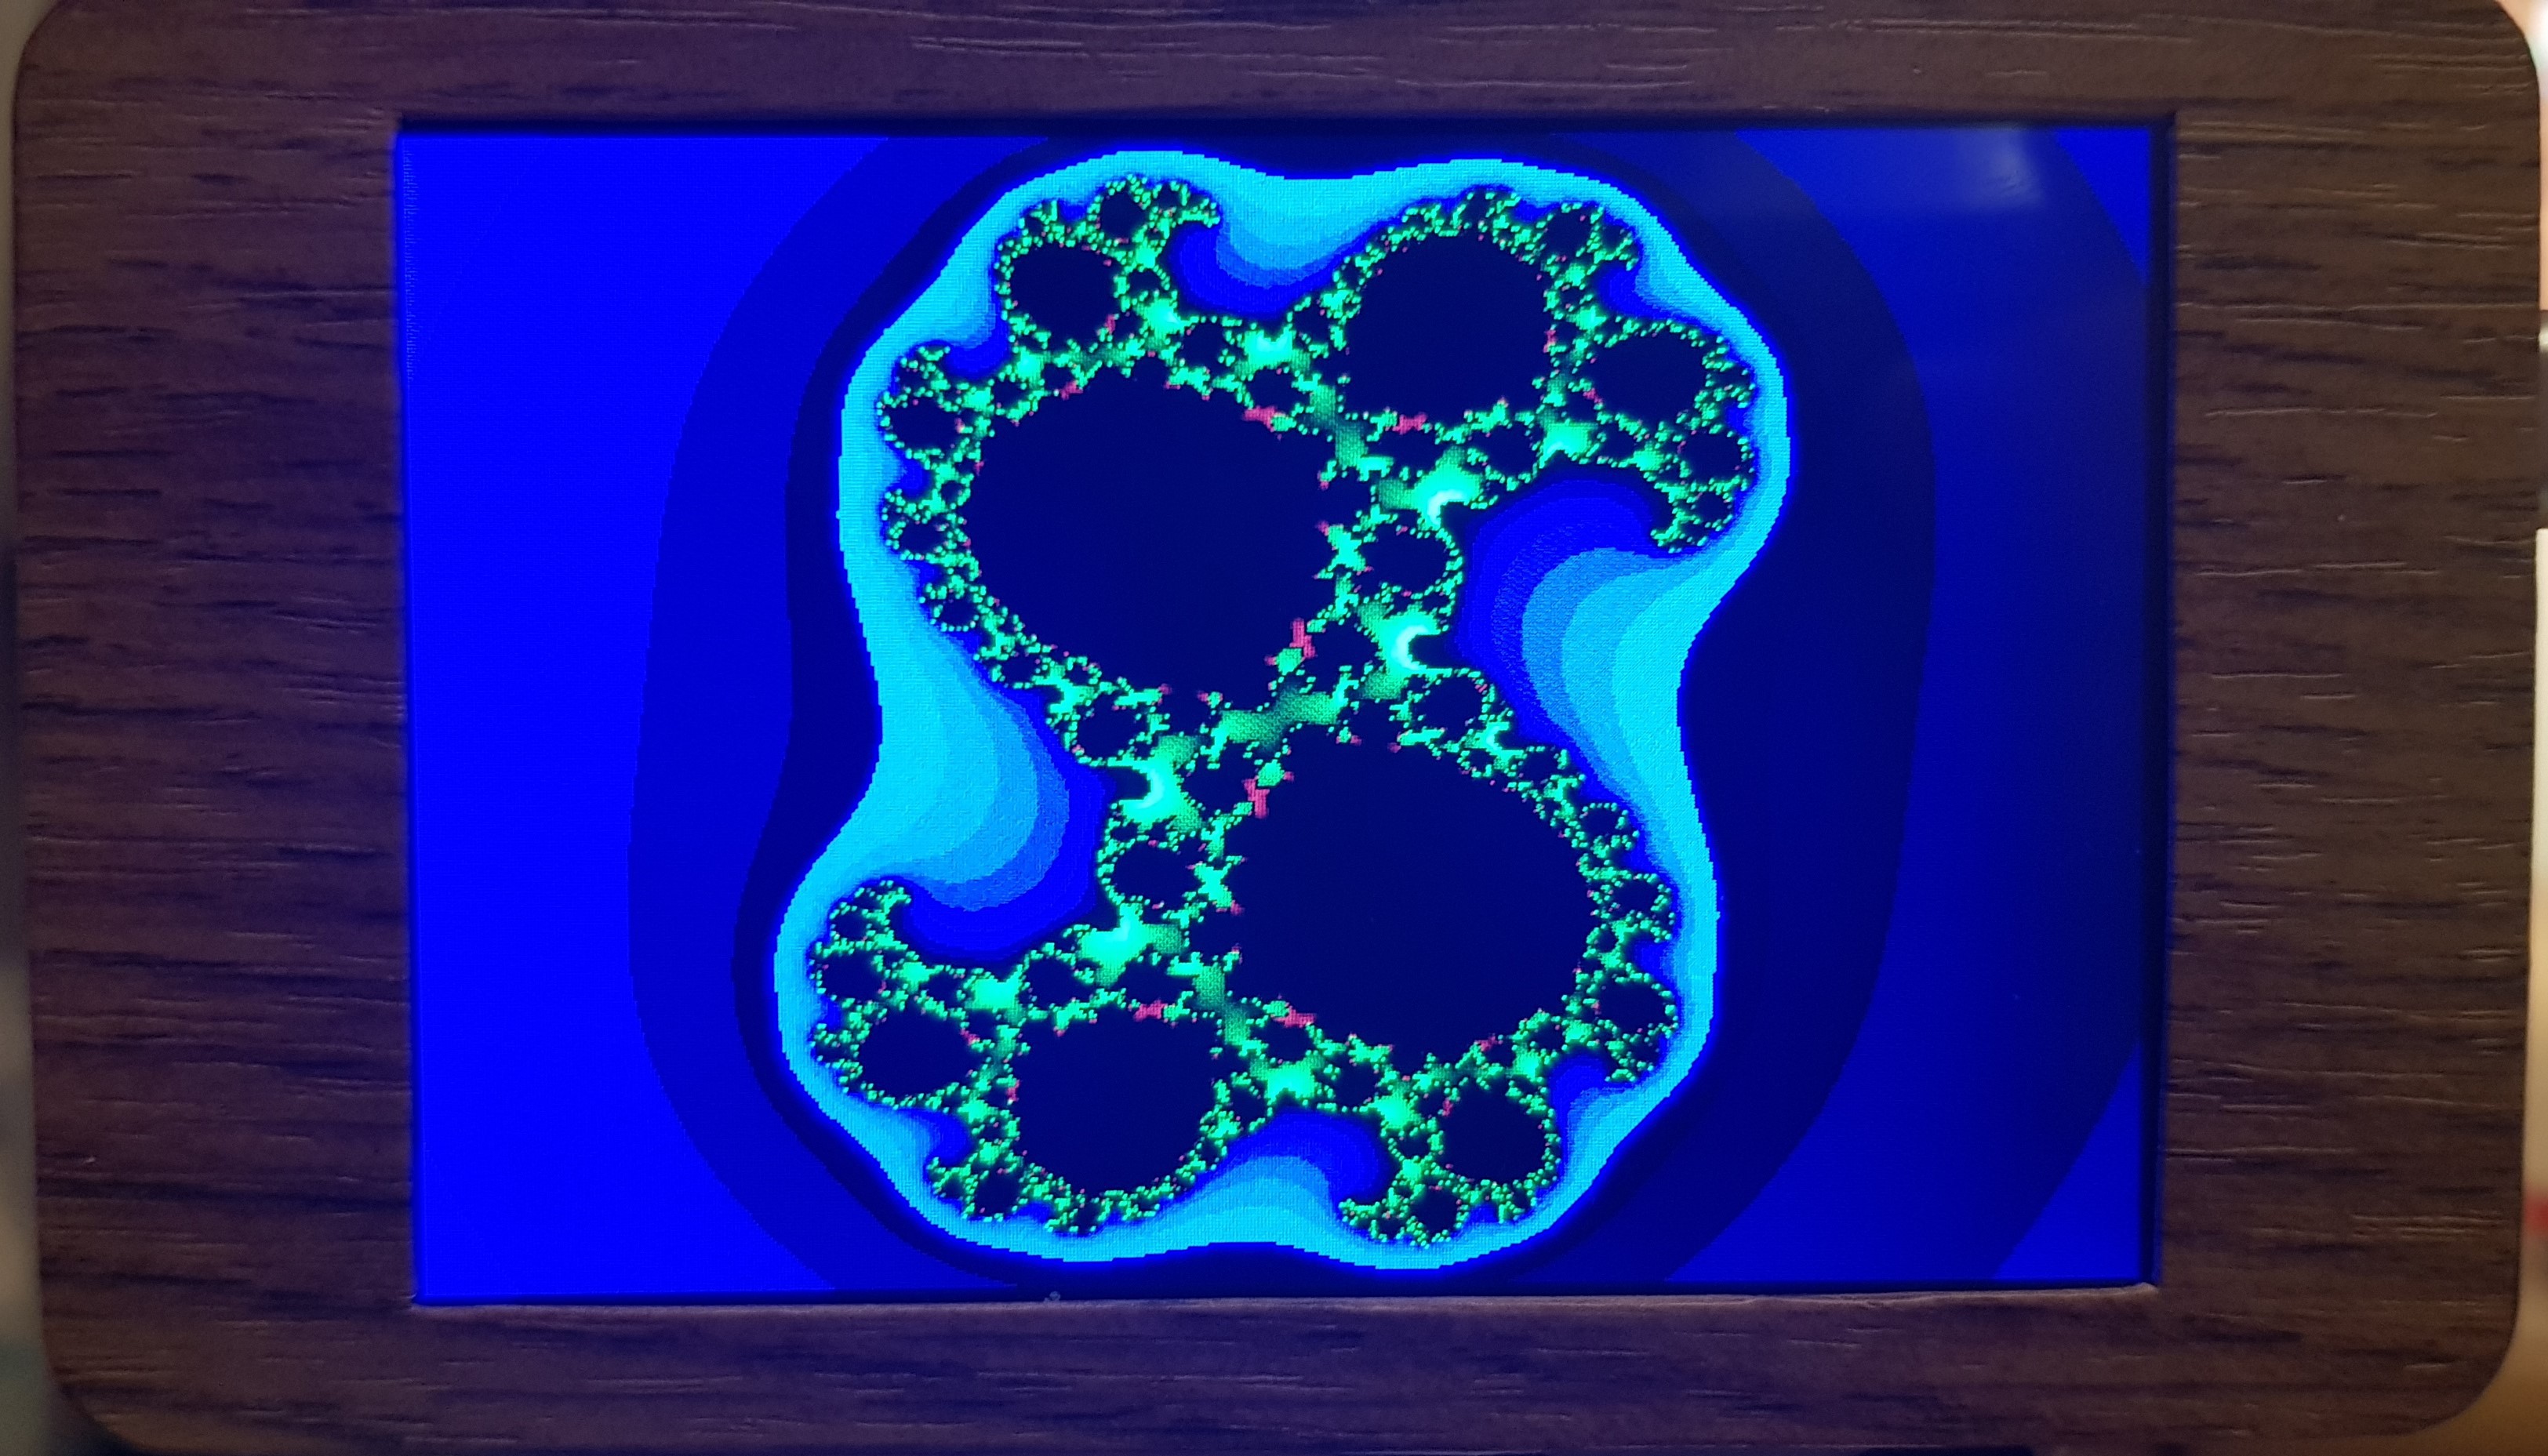
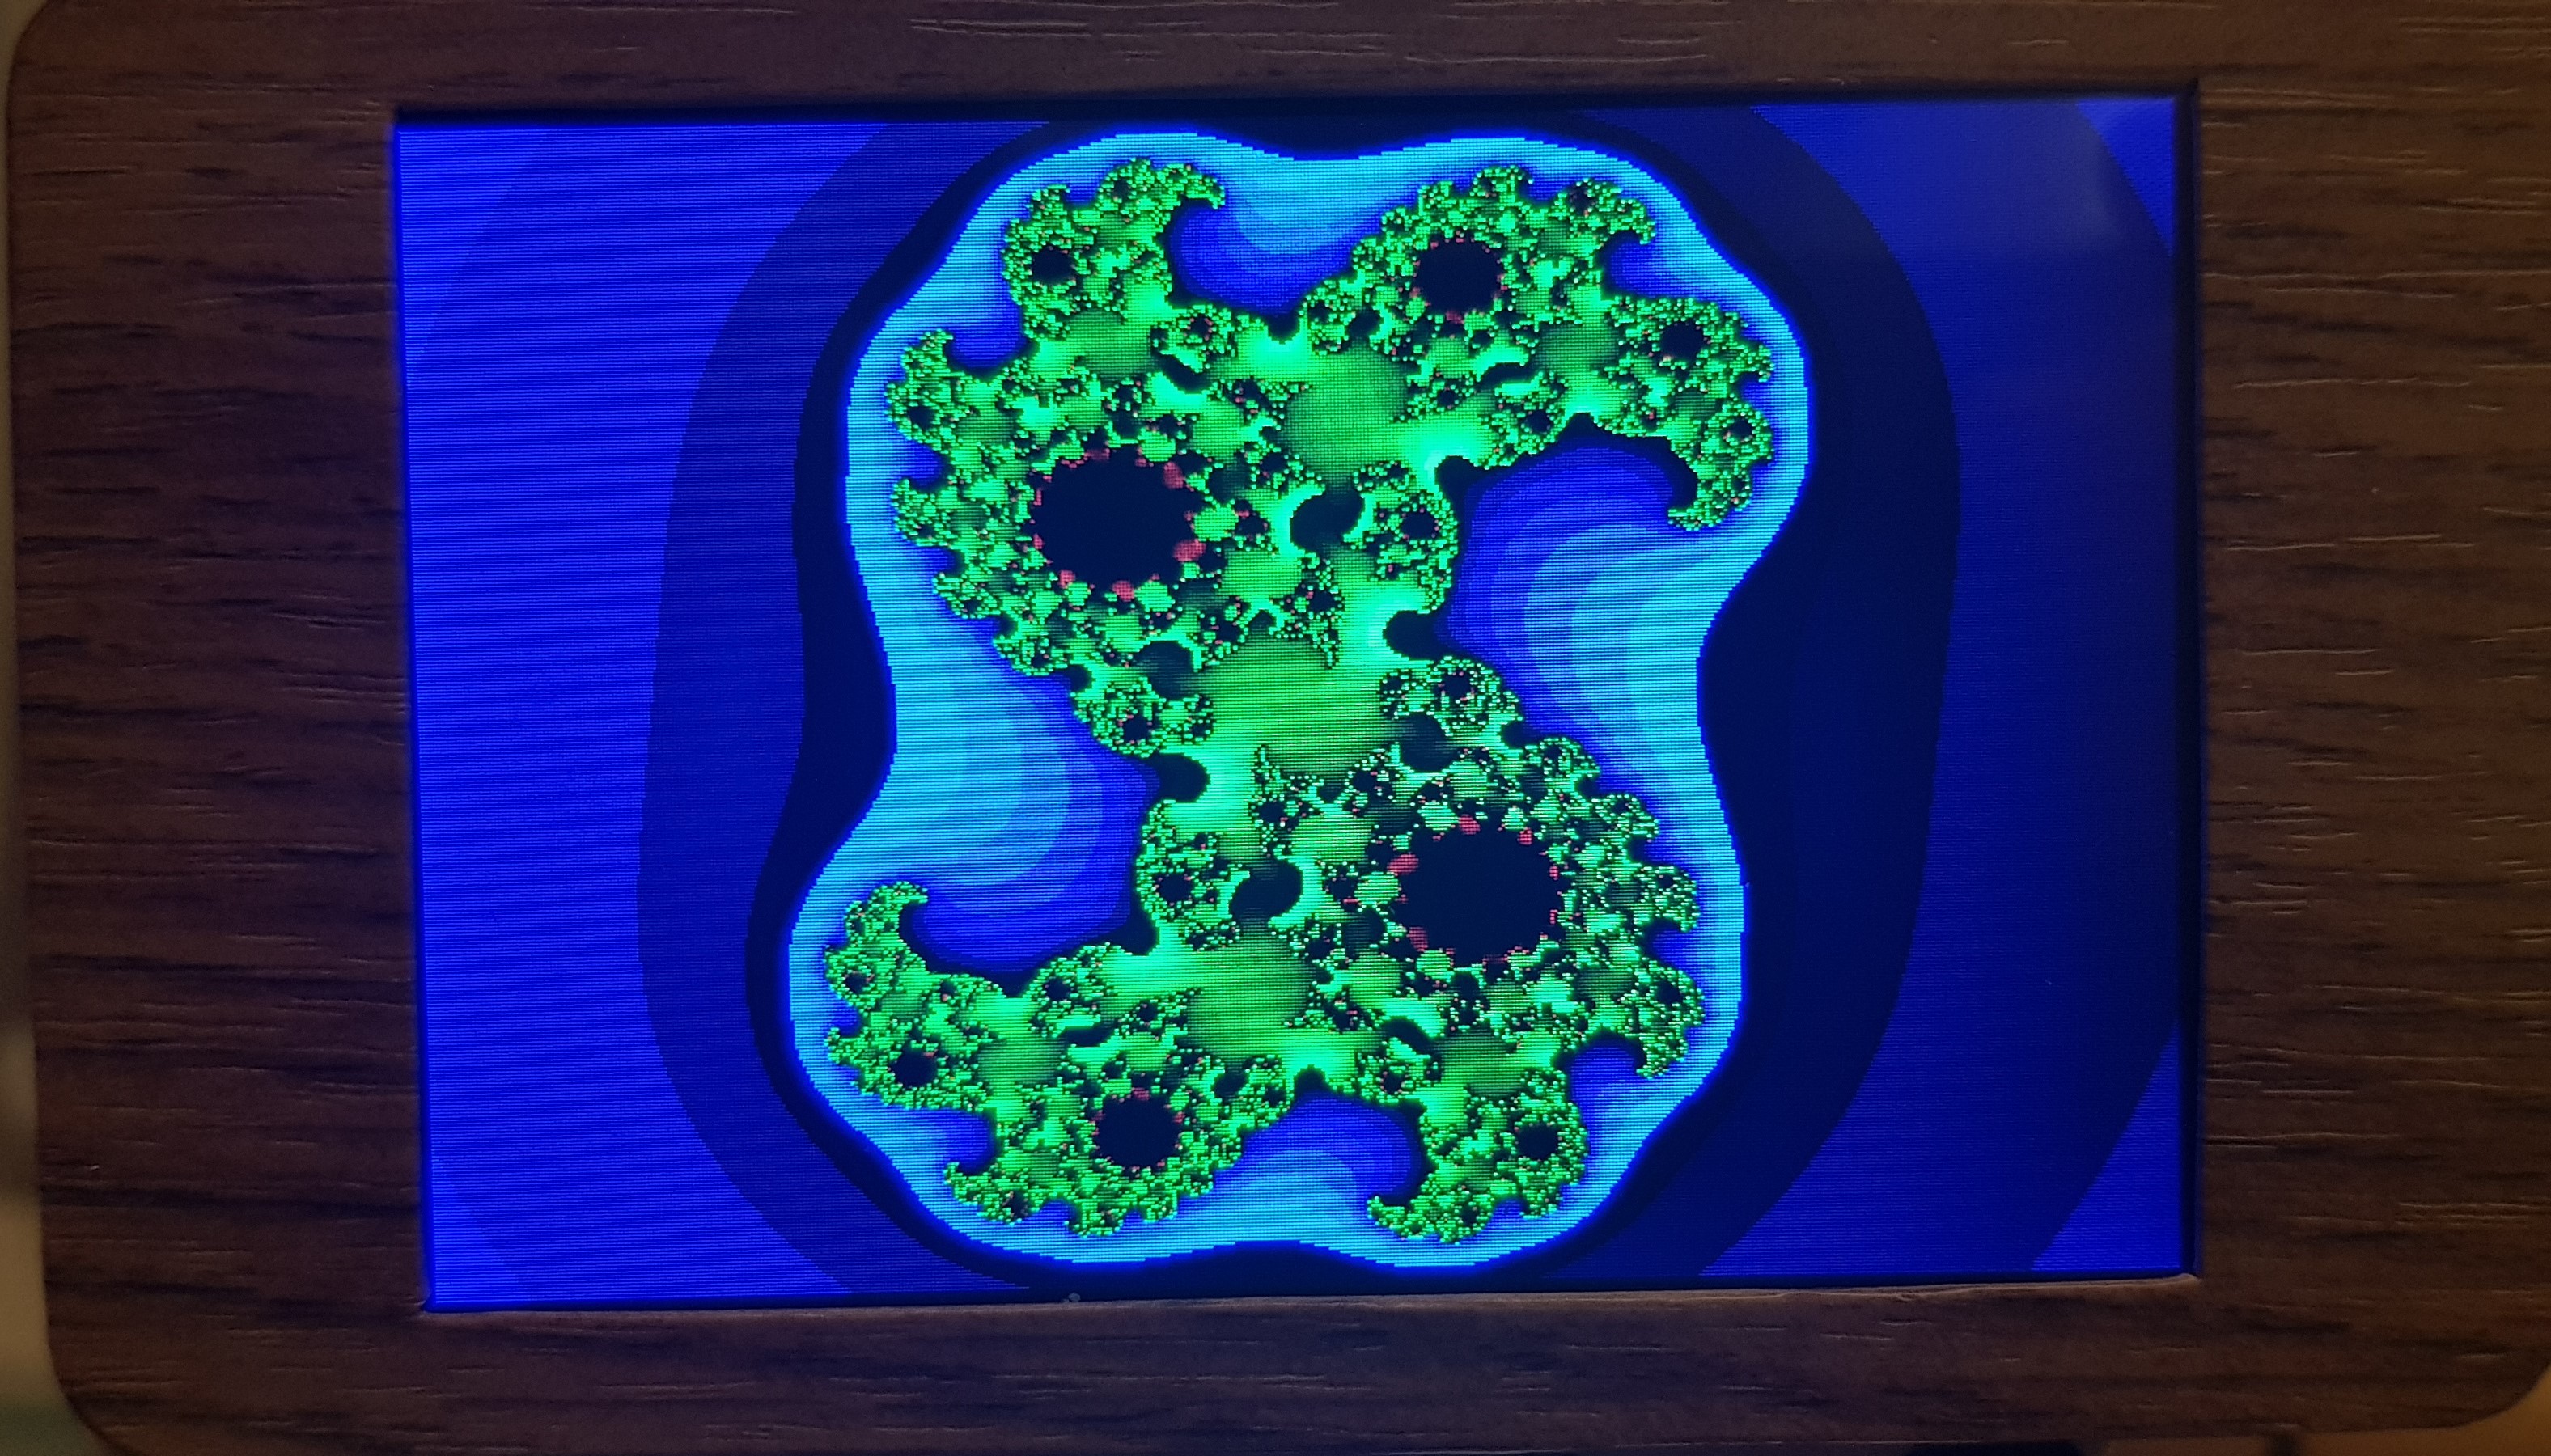
Screensaver:
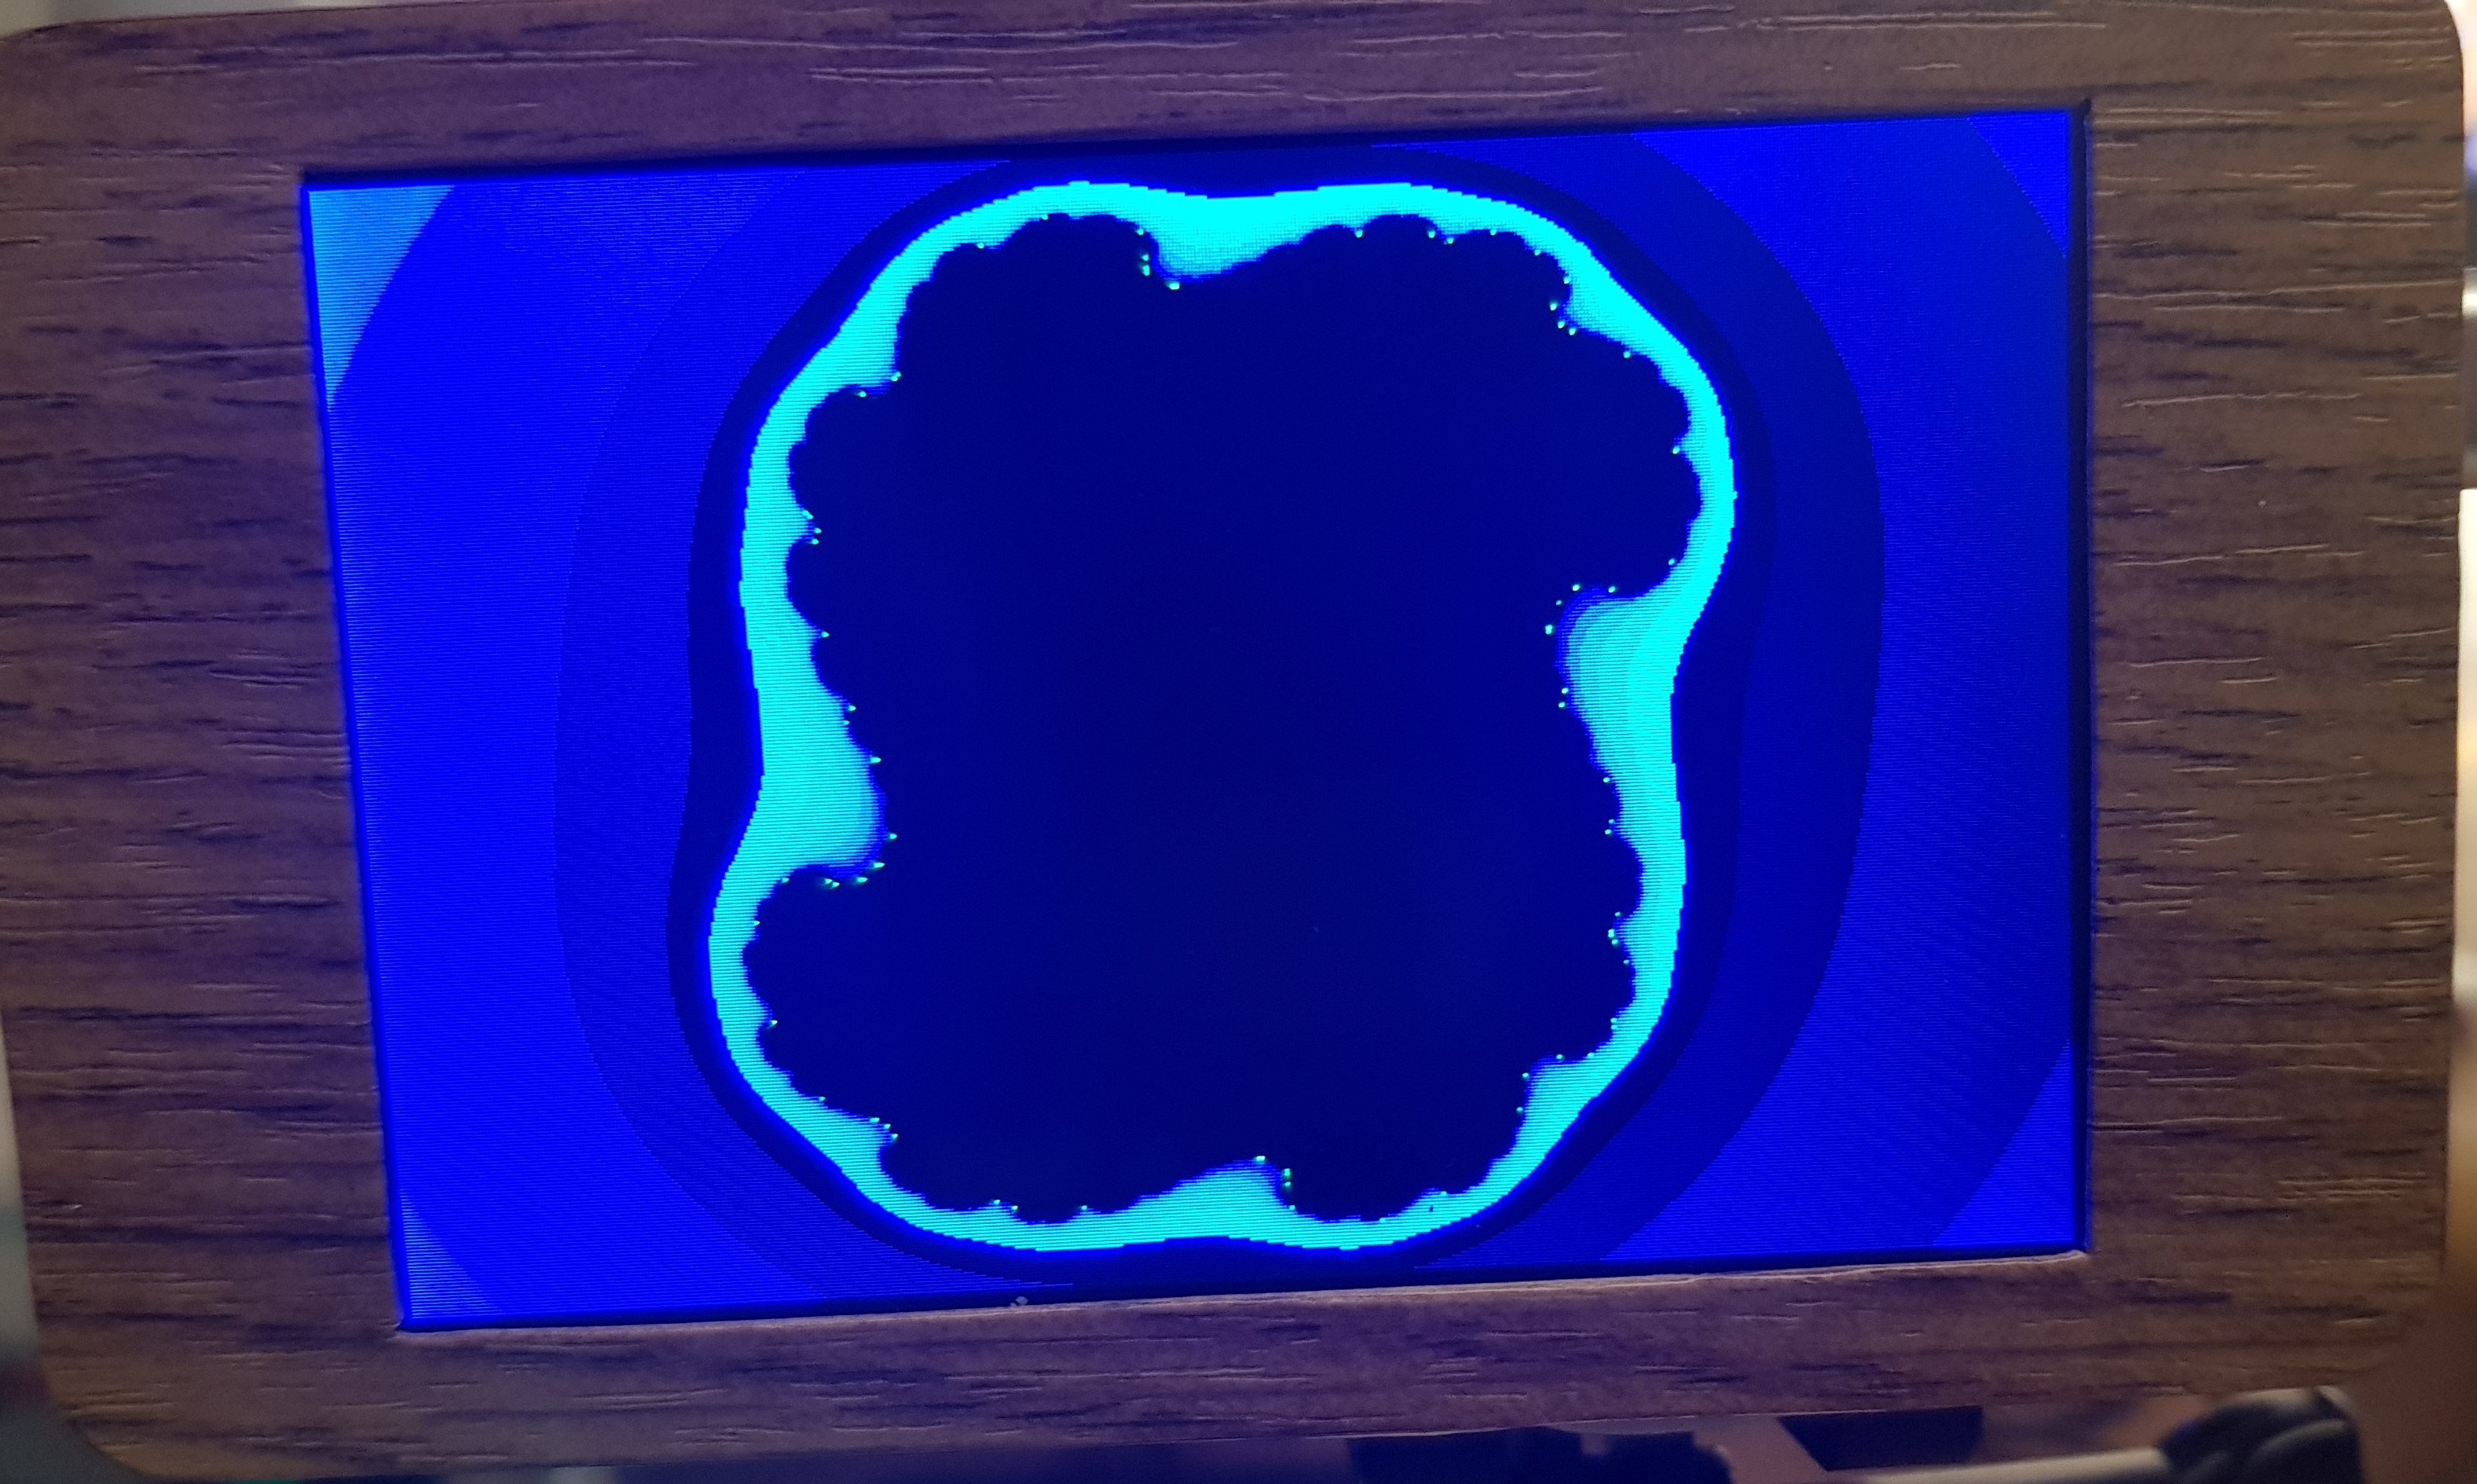
morphing Julia-Set (random initial settings with 242 200 000 million variations ! )
Future hidden Easter Egg:
working 8x zoom able Mandelbrot/Julia-Set (random color palette and Mandelbrot or Julia-Set)
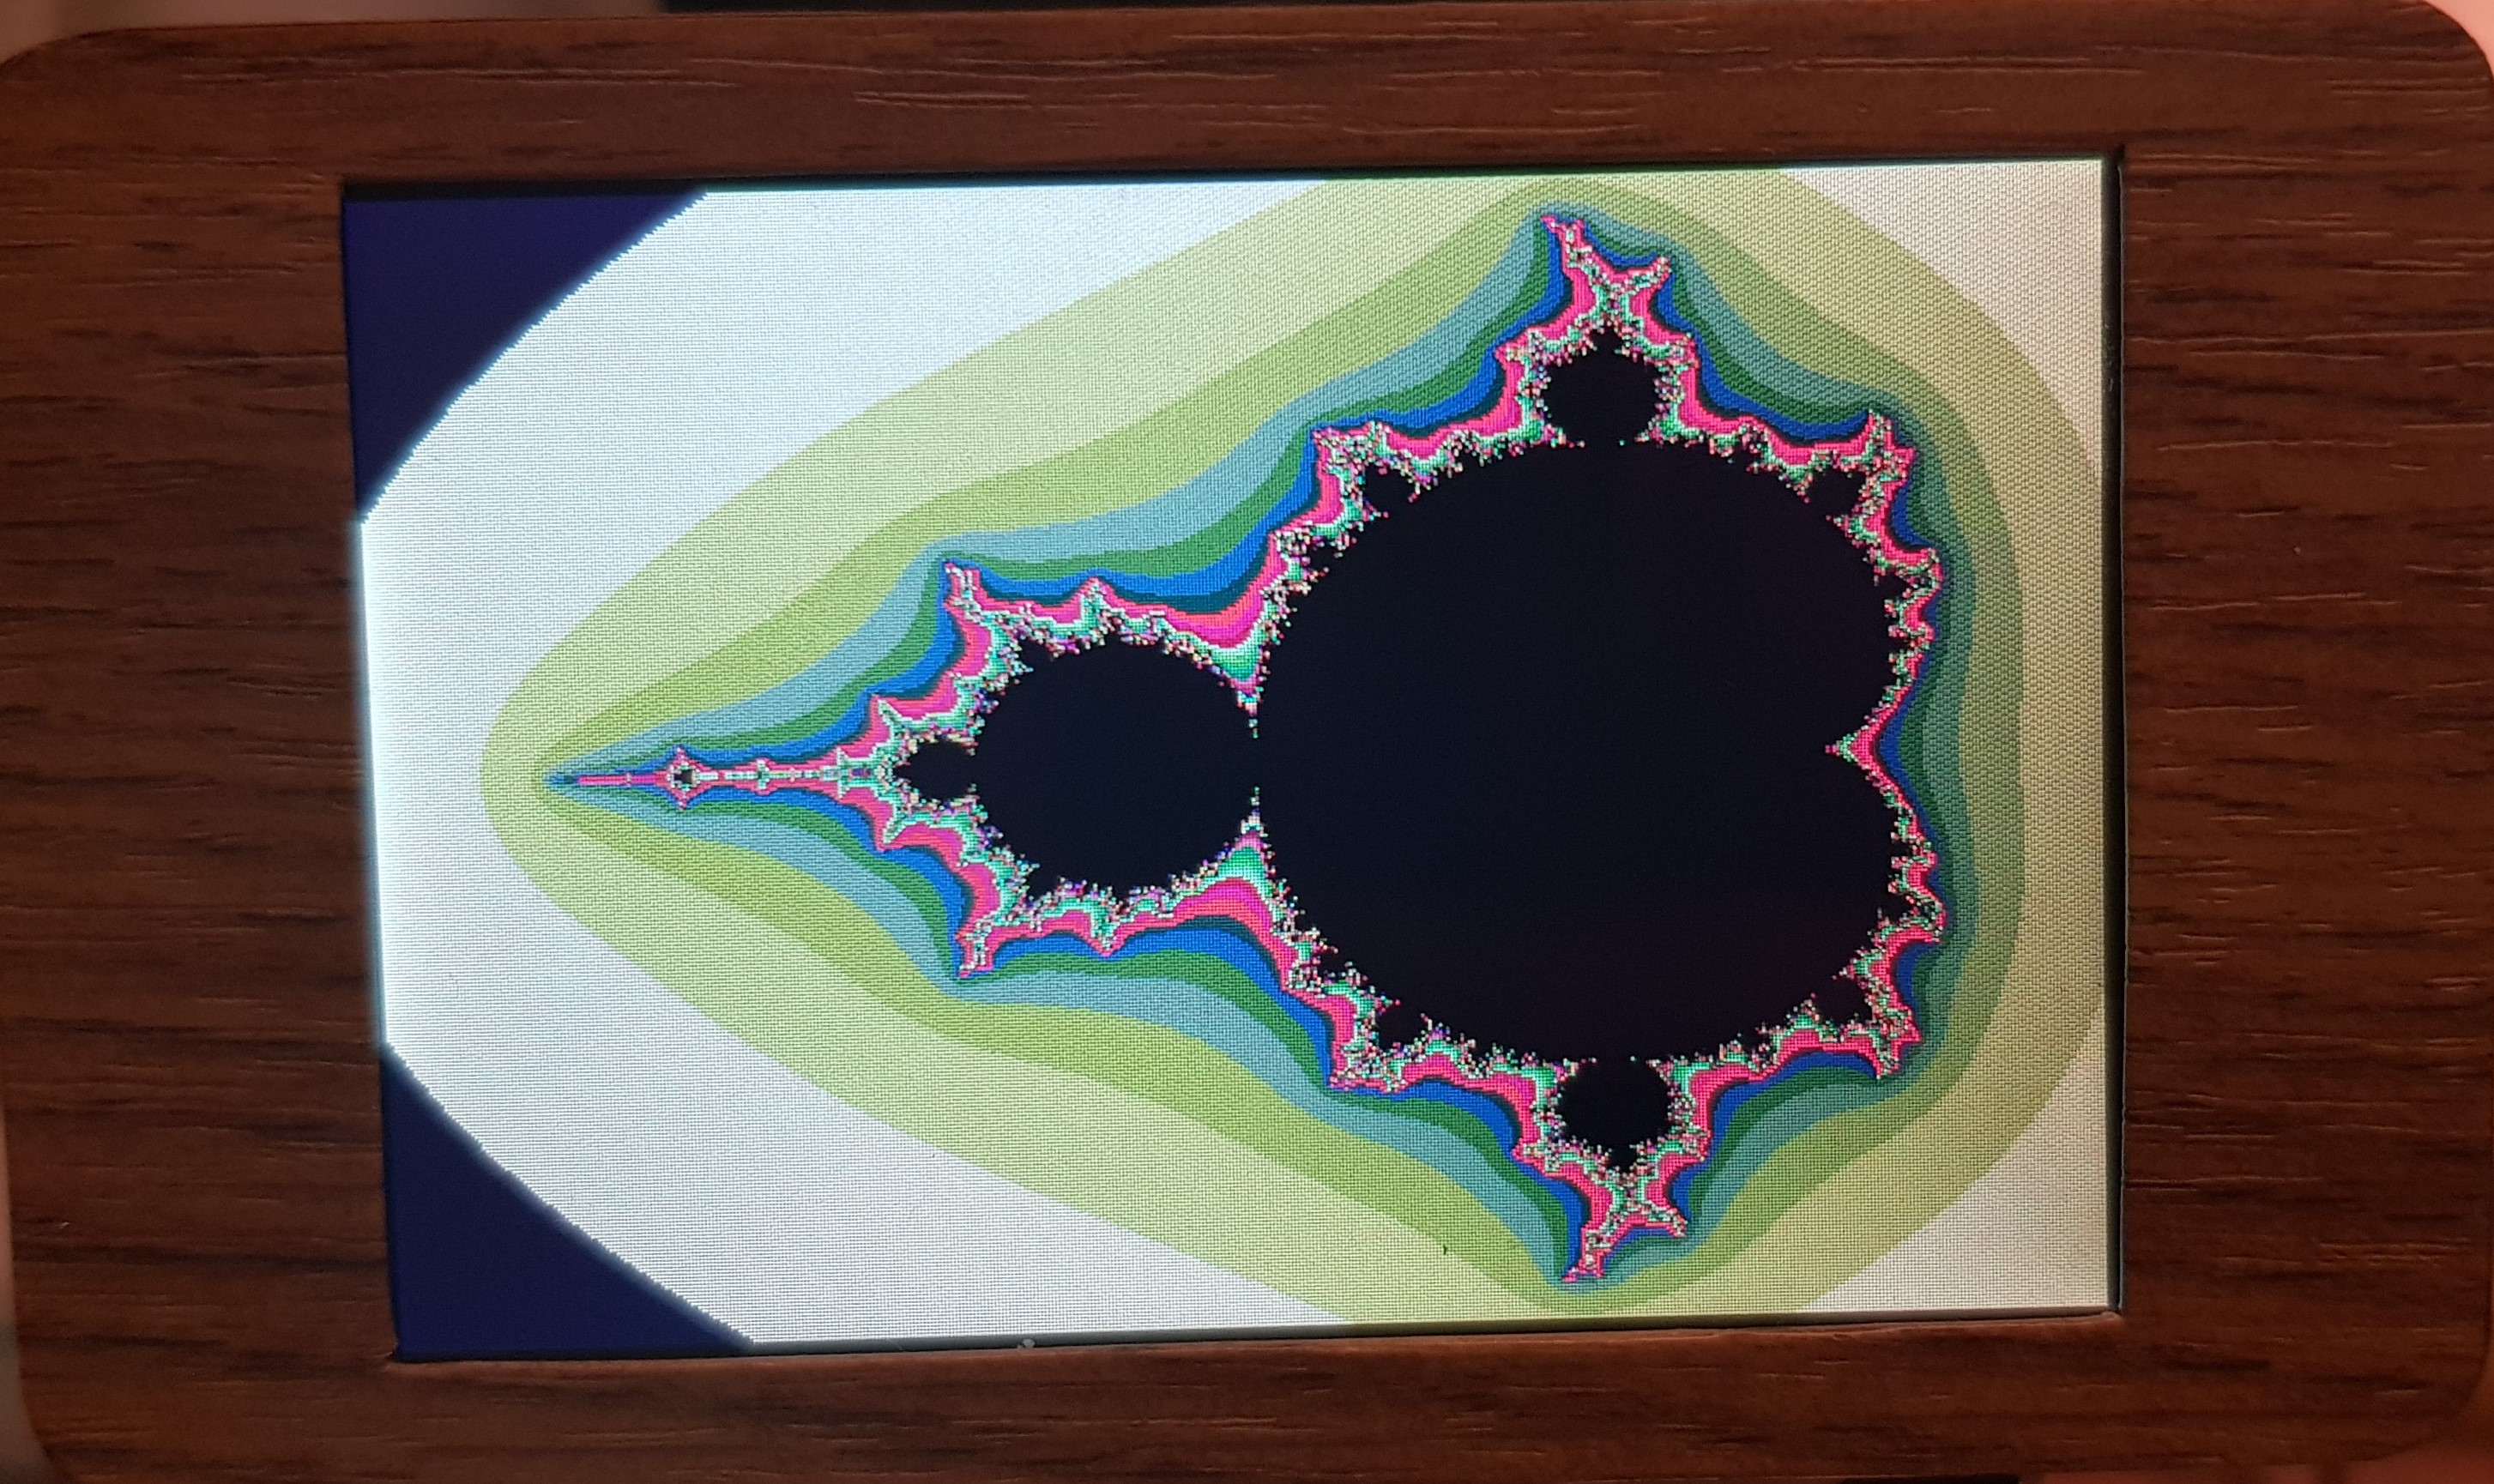
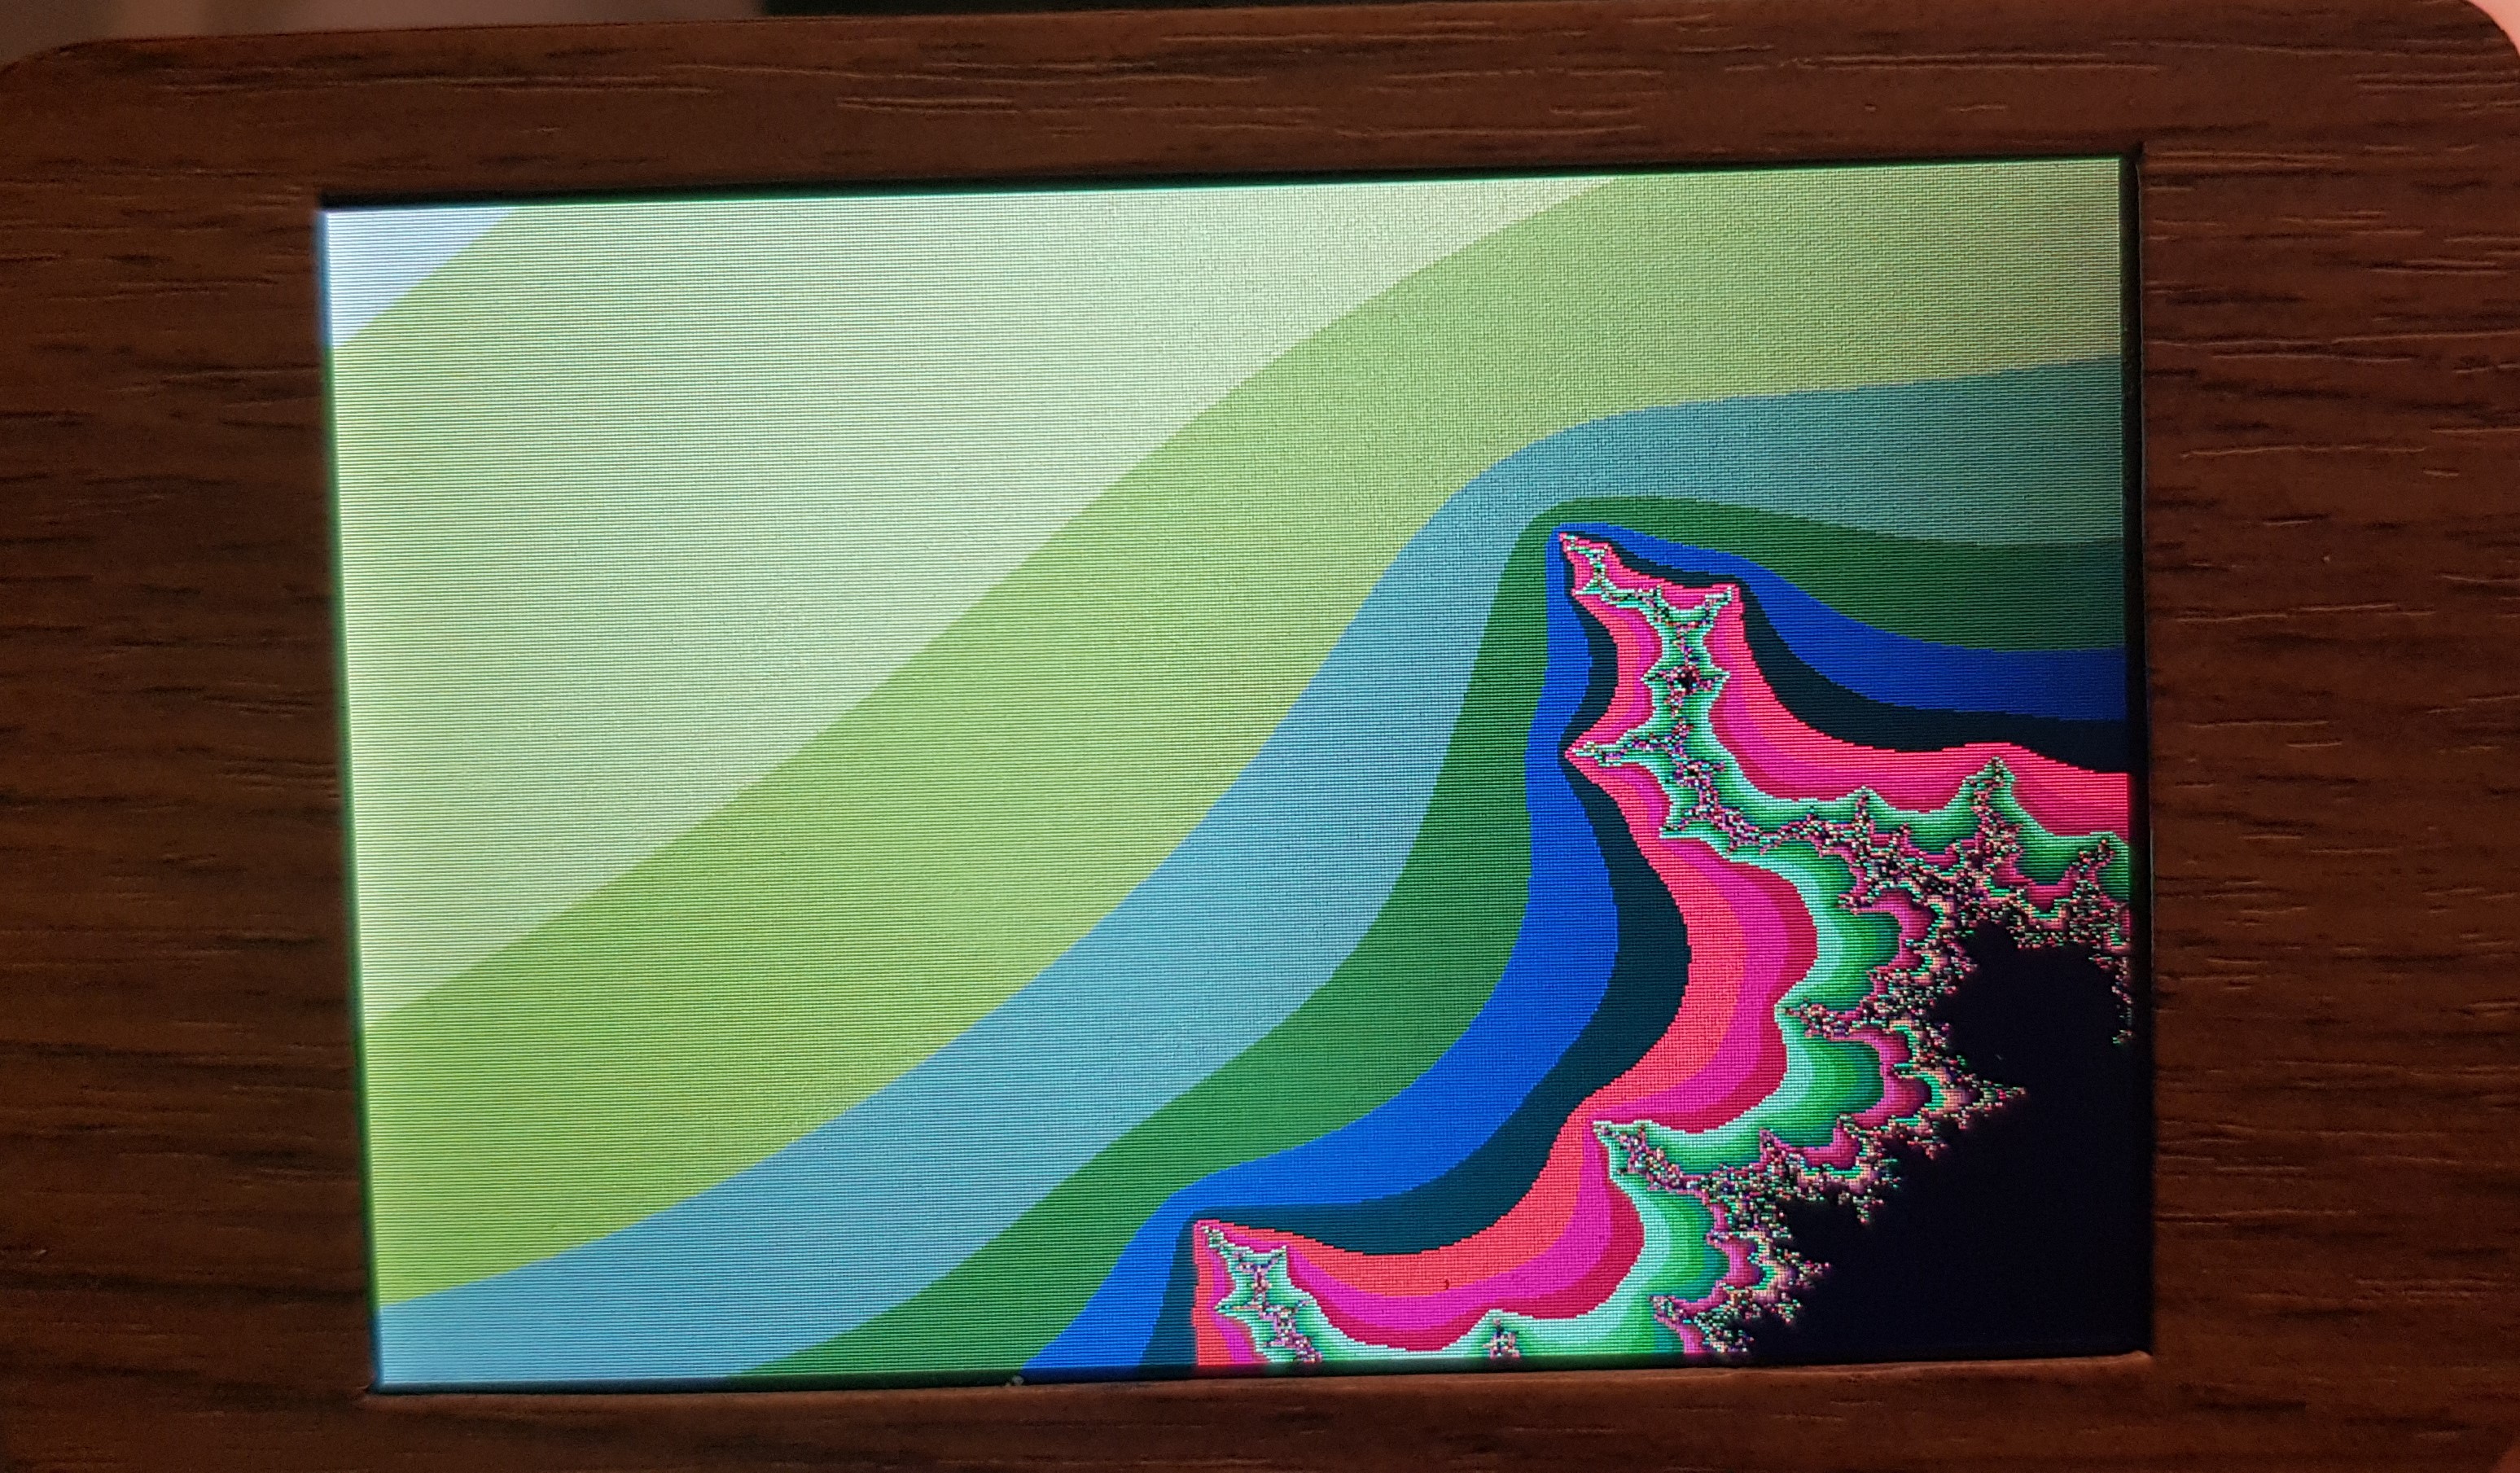
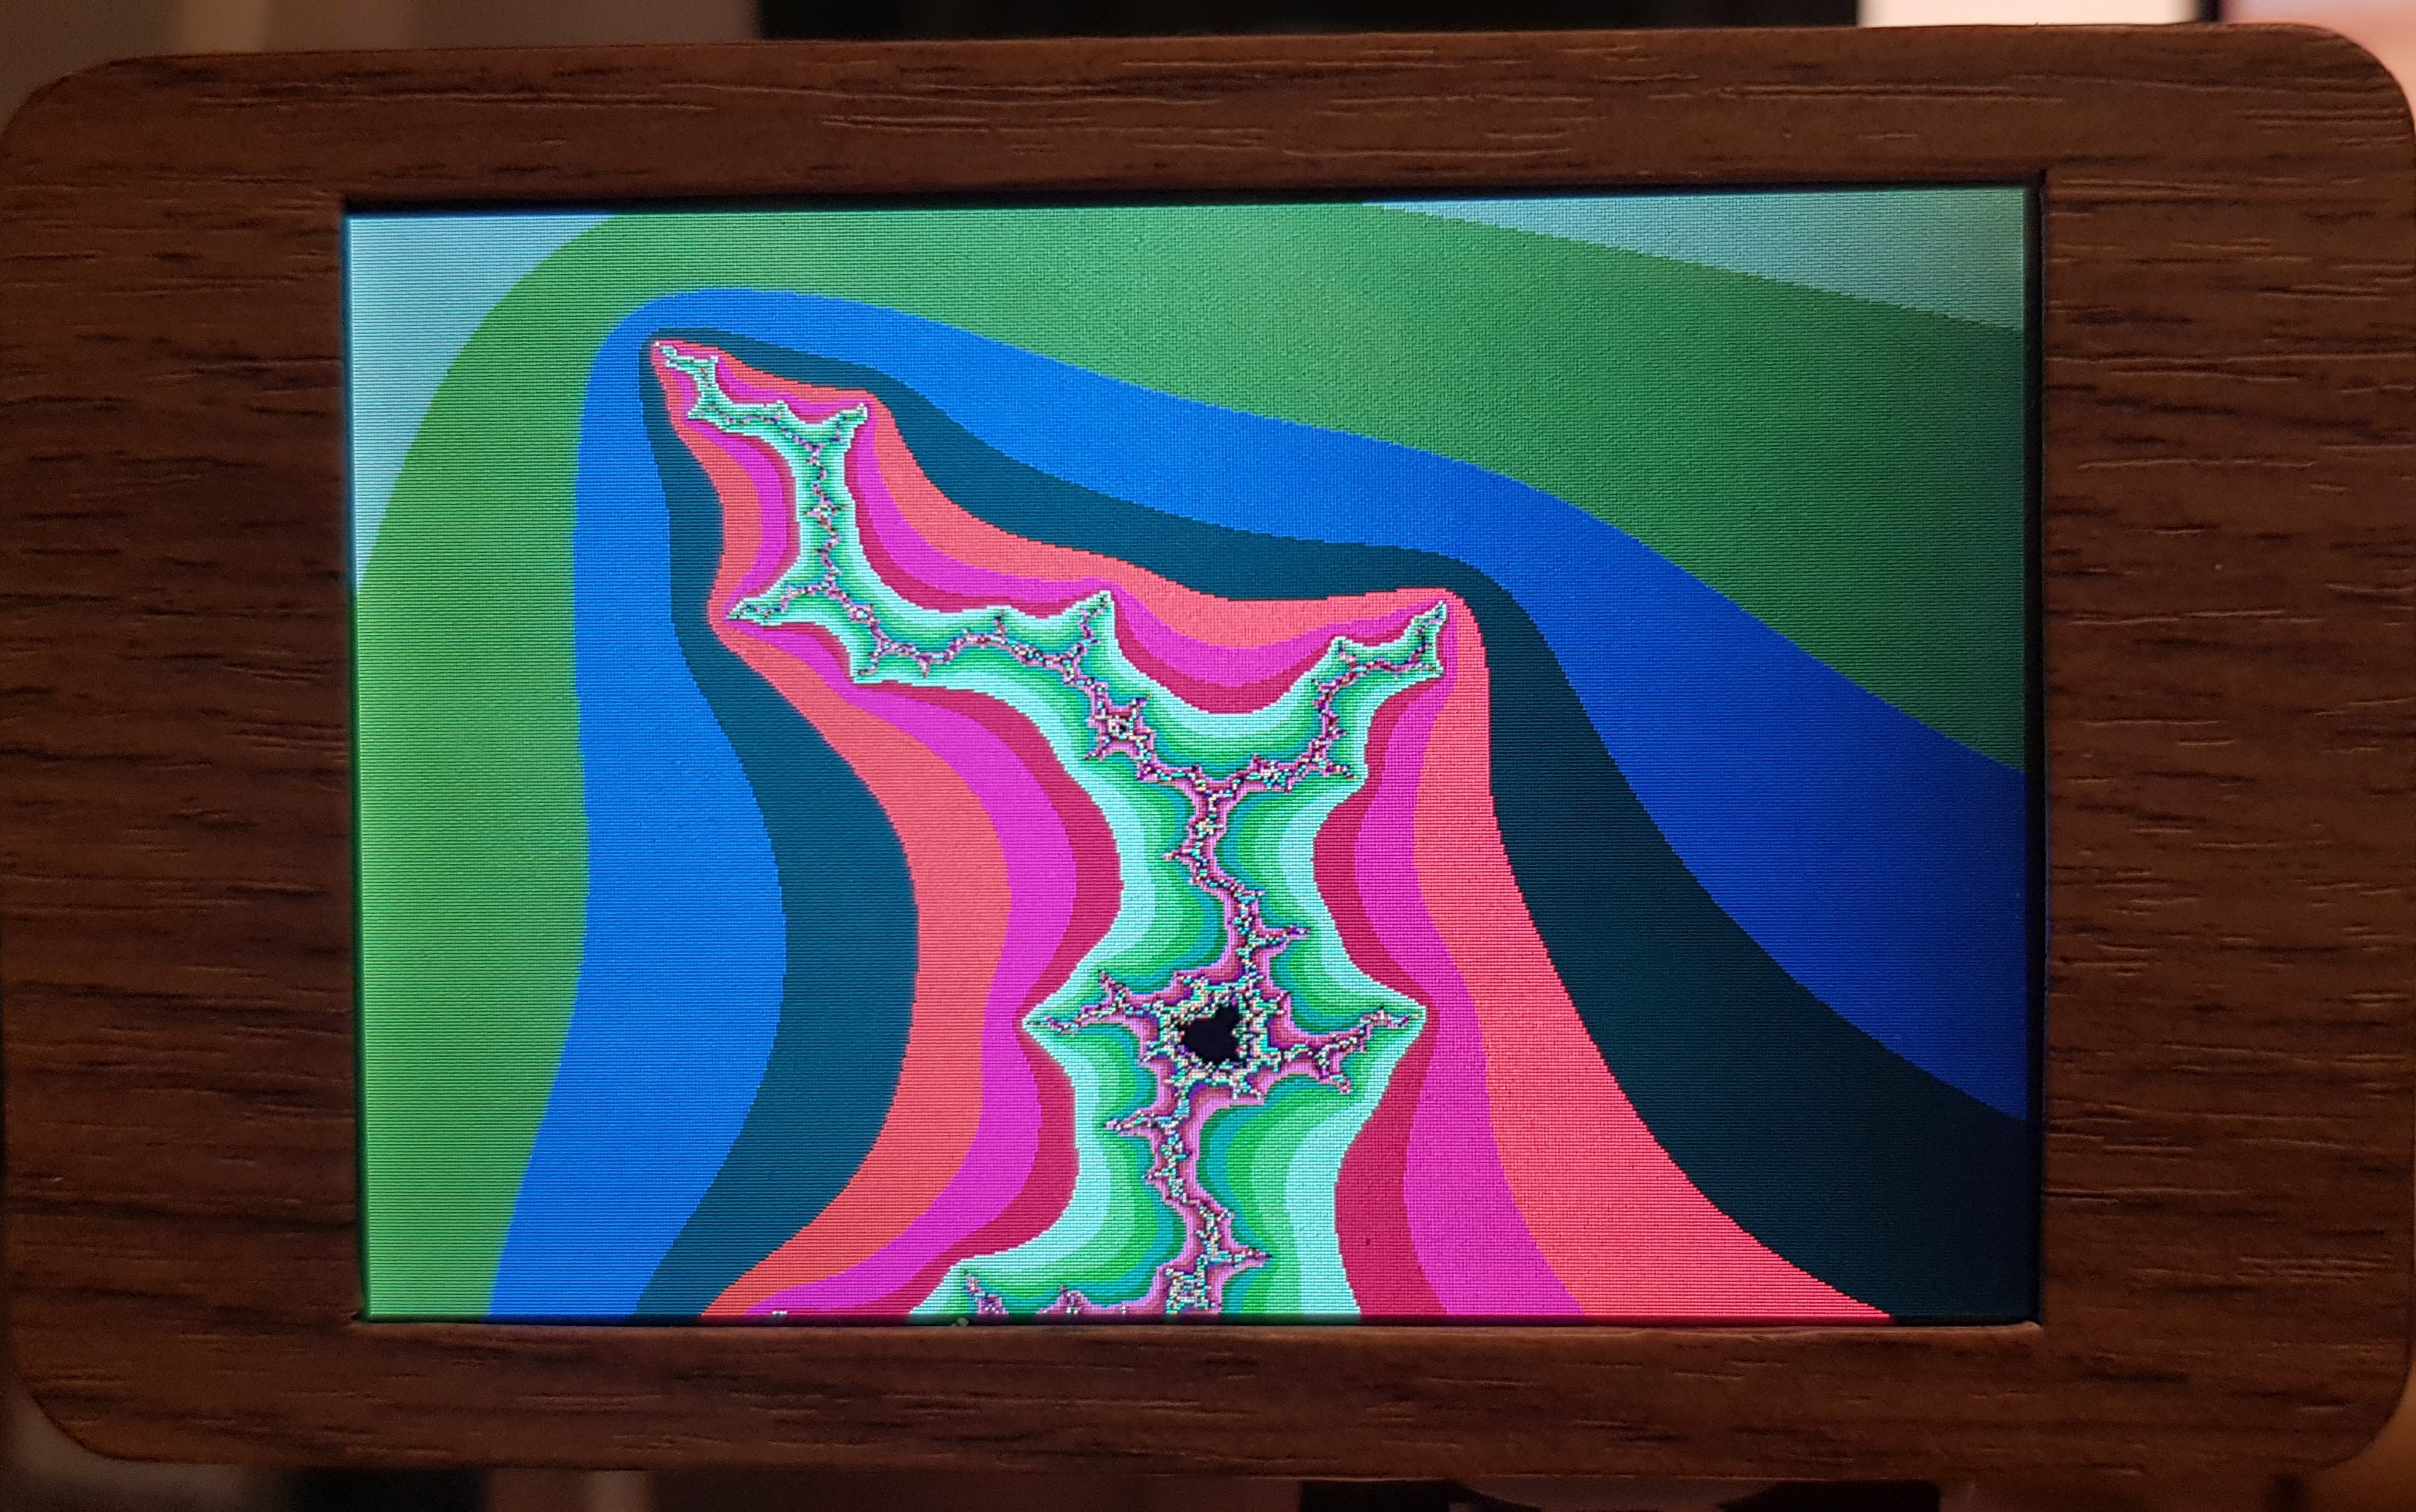
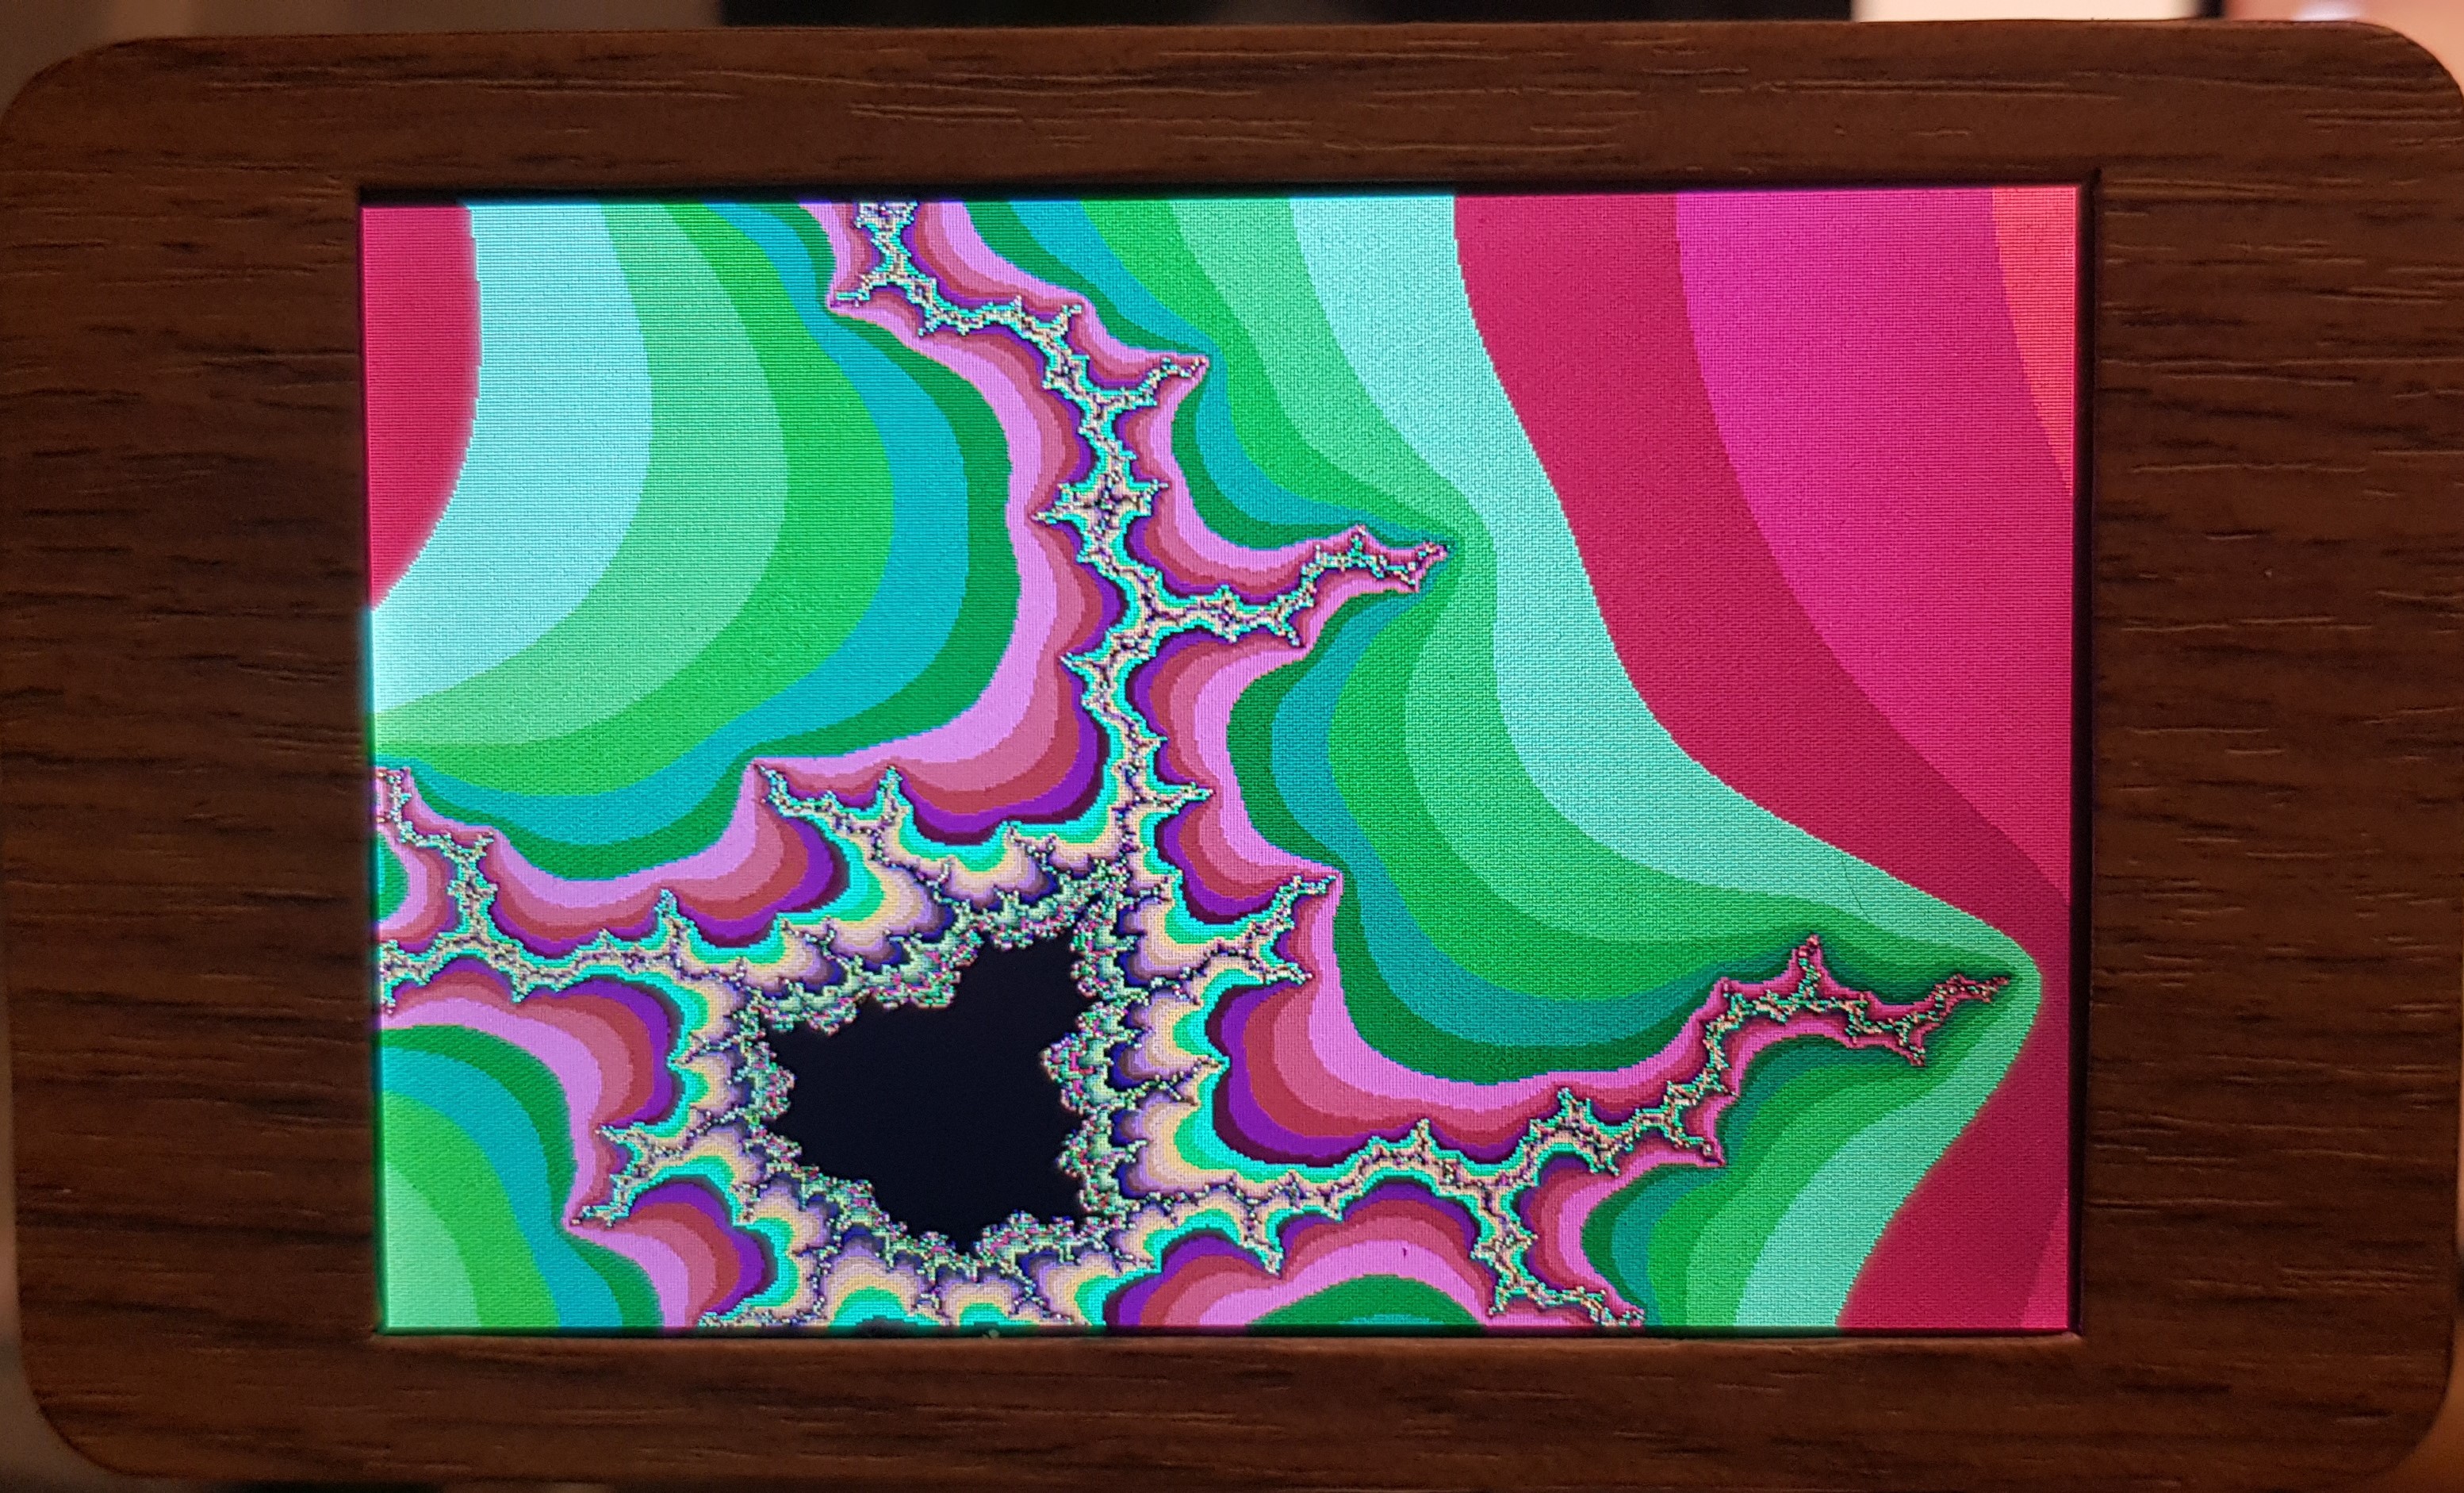
Code for Mandelbrot here: https://www.instructables.com/Mandelbrot-and-Julia-Sets-on-ESP32/
Future plans:
- combining different sensor data for more information about some sample
- mixing a physical reference white for reflection coefficient
- using a SD Card to save measurements in CSV format
- WiFi + html with graphs and .txt-file output (is it possible?)
i found those projects stream measurements to a client via html:
for the spectrometer:
https://hackaday.io/project/174401-spectral-esp
for the thermo cam:
https://hackaday.io/project/169447-esp-thermal-camera-streamer
I'll investigate that in the future. Maybe there is a way to run that on the 2. core of the ESP32, so the performance/fps doesn't drop to much.
... and much more. But it feels 76% done.
Hardware:
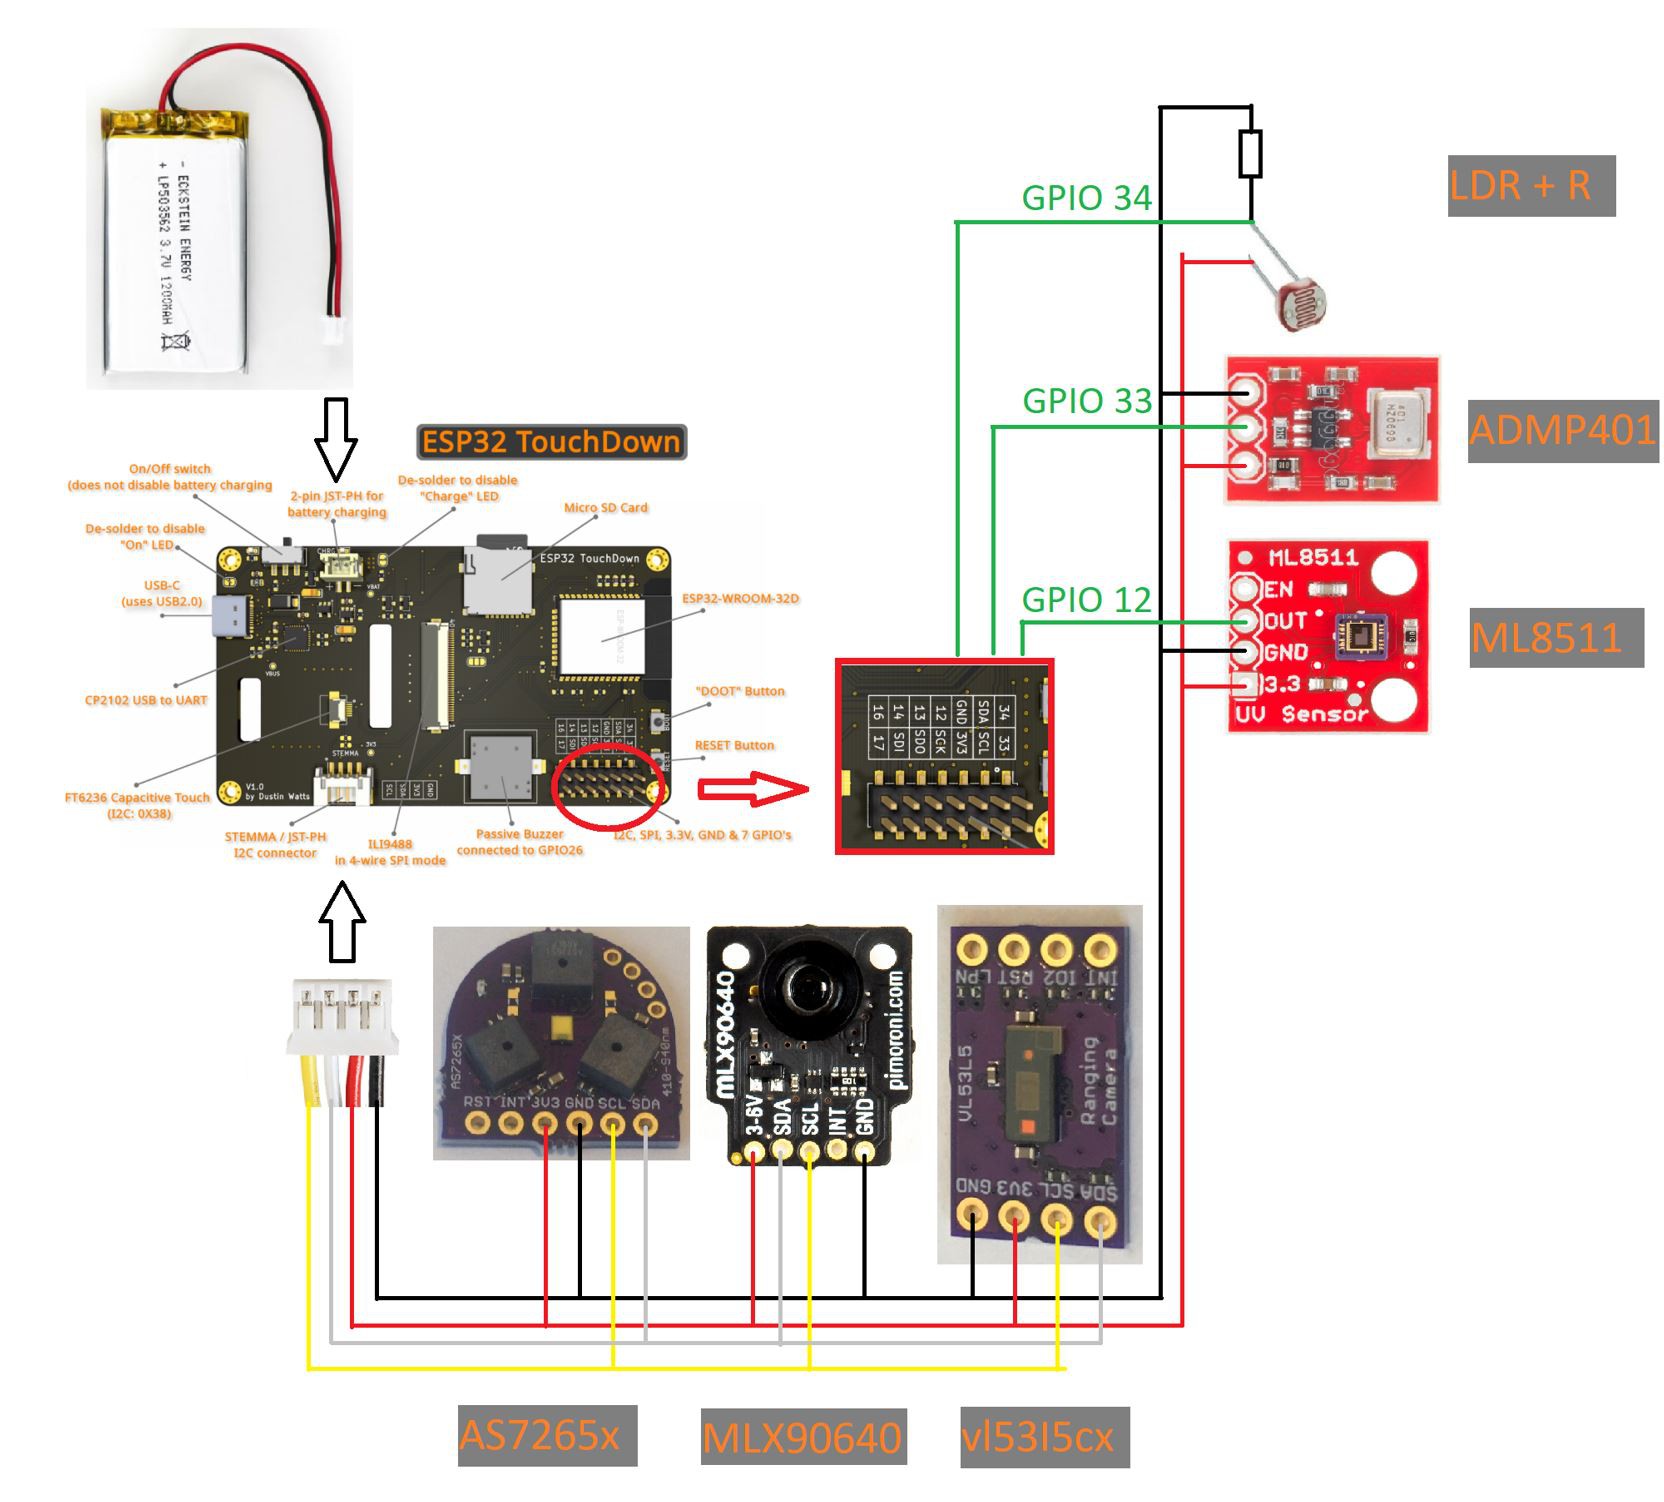
+ ESP32 TouchDown by Dustin Watts
-480 x 320 pixel Touch Display
https://www.tindie.com/products/dustinwattsnl/esp32-touchdown/...
Read more » j
j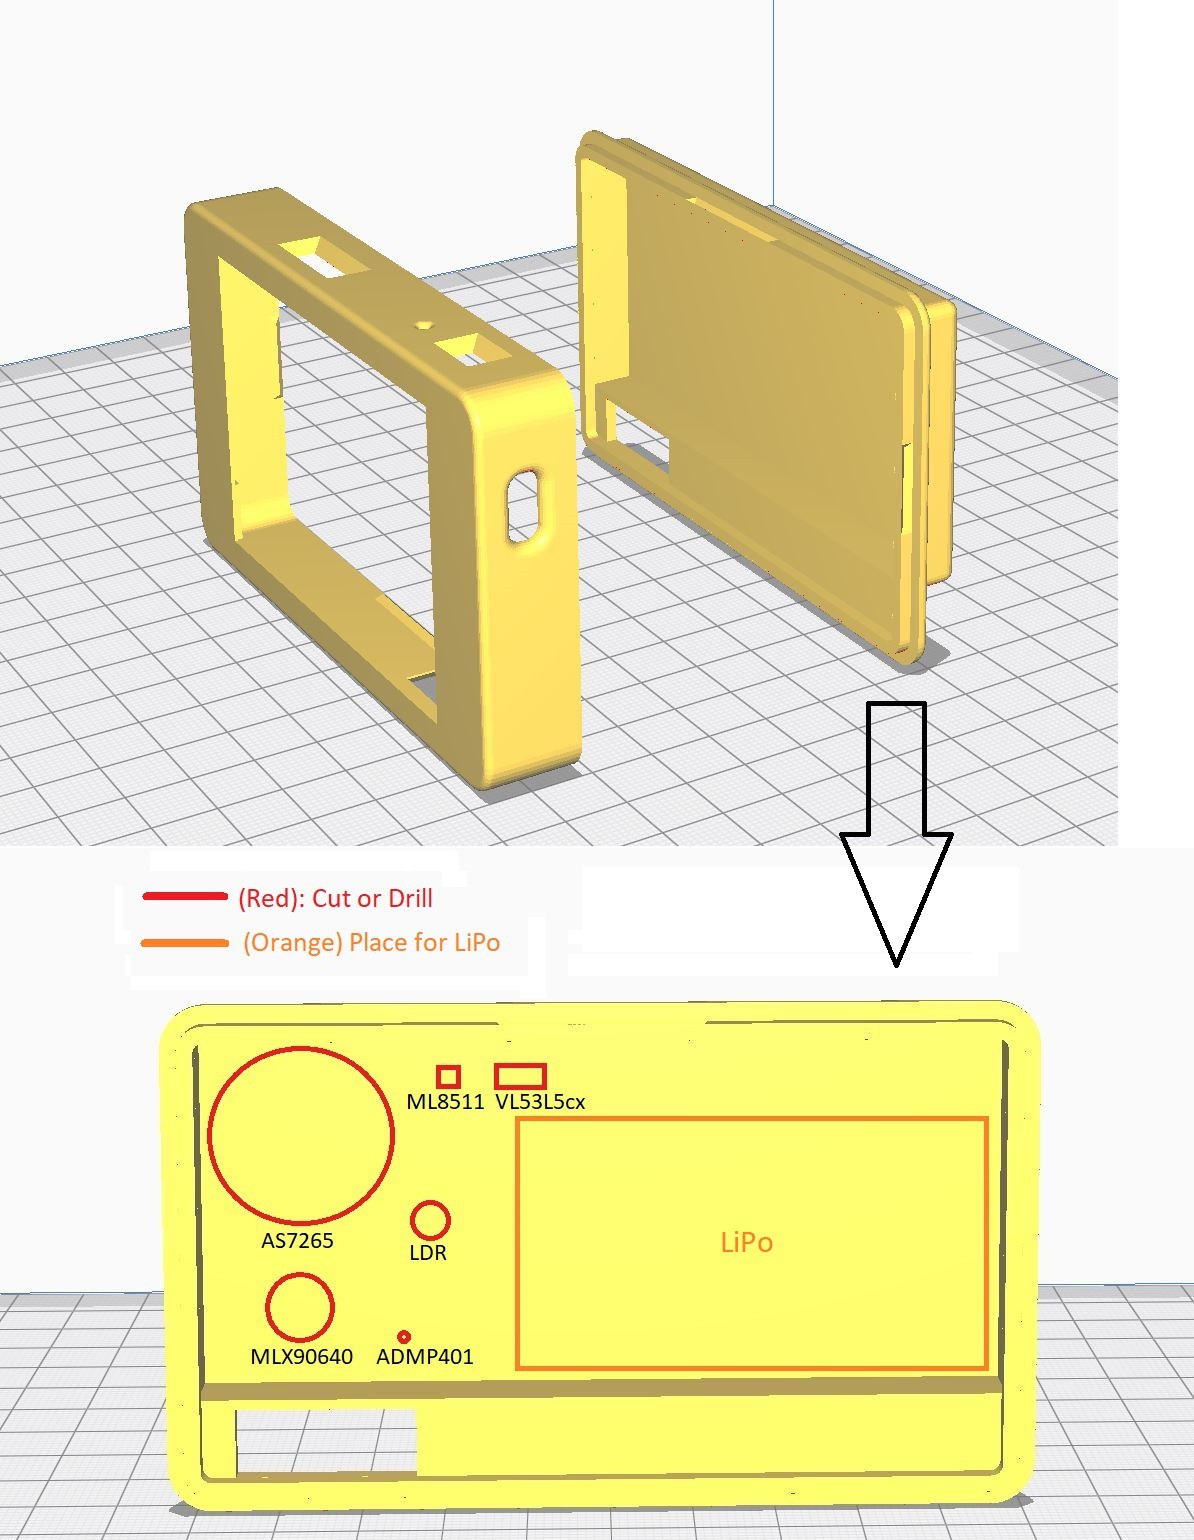
 kwan3217
 Simon Merrett