jumplogger dashboard
Jumplogger is a next generation skydive jump logger: a combined digital altimeter, GPS tracker, motion sensor and a device that allows detailed afterflight/jump analysis.
Hardware
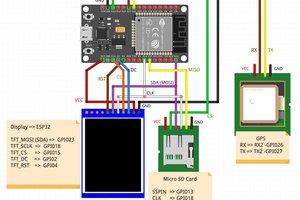
The unit is based on the versatile ESP32 Wifi processor. This gives not only enough processing power to handle complex math transformation but also offers an elegant web dashboard on your mobile phone, pad or desktop
- ESP32 WROOM dual kernel 32bit processor
- GPS data is recorded with the BN220 GPS module using the ublox M8 chip generation
- Pressure – and accordingly altitude – is measured with the BOSCH BMP388 sensor
- The IMU ADXL345 provides acceleration data
- A microSD card is added to store all tracking data
- For displaying data, a 128x64 monochromic transflective LCD is used
- Powered by a 1100mAh LiPO battery plus charger, giving ca 10hrs continuous operating time
More info on CRWDgs.com
Dashboard app
For displaying the collected data of the jumplogger, a dashboard web-app is used. This opens in a normal web browser on laptops and desktops, for mobile devices a browser or a natively compiled app can be used.
In the current prototype, the device acts as a webserver, generating and delivering the complete HTML code to the user browser. Because of the limited resources, this doesn't make sense. This web-app should bring all data interpretation to the server and only communicate with the device via WIFI and Ajax calls to collect the necessary data. More data should be collected from external websites and aggregated in the dashboard.
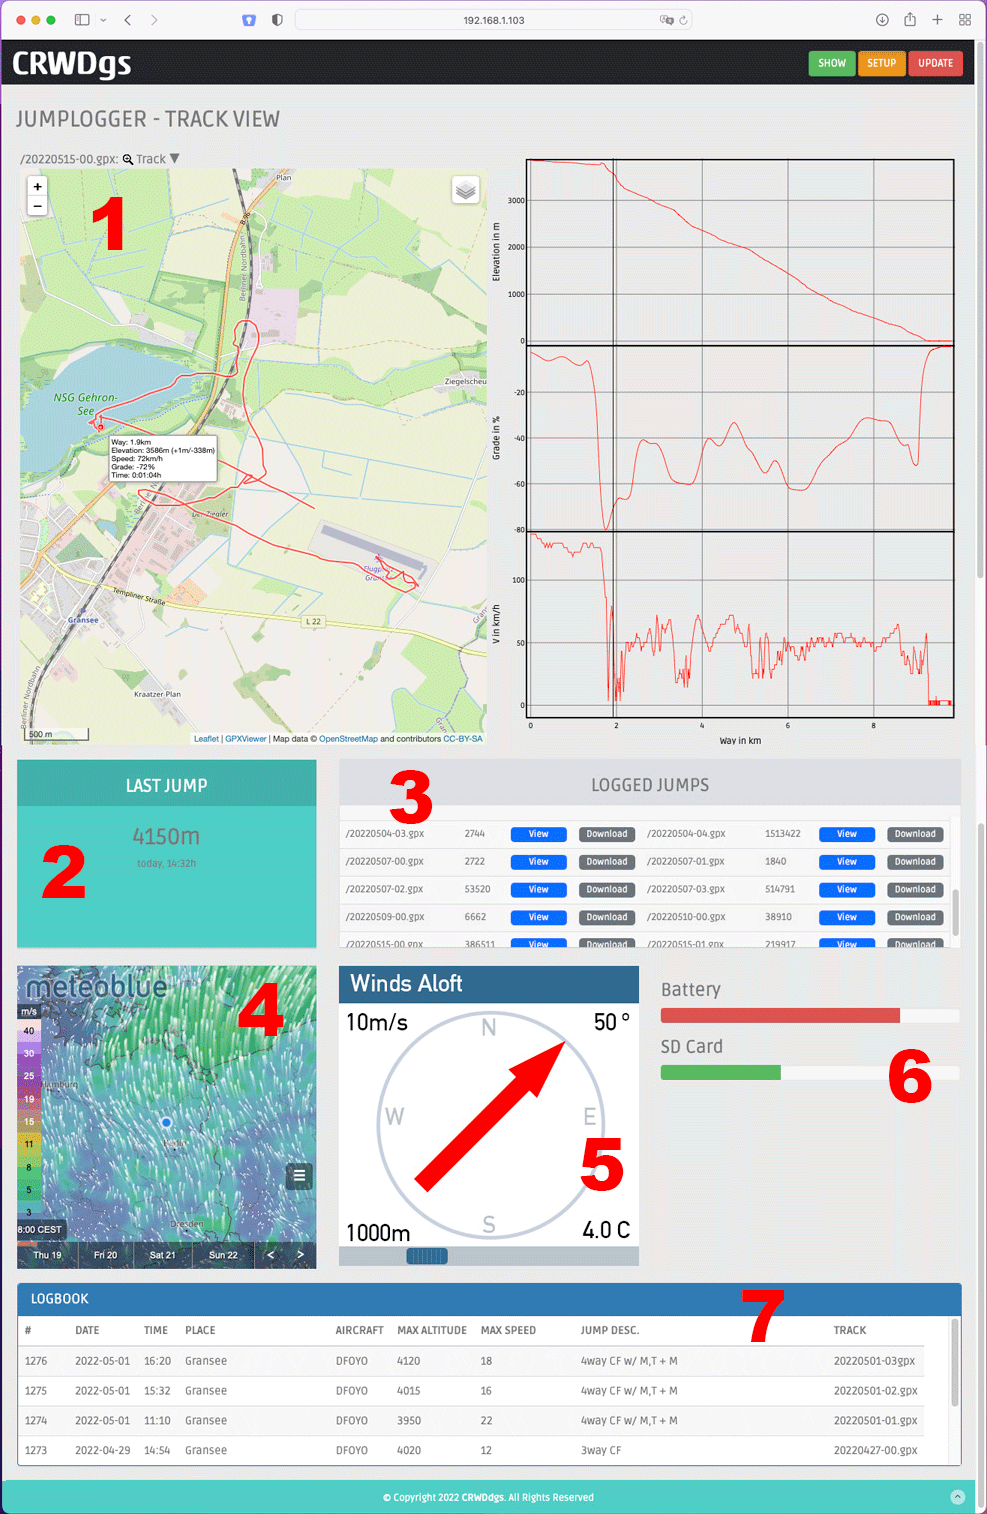
GPX track visualization (1)
One main function is the GPX track visualization. This owns the upper half of the screen. The track visualization is done by the ready-made javascript GPX Viewer. Tracking file from the SD Card file is transferred to this script and the graph is generated in a < div > container.
This javascript should be used as-is and integrated in the dashboard.
track file list (3)
All logged GPX tracks are located on the jumplogger SD-card. A directory of the SD-card files is presented in a list on the dashboard (sent from the jumplogger Webserver via Ajax call). For each file a download or the display on the dashboard can be selected.
logbook function (7)
On the main dashboard screen, the logbook (a list of all jumps that have been made) with elementary track data is shown (jump-number, location, date/time, aircraft, max altitude, max speed, link to detailed logging file). This info comes from a "logbook.csv" file on the jumploggers SD-card. This file is read from the app after each connection, all new file are uploaded to the dashboards cloud- database. The latest entry is shown on a dashboard card (2). The lat/lon location info in the file needs to be reverse-geolocated to display a city.
Not all info in the log file can be retrieved from the device, so it needs a record- editor to add more fields and data, adding descriptive texts, photns etc. In a Firebase implementation, the cloud database plus picture storage comes into place.
last jump card (2)
The card uses information from the log book, displaying info from the last entry. The data can be retrieved from the logbook file.
winds aloft graph (5)
The site windsaloft.us/ gives wind direction and windspeed for a specific location over altitude. This is displayed as an interactive graph on the dashboard. The location info comes from the jumplogger GPS device via an Ajax call.
weather forecast (4)
The weather forecast widget is currently an iframe with ready-made javascript from meteoblue This javascript should be used as-is and integrated in the dashboard. Also for other requirements an API is also available.
 ajanky
 kutluhan_aktar
 MaBe42
 Gos
Gos