 Radu Pascal
I gathered more data points, and there is something I can't explain on 7MHz band on my MagLoop. Incrementing in fixed steps, does not provide a linear increase in the tuned frequency (as I mentioned in a number of places). But it doesn't behave like an exponential function as I initially thought. It's more as if it has a dip at a certain point(s):
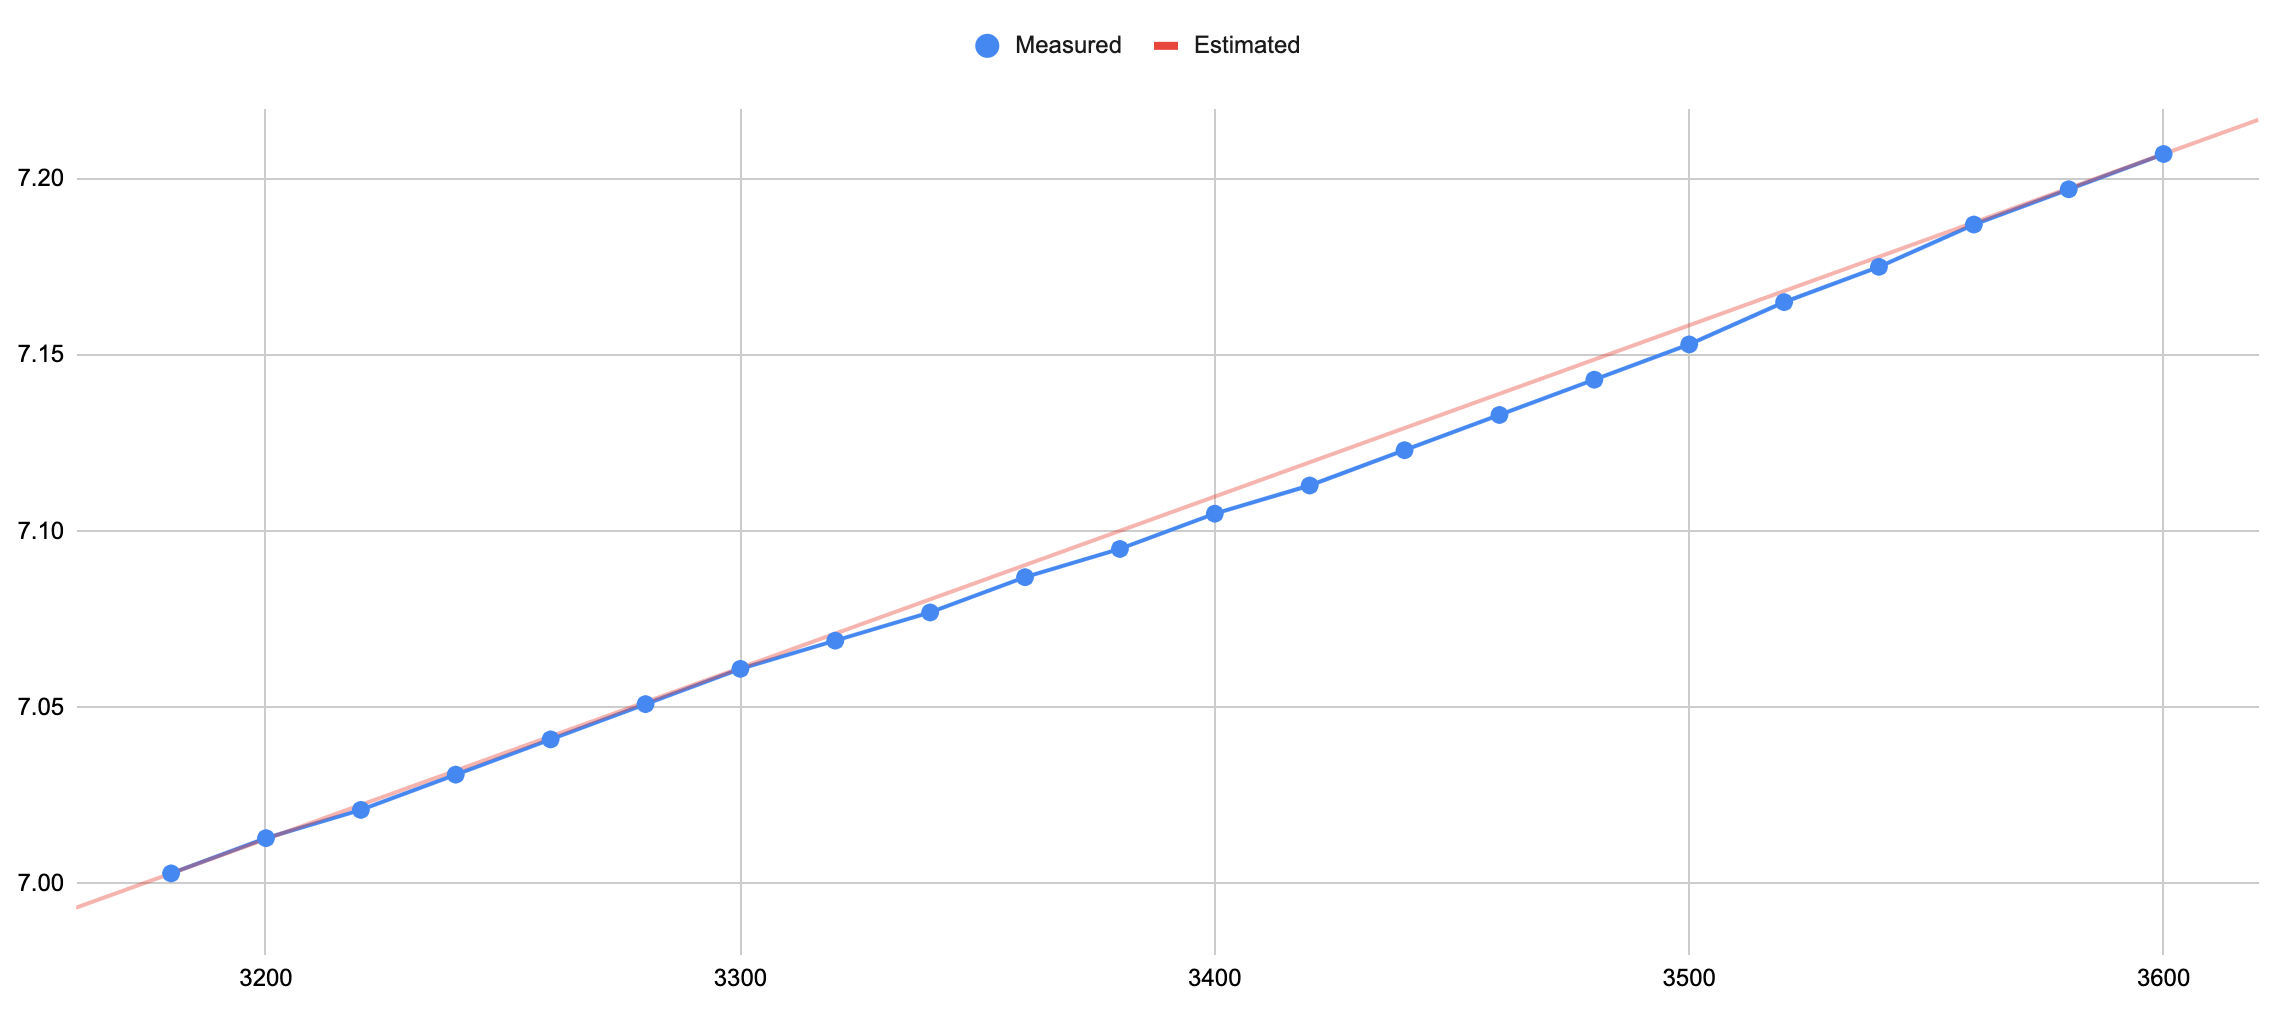
From 6.770MHz to 7MHz, the increase is linear. I didn't bother to measure the upper side.
I gathered data points for 14MHz:
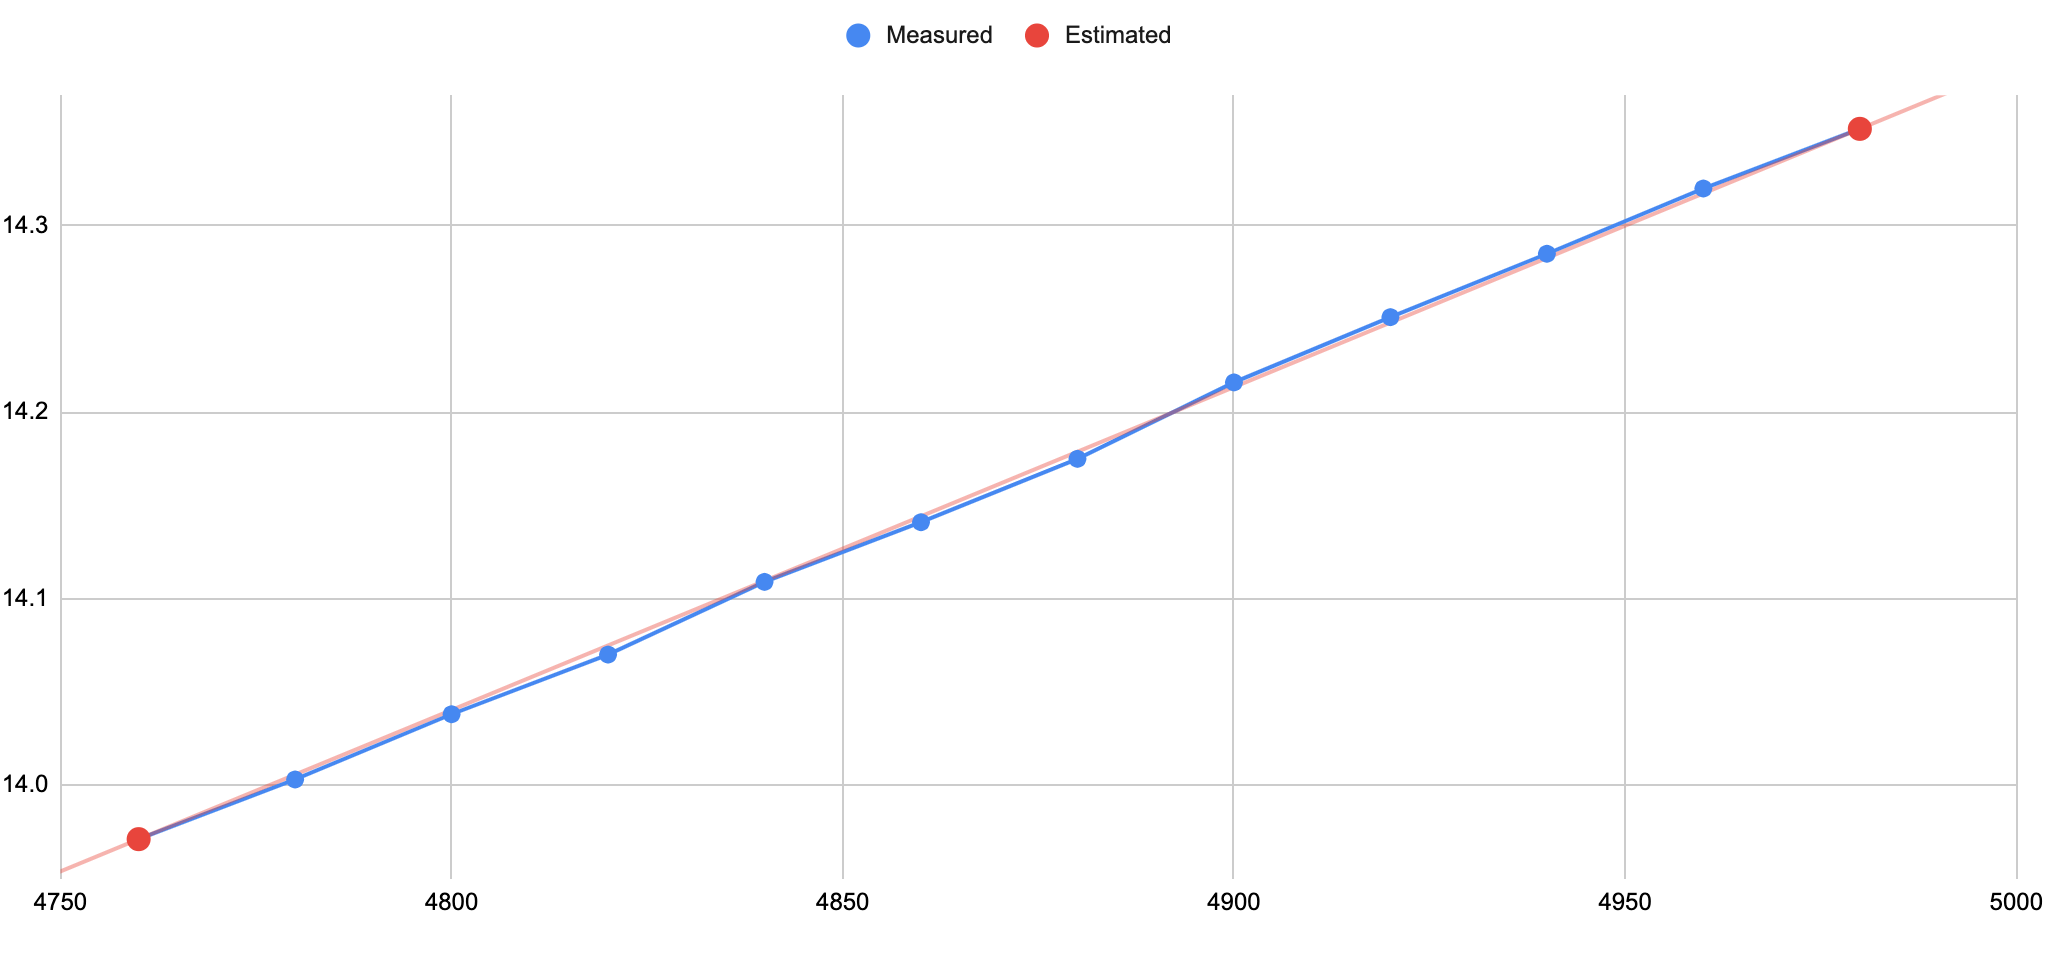
Surprise surprise, this one seems to have a linear response. Also it has a wider frequency change, for the same steps (compared to the 7MHz band). Note: my MagLoop requires plugging a capacitor for 7MHz band, and unplugging it for 14MHz.
Conclusions?
I don't see how I can find a function for that. Will keep linear estimation, but probably will store multiple data point as part of calibration. That should give a good enough result.
The measurements were done with RigExpert AA-55. It should be fairly accurate, at least I trust it 100 times more than the nanoVNA.
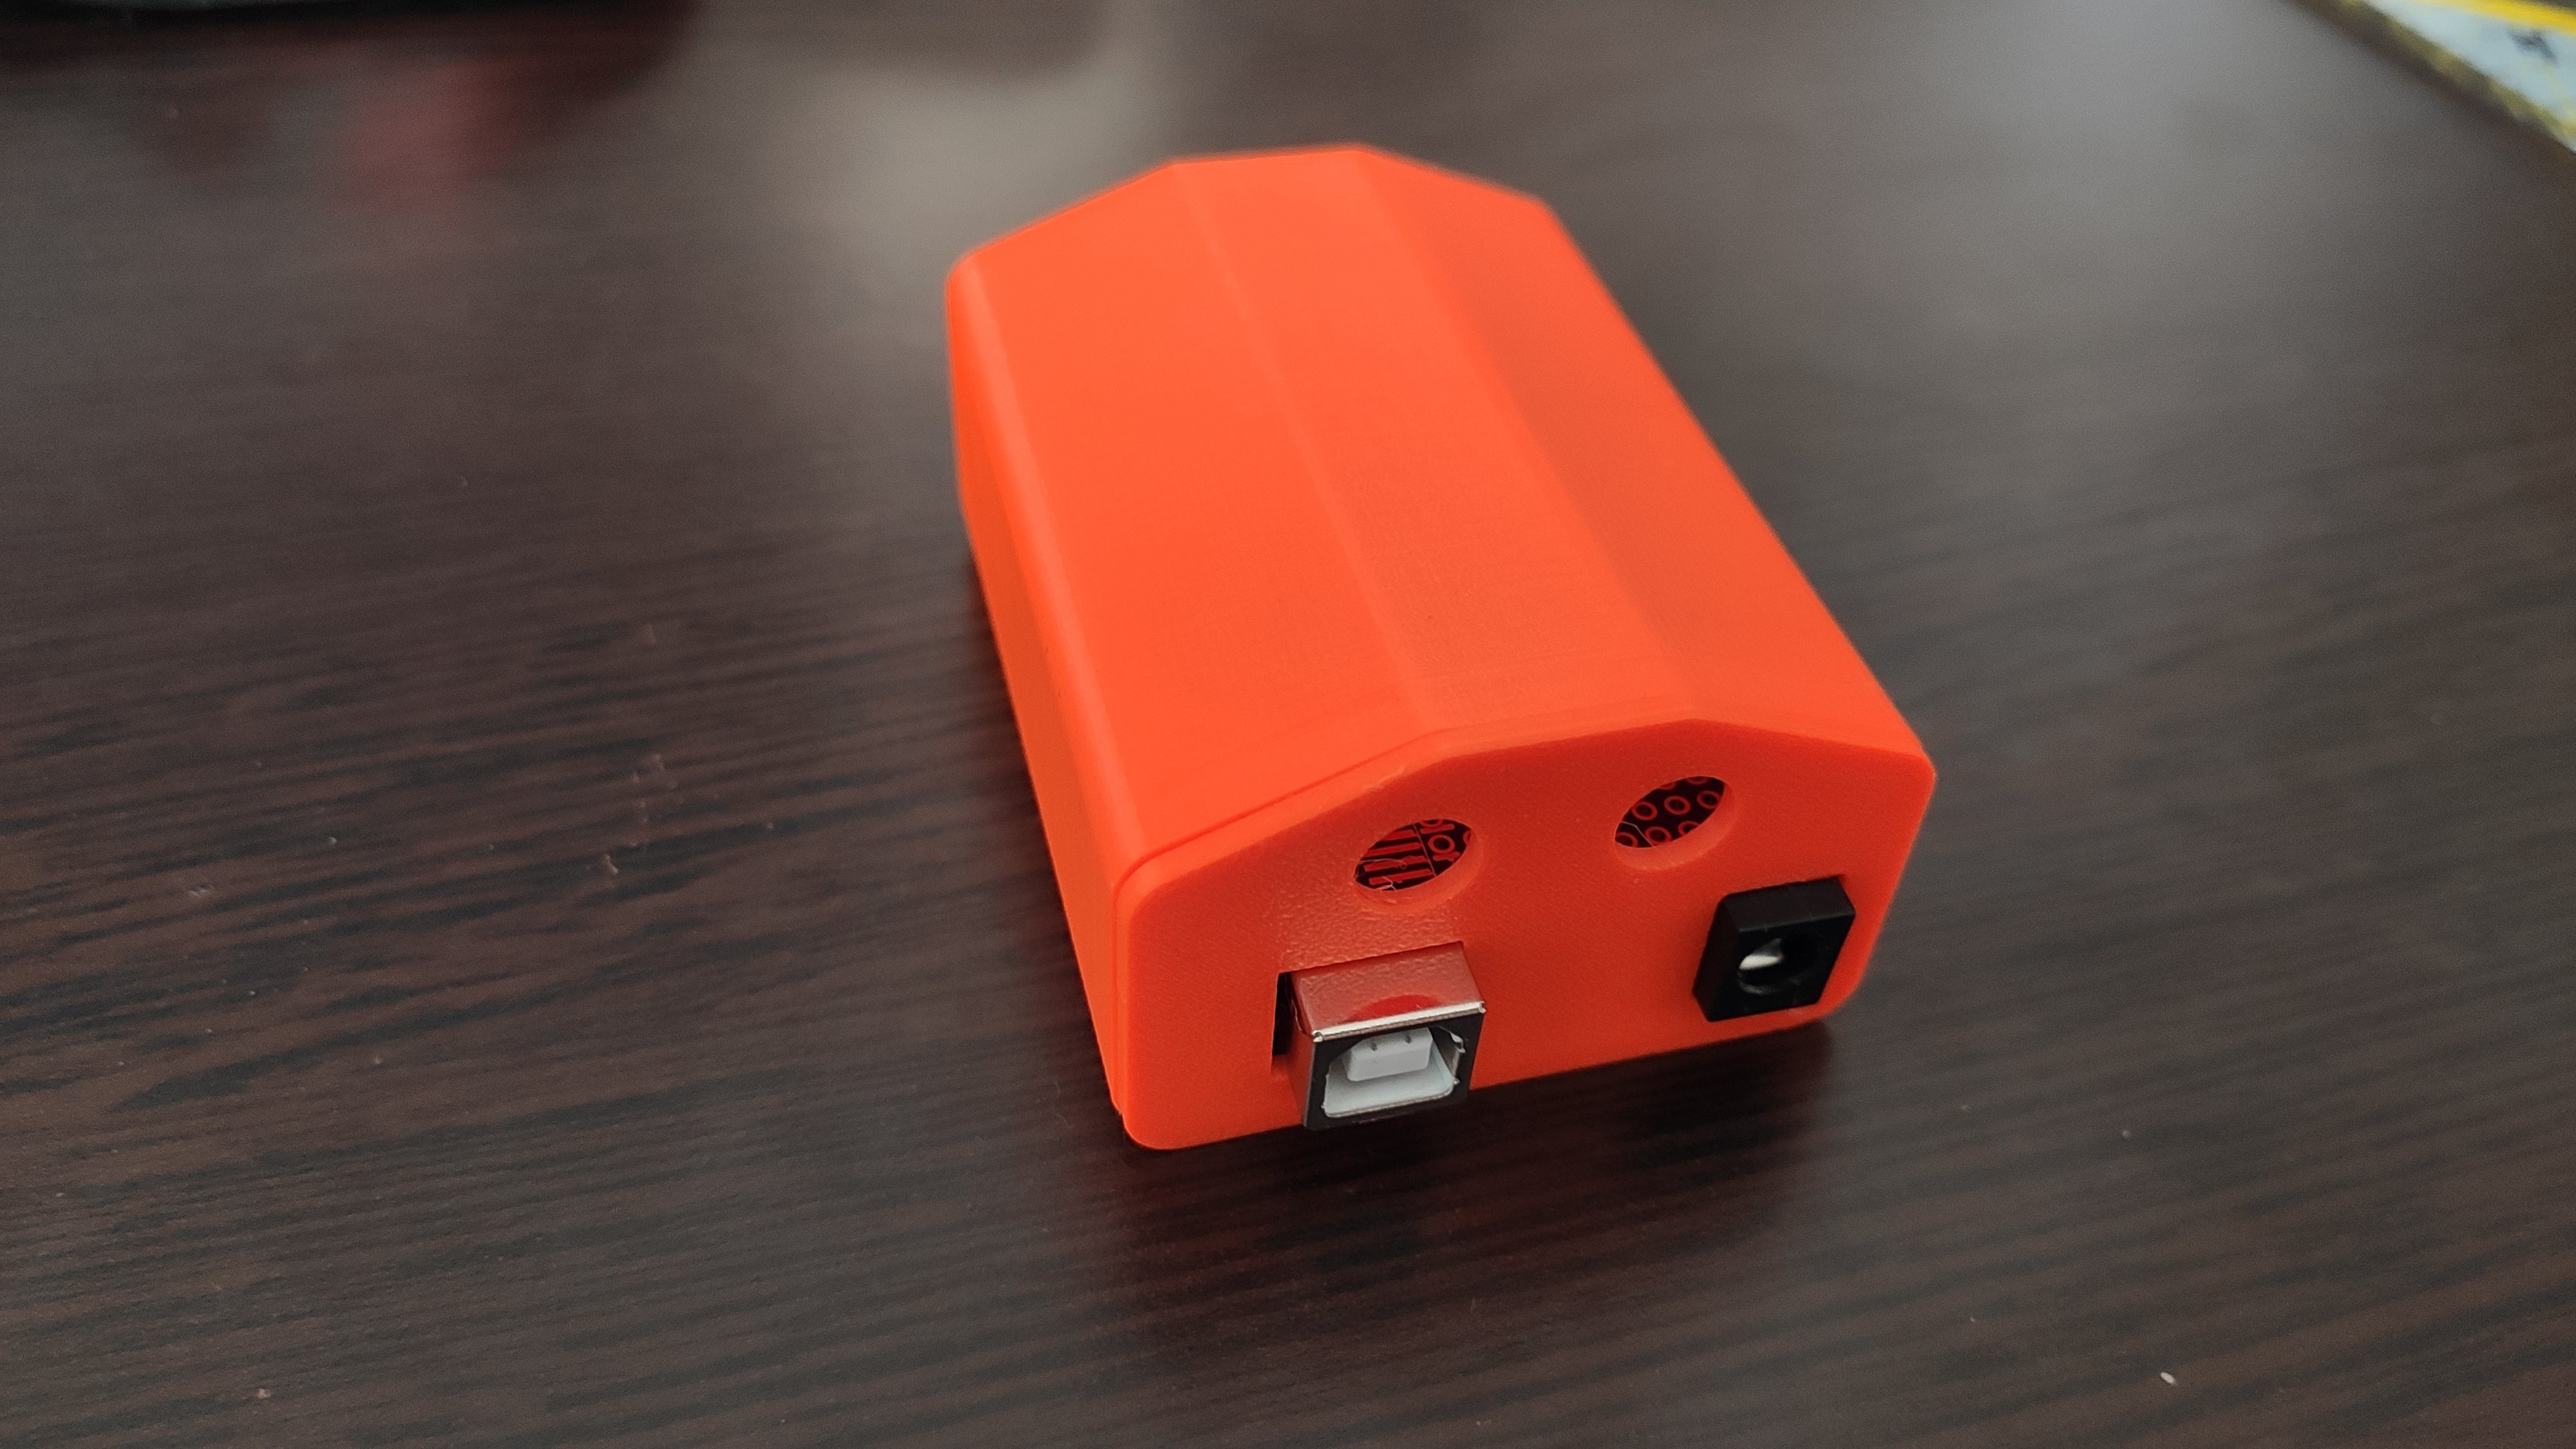
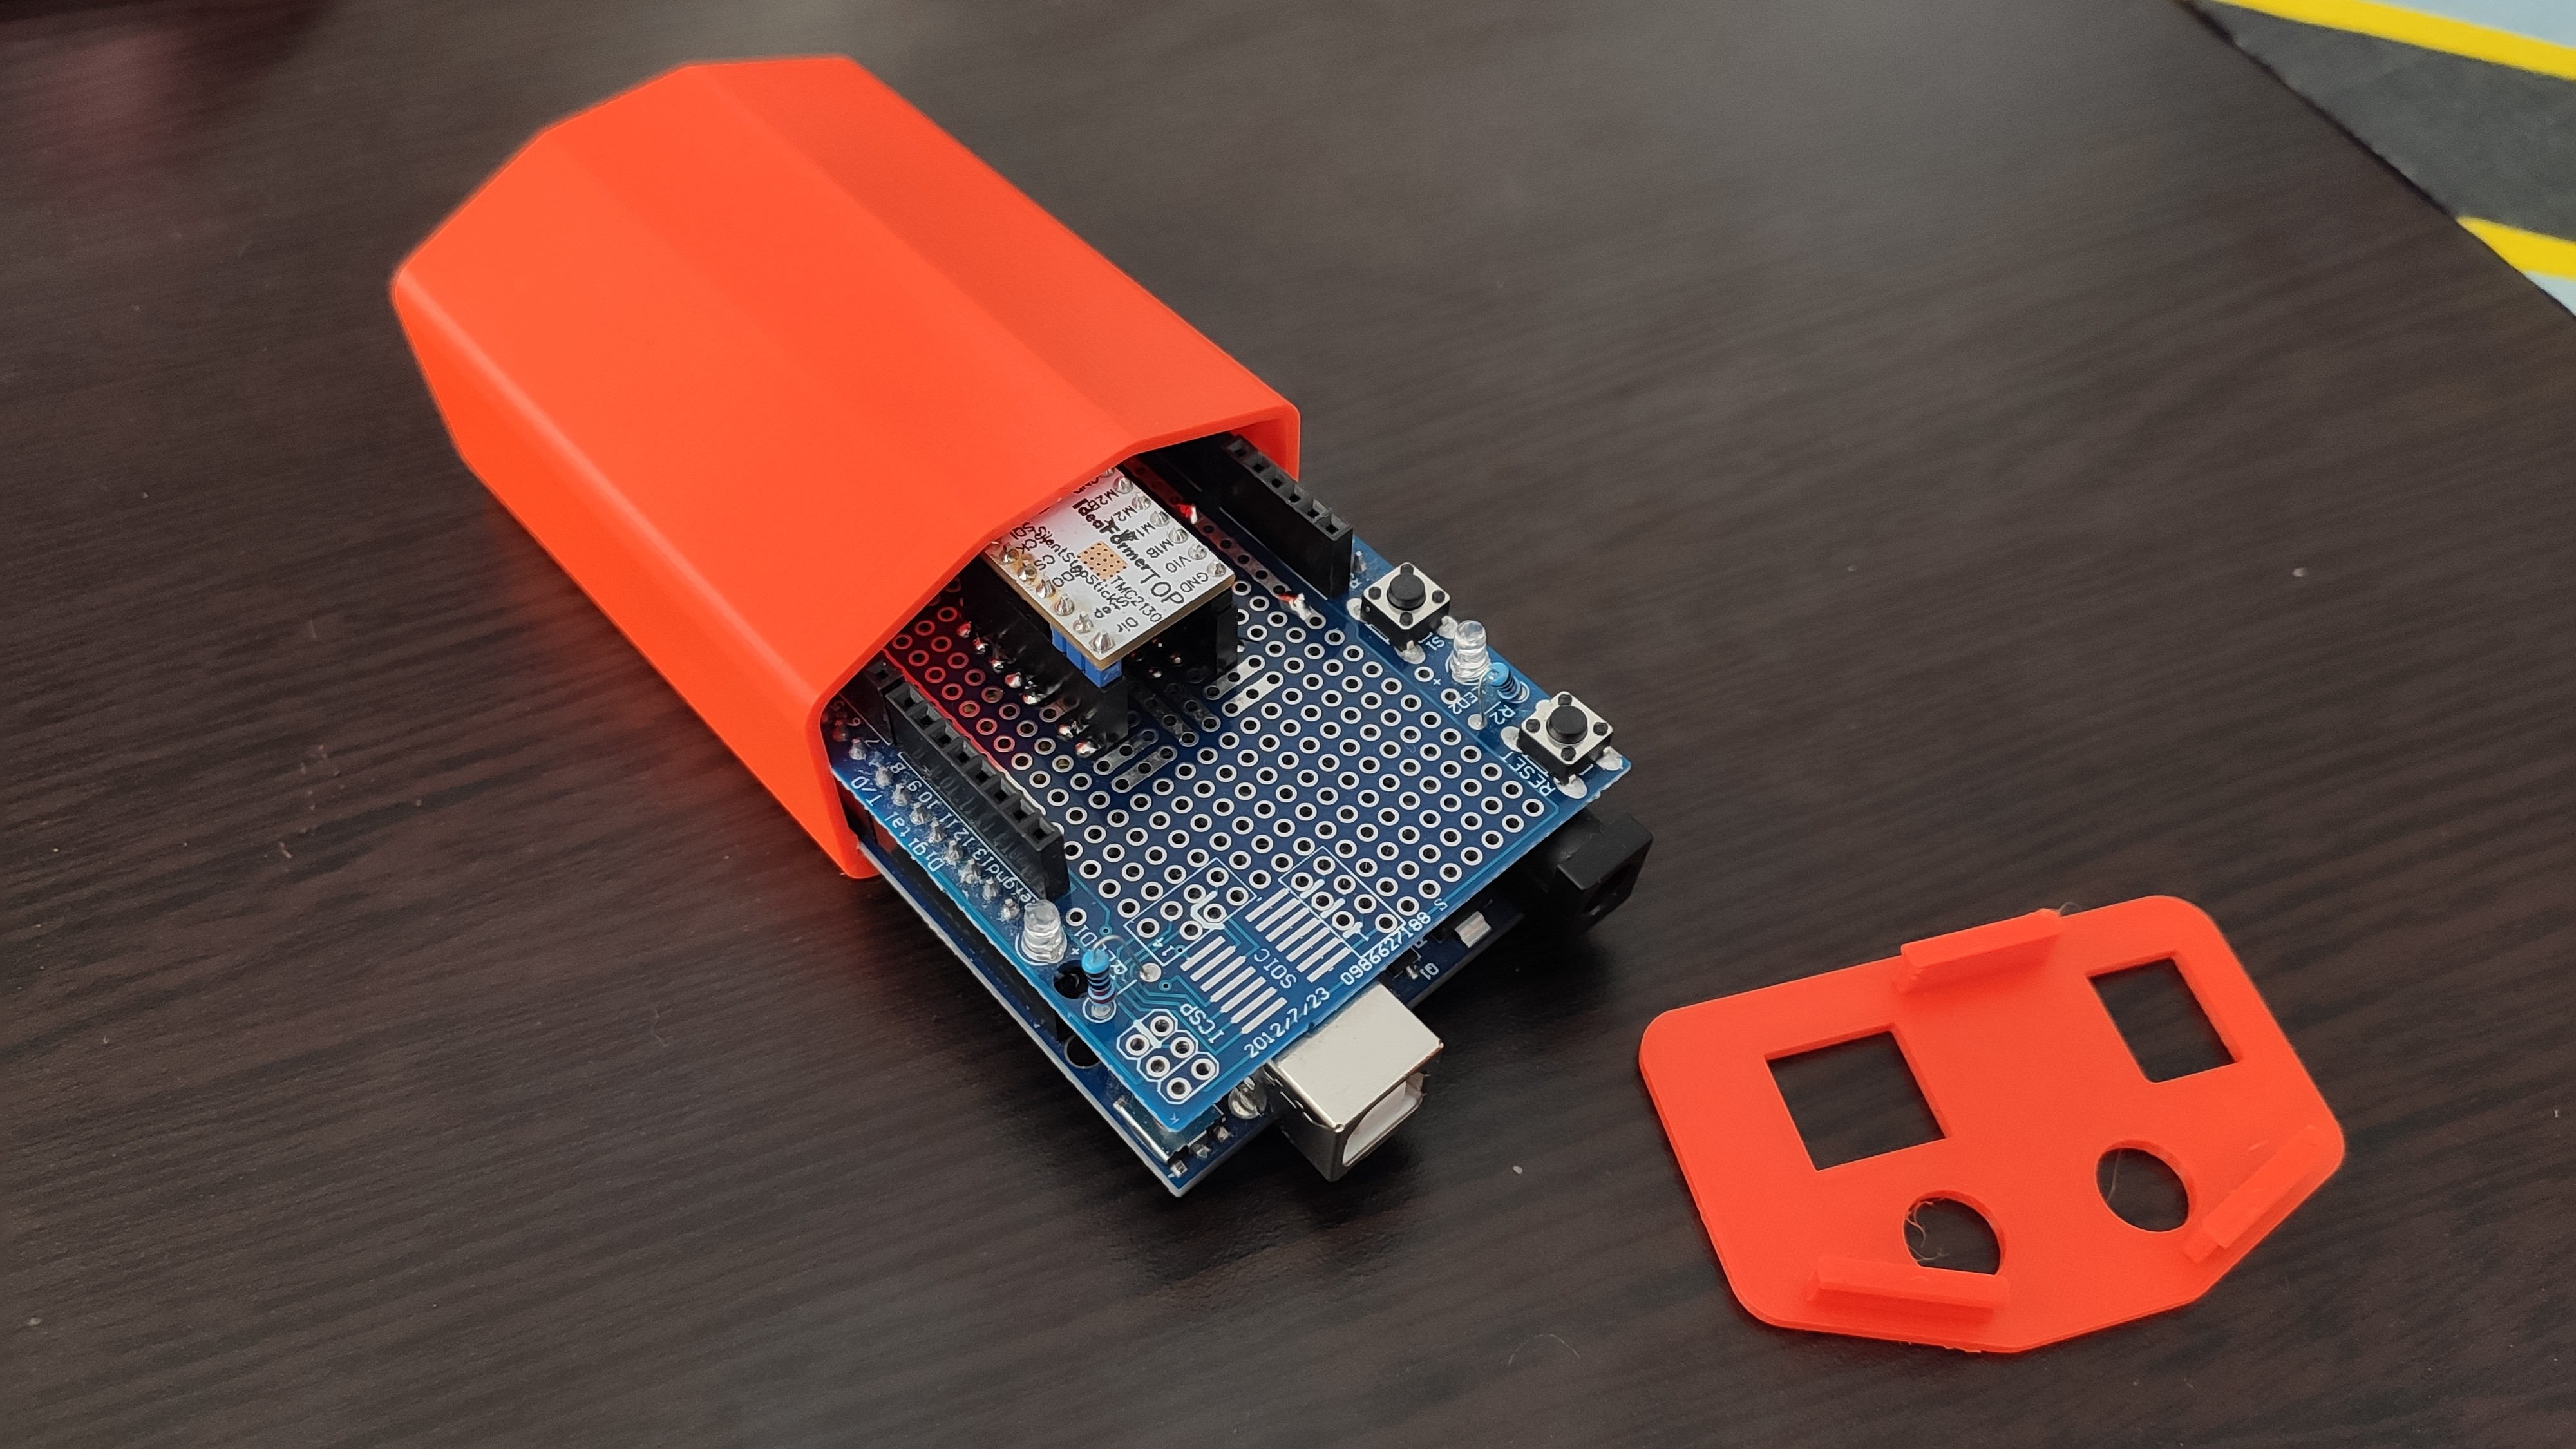
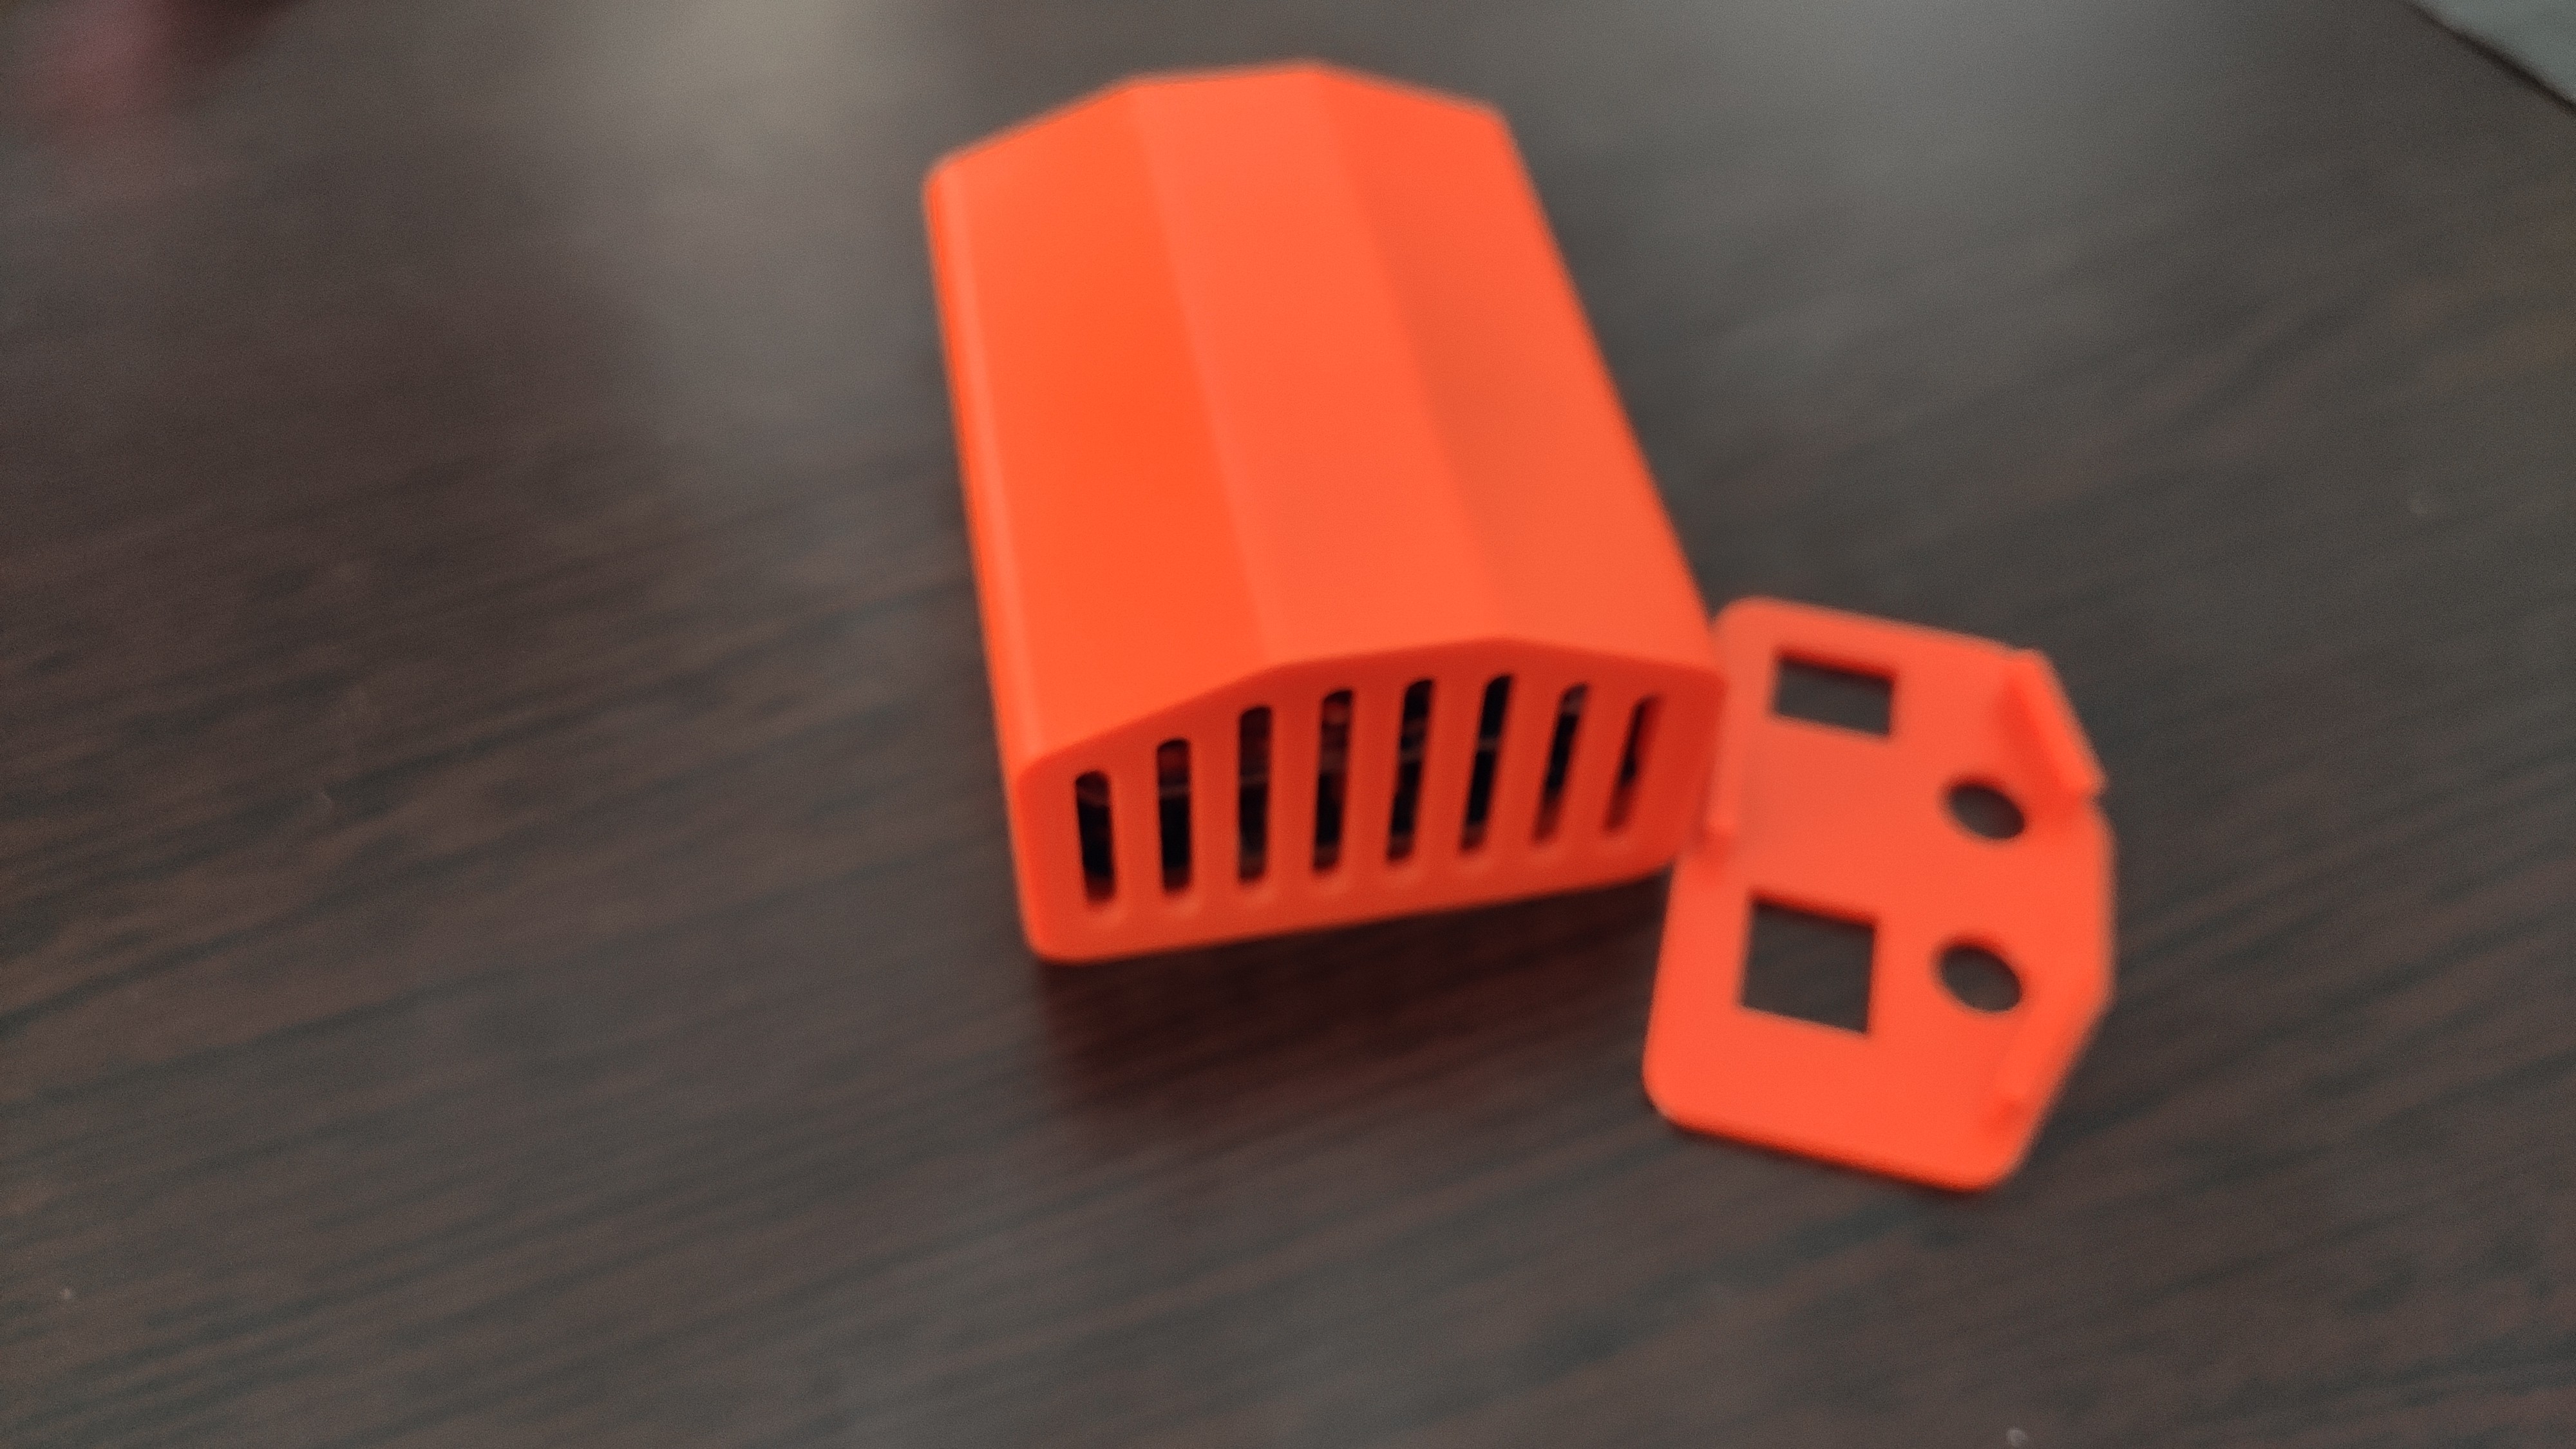
Also a sneak peak at the enclosure (it's not perfect, but it works, so I'll consider that final):
Discussions
Become a Hackaday.io Member
Create an account to leave a comment. Already have an account? Log In.