Although many factors can lead to poor air quality, the two most common are related to elevated concentrations of ground-level ozone and particulate matter. Ground-level ozone forms when nitrogen oxides (NOx) from sources like vehicle exhaust and industrial emissions react with organic compounds in the presence of heat and sunlight. In other words, ozone forms when two types of pollutants (VOCs and NOx) react in sunlight. These pollutants usually come from vehicles, industries, power plants, and products such as solvents and paints. On the other hand, the particulate matter in the air consists of solid and liquid particles, including smoke, dust, and other aerosols - some of which are by-products of chemical transformations[2].
Furthermore, air pollutants may affect people differently depending on weather conditions. Since different aspects of the weather affect the amounts of ozone and particulates present in a specific area, the vagaries of the weather have a veritable impact on air quality. Sunshine, rain, higher temperatures, wind speed, air turbulence, and mixing depths fluctuate pollutant concentrations. Therefore, tracking air quality levels locally is essential to prevent respiratory disease risks, especially for sensitive groups. However, unfortunately, we still have paltry or inadequate appliances (air quality monitors or weather stations) to track air quality locally in some regions.
After perusing recent research papers on air quality and pollution, I decided to utilize ozone concentration in the air as an indicator of air pollution and create a budget-friendly weather station forecasting air quality levels in the hope of making monitoring air quality levels accessible to anyone. Ground-level ozone (O3) can cause breathing difficulty, aggravate chronic respiratory diseases, make the lungs more susceptible to infection, and increase the frequency of asthma attacks[1]. Therefore, ozone concentration in the air can be utilized as a parameter in addition to local weather data to forecast air quality levels so as to prevent detrimental respiratory disease risks.
Since air quality fluctuates according to various phenomena, some of which are not fully fathomed yet, it is not possible to extrapolate and construe air quality by only employing limited local weather data with ozone concentration without applying algorithms. Hence, I decided to utilize local Air Quality Index (AQI) assessments provided by IQAir as labels to build and train an artificial neural network model to forecast air quality levels based on local weather data with ozone concentration.
I decided to utilize an Arduino Nano 33 BLE in this project since it can easily collect local weather data with ozone concentration and run my neural network model outdoors after being trained. To collect the required data to train my model, I connected an I2C ozone sensor, an anemometer, and a BMP180 precision sensor to the Nano 33 BLE. Then, I added an SSD1306 OLED display to monitor the collected data in the field.
Since I collected local weather data with ozone concentration on my balcony, I was able to transmit the collected data from the Nano 33 BLE to a Raspberry Pi 4 in my house over BLE instead of sending data packets to a web server as usual. In that regard, I was able to transfer data packets via the Nano 33 BLE without requiring any additional procedures.
After completing my data set, I built my artificial neural network model (ANN) with TensorFlow to make predictions on air quality levels (classes) based on local weather data with ozone concentration. By the given date, I assigned an air quality class (label) based on local Air Quality Index (AQI) assessments provided by IQAir for each input:
- Good
- Moderate
- Unhealthy
After training and testing my neural network model, I converted it from a TensorFlow Keras H5 model to a C array (.h file) to execute the model on the Nano 33 BLE. Therefore, the weather station is capable of detecting air quality levels (classes) by running the model in the field precisely.
Lastly, to make the weather station as sturdy and robust as possible while enduring harsh weather conditions, I designed a windmill-themed case (3D printable).
So, this is my project in a nutshell 😃
In the following steps, you can find more detailed information on coding, logging data over BLE, building an artificial neural network model with TensorFlow, and running it on the Nano 33 BLE.
🎁🎨 Huge thanks to DFRobot for sponsoring this project.
Sponsored products by DFRobot:
⭐ DFRobot I2C Ozone Sensor | Inspect
⭐ DFRobot Anemometer Kit | Inspect
⭐ DFRobot 8.9" 1920x1200 IPS Touch Display | Inspect
🎁🎨 Also, huge thanks to Creality3D for sponsoring a Creality CR-6 SE 3D Printer.
🎁🎨 If you want to purchase some products from Creality3D, you can use my 10% discount coupon (Aktar10) even for their new and most popular printers: CR-10 Smart,CR-30 3DPrintMill,Ender-3 Pro, and Ender-3 V2.
🎁🎨 You can also use the coupon for Creality filaments, such as Upgraded PLA (200g x 5 Pack),PLA White, and PLA Black.

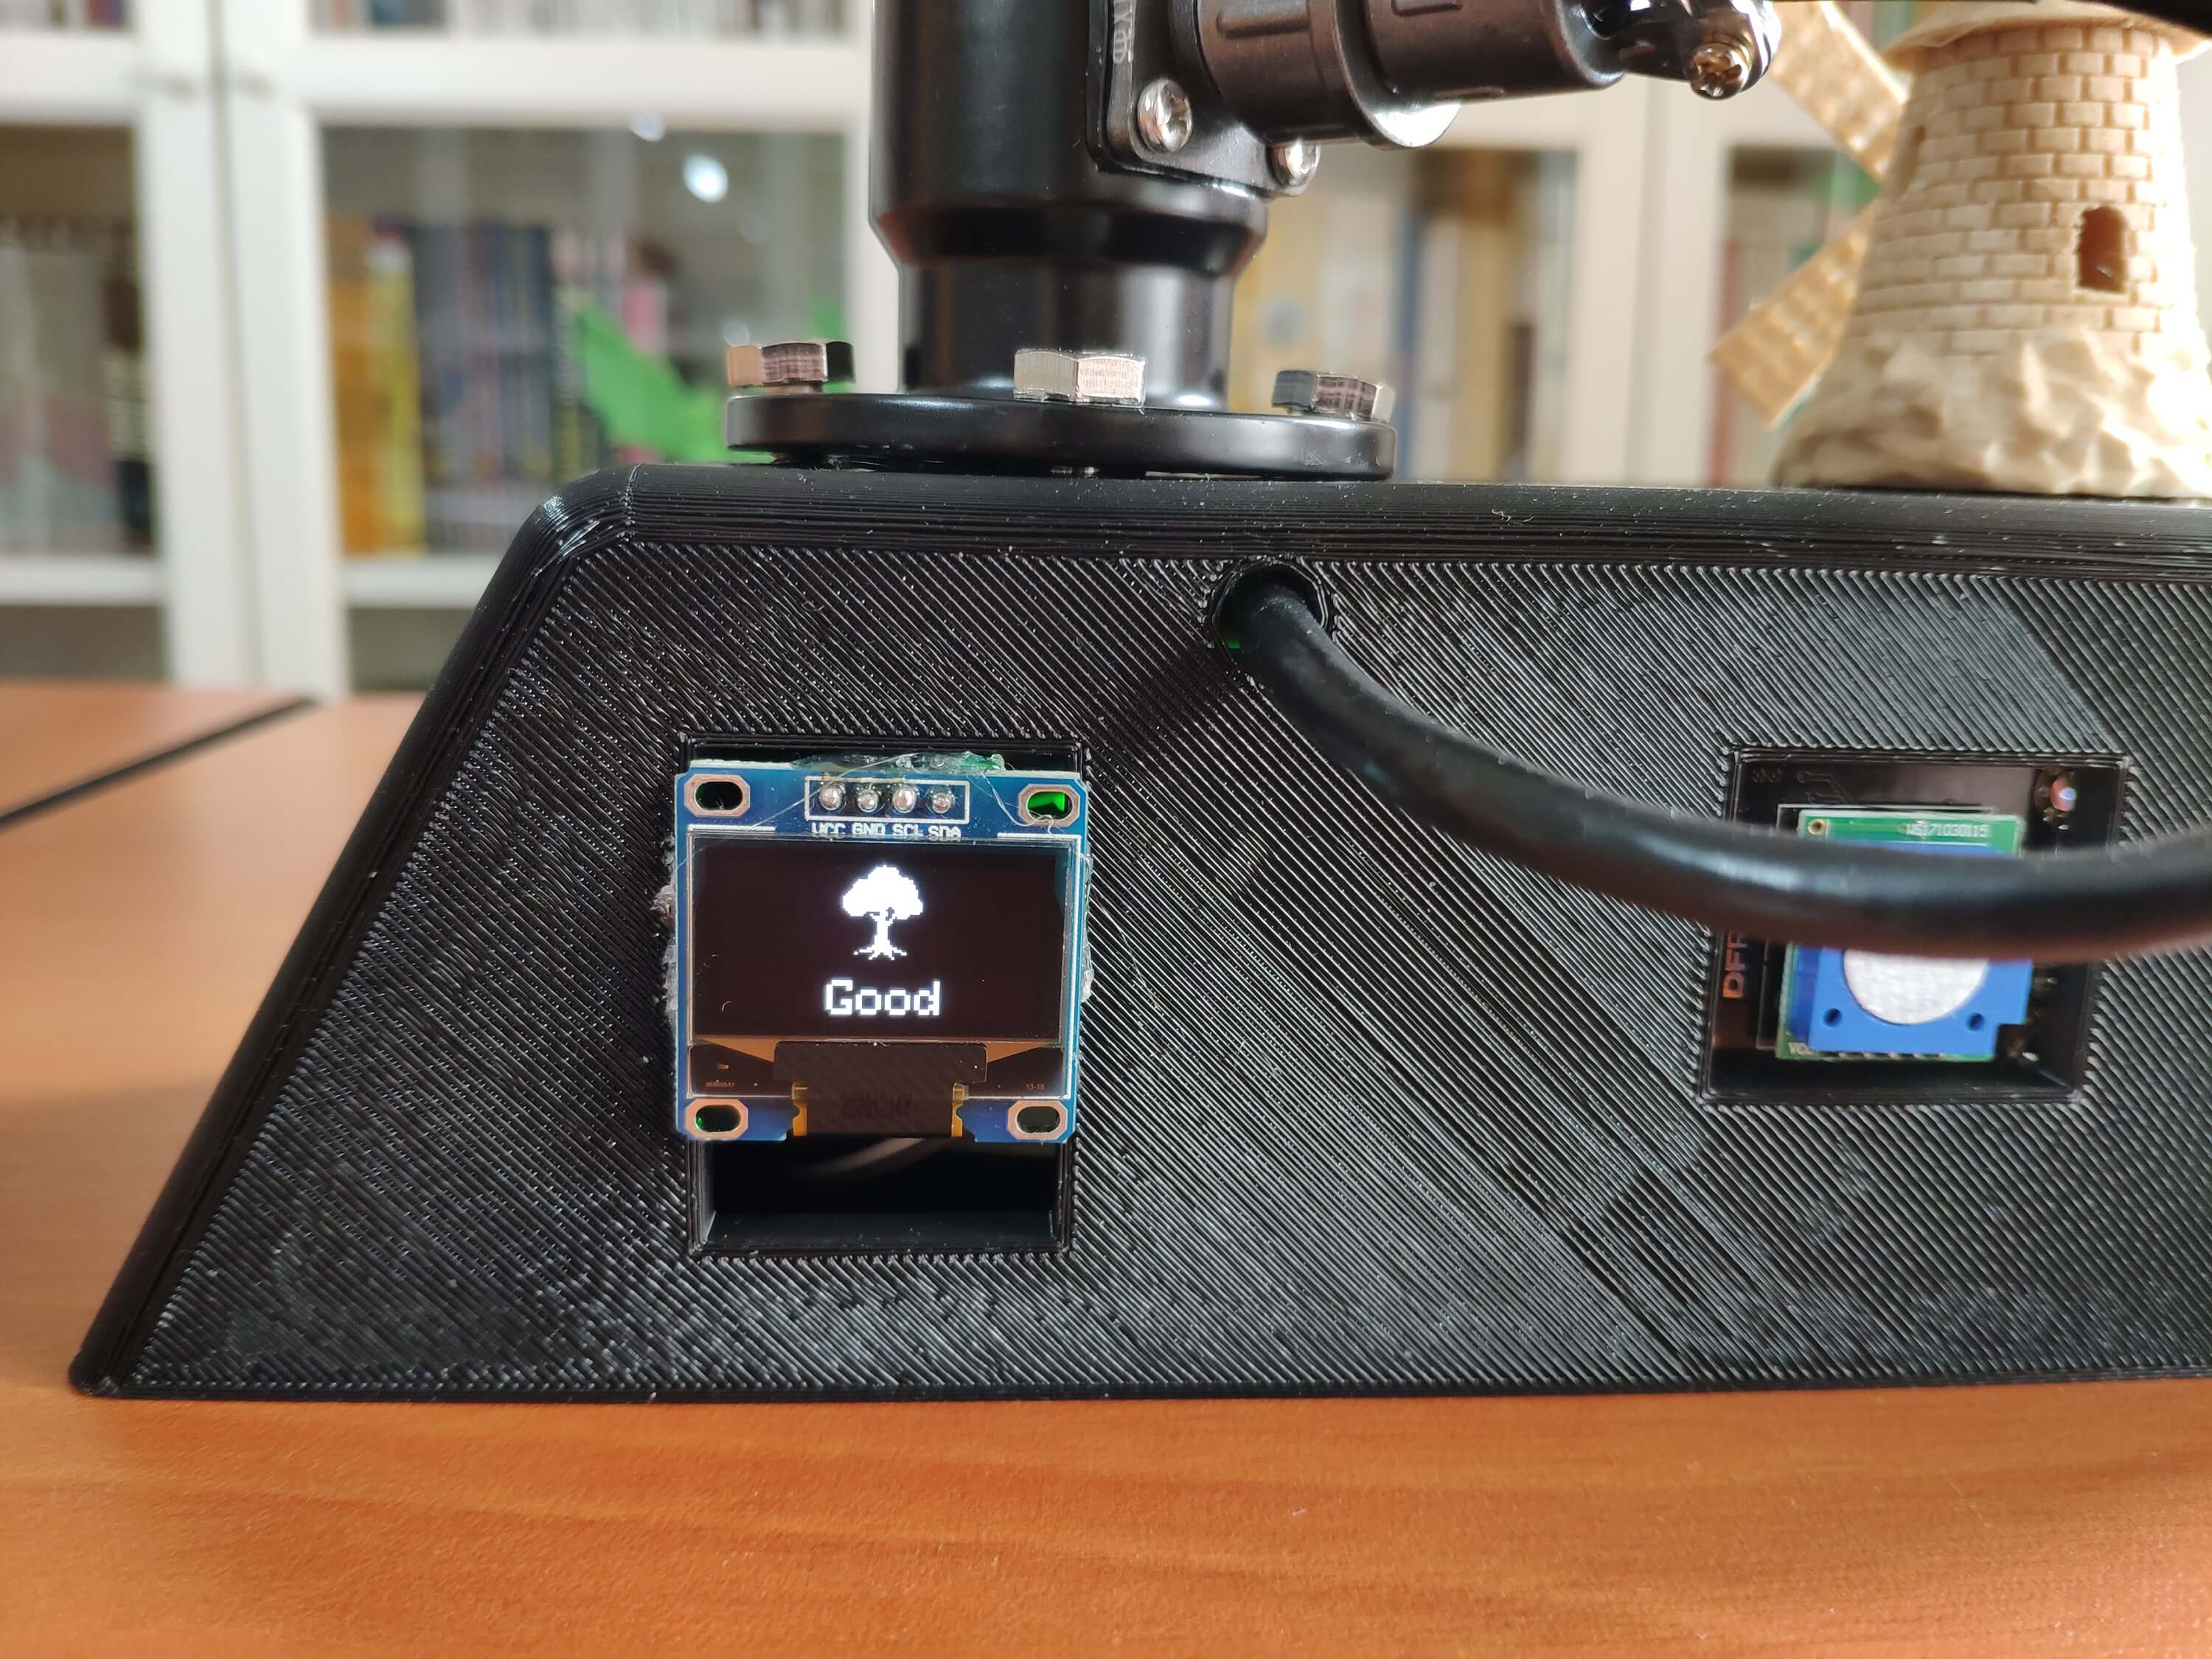
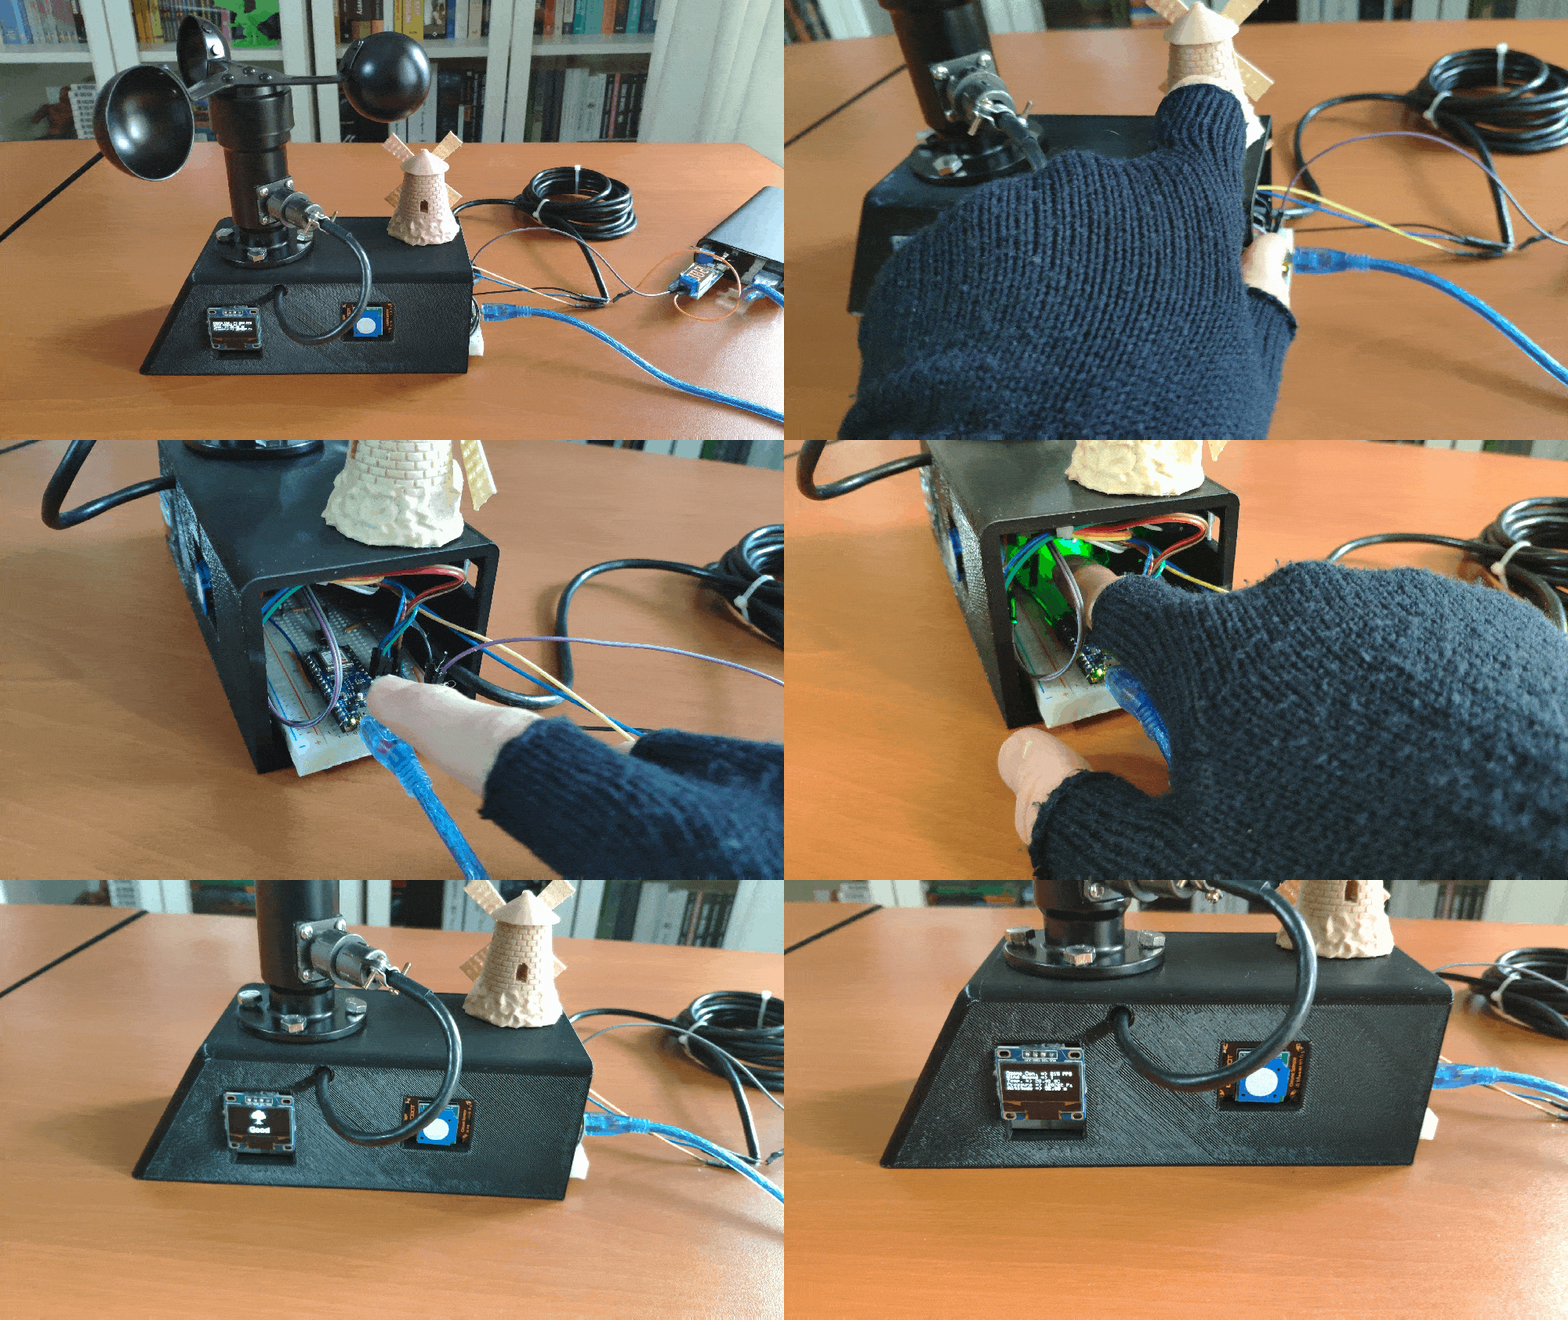
Step 1: Designing and printing a windmill-themed case
Since I wanted to collect local weather data with ozone concentration on my balcony outdoors, I decided to design a windmill-themed case for this project to create a robust and sturdy weather station operating flawlessly while enduring harsh weather conditions.
I designed the weather station case in Autodesk Fusion 360. You can download its STL file below.

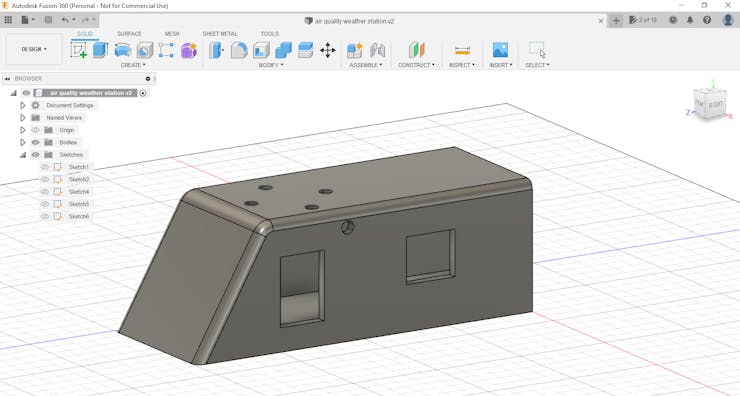
For the windmill affixed to the weather station case, I combined these two models from Thingiverse:
Then, I sliced 3D models (STL files) in Ultimaker Cura.
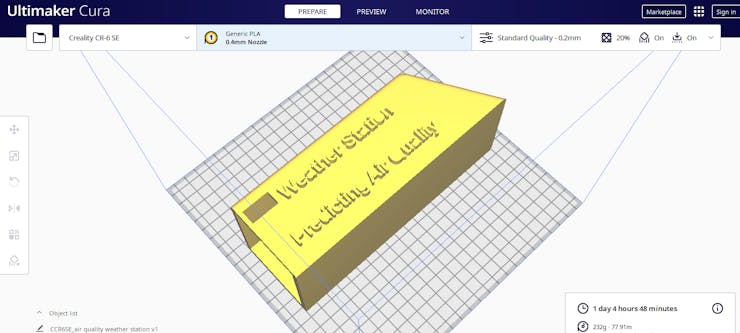
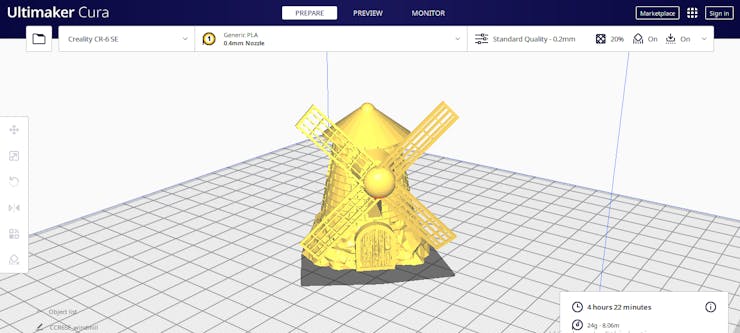
Since I wanted to create a solid structure for the weather station and apply seamless wood texture to the windmill, I utilized these PLA filaments:
- Black
- Wood
Finally, I printed all parts (models) with my Creality CR-6 SE 3D Printer. Although I am a novice in 3D printing and it is my first 3D printer, I got incredible results effortlessly with the CR-6 SE :)

Step 1.1: Assembling the case and making connections & adjustments
// Connections// Arduino Nano 33 BLE :
//                                DFRobot IIC Ozone Sensor
// A4  --------------------------- SDA
// A5  --------------------------- SCL
//                                BMP180 Barometric Pressure/Temperature/Altitude Sensor
// A4  --------------------------- SDA
// A5  --------------------------- SCL
//                                SSD1306 OLED Display (128x64)
// A4  --------------------------- SDA
// A5  --------------------------- SCL
//                                DFRobot Anemometer Kit
// A0  --------------------------- S (Yellow)
//                                5mm Green LED
// D2  --------------------------- +
//                                Button (6x6)
// D3  --------------------------- +
To collect and display local weather data with ozone concentration, I connected the I2C ozone sensor, the anemometer, the BMP180 precision sensor, and the SSD1306 OLED screen to the Nano 33 BLE. Also, I added a 5mm green LED to indicate outcomes of operating functions and a button (6x6) to run my neural network model effortlessly, as shown in the schematic below.
Since the anemometer requires a 9-24V supply voltage and generates a 0-5V output voltage (signal), it cannot be connected directly to the Nano 33 BLE operating at 3.3V. Therefore, I connected a USB buck-boost converter board to the Xiaomi power bank to elicit stable 20V to supply the anemometer. Then, I utilized a simple step-down circuit (2.2K + 3.3K) to convert the anemometer's 5V output signal to approximate 3.3V logic input.
When the I2C ozone sensor is powered up for the first time, the sensor requires operating for about 24-48 hours to generate calibrated and stable results. In my case, the I2C ozone sensor started to generate stable results after 29 hours of working. Although the I2C ozone sensor needs to be calibrated once, it has a preheat time of about 3 minutes to evaluate ozone concentration precisely.
First of all, I soldered jumper wires to the anemometer's cable to connect it to the Nano 33 BLE successfully via the breadboard.
- Red ➡ 9-24V
- Black ➡ GND
- Yellow ➡ Voltage signal
- Blue ➡ Current signal
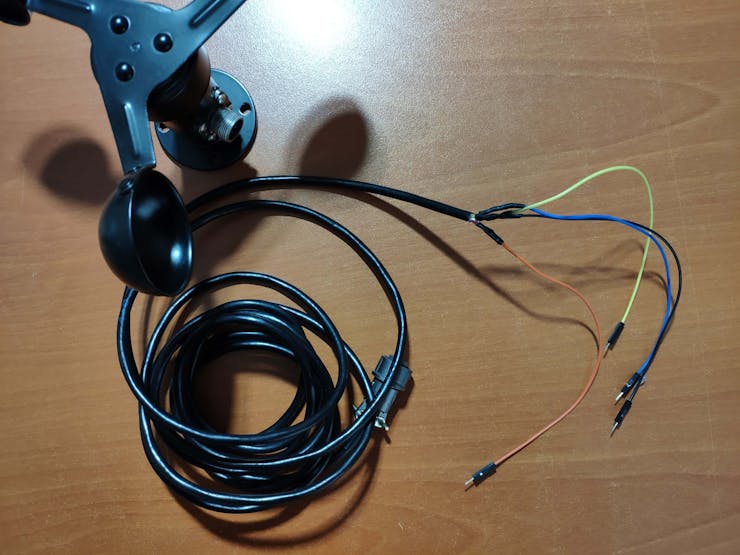
After printing all parts (models) and completing connections on the breadboard successfully, I fastened all components to the weather station case and made breadboard connection points rigid by utilizing a hot glue gun.
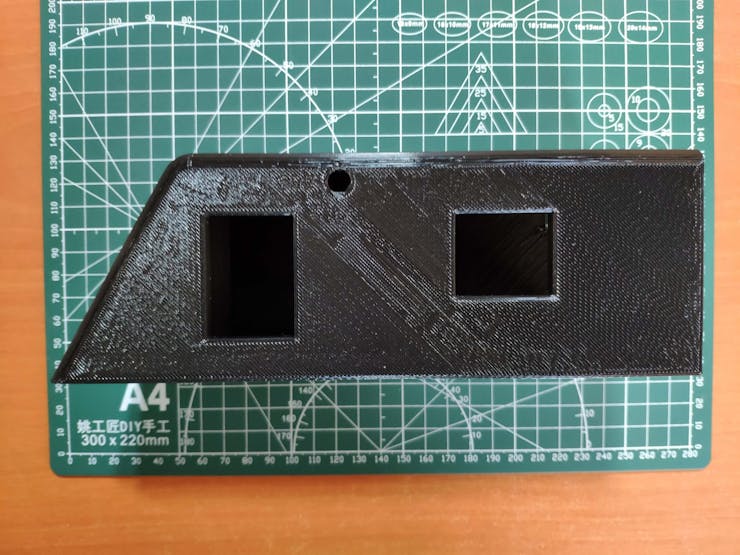
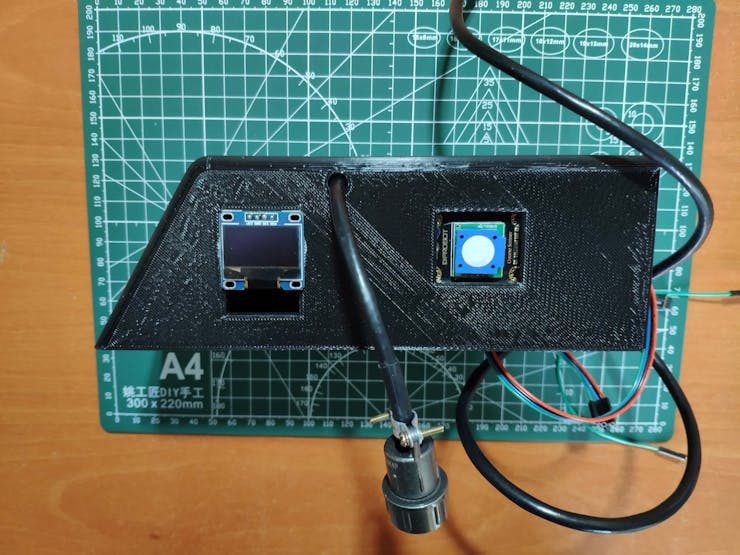
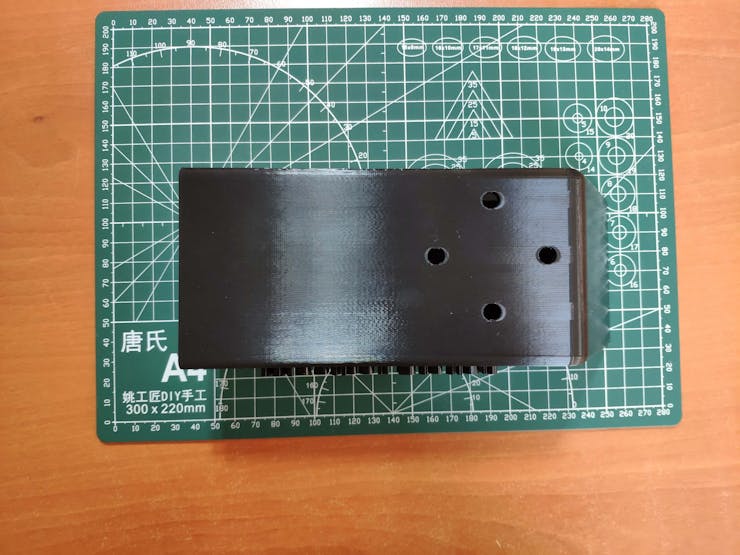
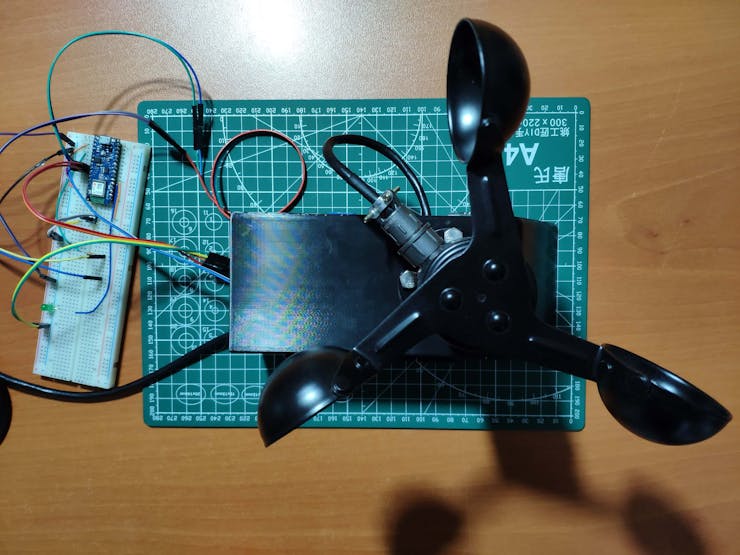
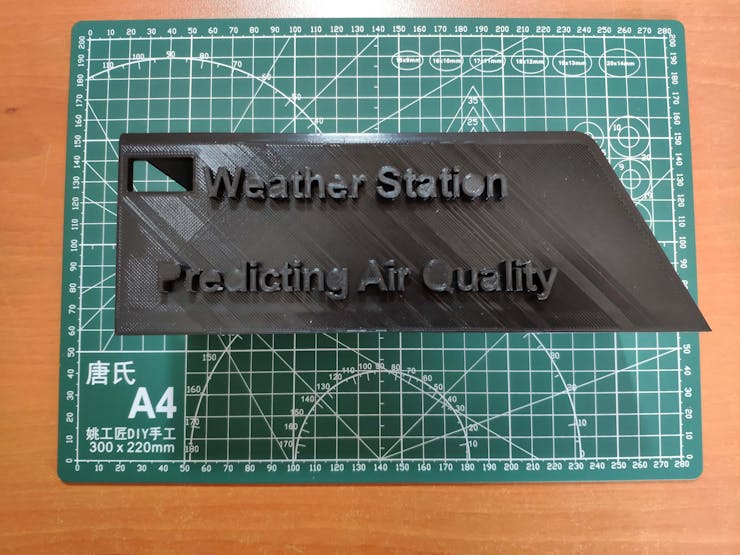
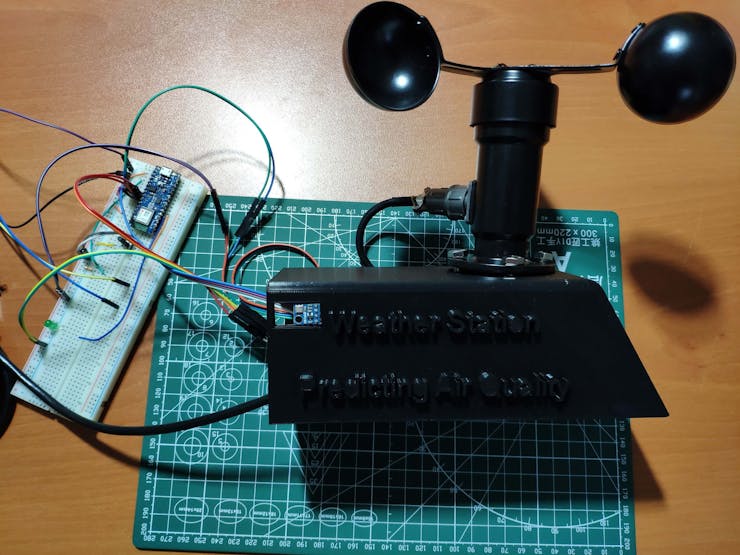
Finally, I placed the breadboard into the weather station case and attached the windmill on the top.
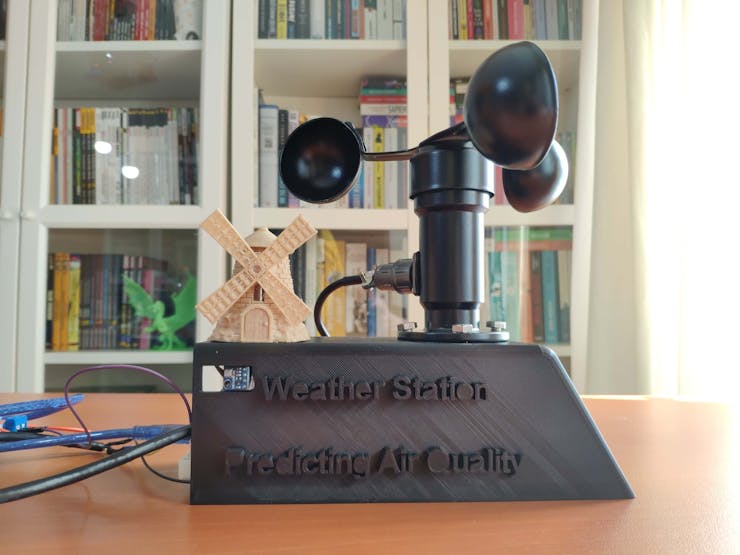
Step 2: Setting up the Arduino Nano 33 BLE
Since the Arduino Nano 33 BLE can transmit data packets over BLE in short-range, from my balcony to my house (below 3 meters), I decided to utilize my Raspberry Pi 4 so as to obtain the transferred data packets and log the collected local weather data with ozone concentration without applying any additional procedures. However, before proceeding with the following steps, I needed to set up the Arduino Nano 33 BLE on the Arduino IDE and install the required libraries for this project.
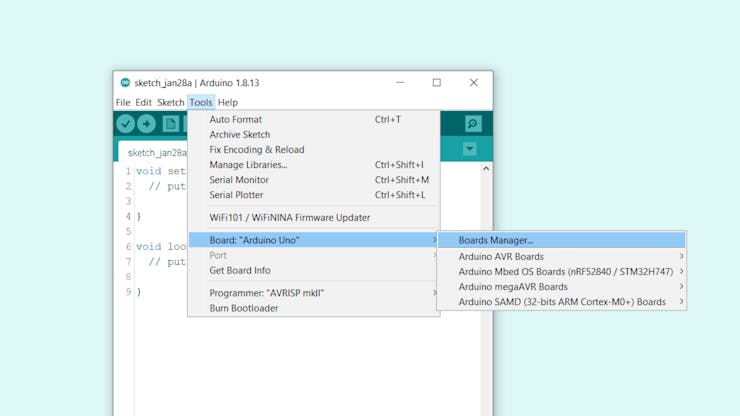
#️⃣ To install the required core, navigate to Tools ➡ Board ➡ Boards Manager and search for Arduino Mbed OS Nano Boards.
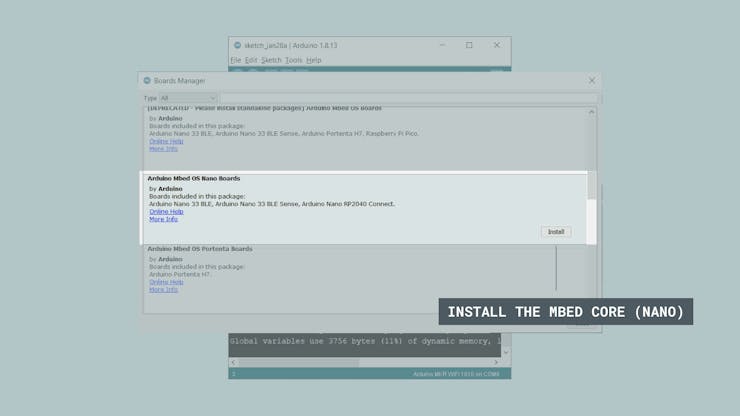
#️⃣ Then, to select the Nano 33 BLE, go to Tools ➡ Board ➡ Arduino Mbed OS Nano Boards.
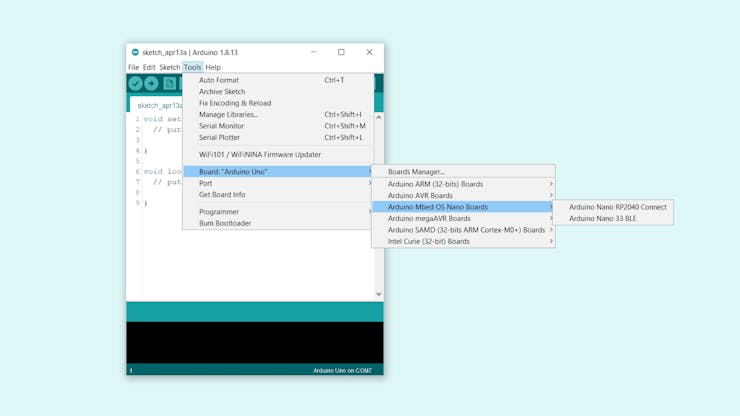
#️⃣ To download the ArduinoBLE library on the Arduino IDE, go to Sketch ➡ Include Library ➡ Manage Libraries… and search for ArduinoBLE.

#️⃣ Download the required libraries for the I2C ozone sensor, the BMP180 precision sensor, and the SSD1306 OLED display:
DFRobot_OzoneSensor | Download
Adafruit-BMP085-Library | Download
Adafruit_SSD1306 | Download
Adafruit-GFX-Library | Download
Step 2.1: Displaying images on the SSD1306 OLED screen
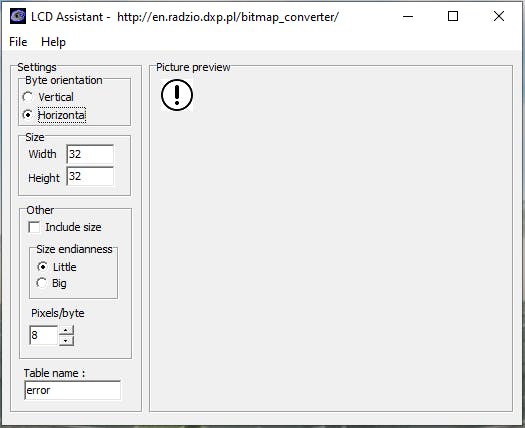
To display images (black and white) on the SSD1306 OLED screen successfully, I needed to create monochromatic bitmaps from PNG or JPG files and convert the bitmaps to data arrays.
#️⃣ First of all, download the LCD Assistant.
#️⃣ Then, upload a monochromatic bitmap and select Vertical or Horizontal depending on the screen type.
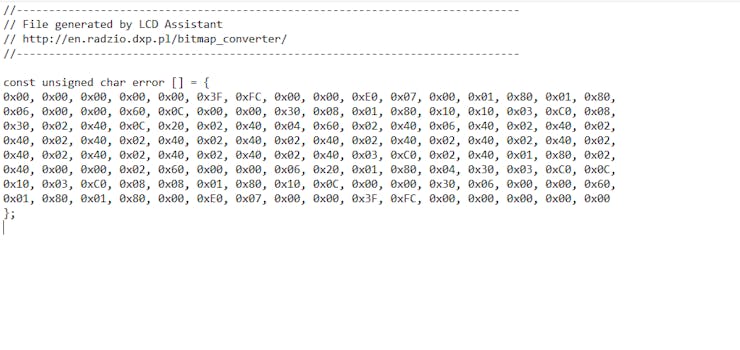
#️⃣ Convert the image (bitmap) and save the output (data array).
#️⃣ Finally, add the data array to the code and print it on the screen:
static const unsigned char PROGMEM _error [] = {
0x00, 0x00, 0x00, 0x00, 0x00, 0x3F, 0xFC, 0x00, 0x00, 0xE0, 0x07, 0x00, 0x01, 0x80, 0x01, 0x80,
0x06, 0x00, 0x00, 0x60, 0x0C, 0x00, 0x00, 0x30, 0x08, 0x01, 0x80, 0x10, 0x10, 0x03, 0xC0, 0x08,
0x30, 0x02, 0x40, 0x0C, 0x20, 0x02, 0x40, 0x04, 0x60, 0x02, 0x40, 0x06, 0x40, 0x02, 0x40, 0x02,
0x40, 0x02, 0x40, 0x02, 0x40, 0x02, 0x40, 0x02, 0x40, 0x02, 0x40, 0x02, 0x40, 0x02, 0x40, 0x02,
0x40, 0x02, 0x40, 0x02, 0x40, 0x02, 0x40, 0x02, 0x40, 0x03, 0xC0, 0x02, 0x40, 0x01, 0x80, 0x02,
0x40, 0x00, 0x00, 0x02, 0x60, 0x00, 0x00, 0x06, 0x20, 0x01, 0x80, 0x04, 0x30, 0x03, 0xC0, 0x0C,
0x10, 0x03, 0xC0, 0x08, 0x08, 0x01, 0x80, 0x10, 0x0C, 0x00, 0x00, 0x30, 0x06, 0x00, 0x00, 0x60,
0x01, 0x80, 0x01, 0x80, 0x00, 0xE0, 0x07, 0x00, 0x00, 0x3F, 0xFC, 0x00, 0x00, 0x00, 0x00, 0x00
};

...

display.clearDisplay();
display.drawBitmap(48, 0, _error, 32, 32, SSD1306_WHITE);
display.display();

Step 3: Collecting local weather data and transferring information over BLE w/ the Nano 33 BLE
After setting up the Arduino Nano 33 BLE and installing the required libraries, I programmed the Nano 33 BLE to advertise (transmit) the collected local weather data with ozone concentration as a peripheral device.
In any Bluetooth® Low Energy (also referred to as Bluetooth® LE or BLE) connection, devices can have one of these two roles: the central and the peripheral. A peripheral device (also called a client) advertises or broadcasts information about itself to devices in its range, while a central device (also called a server) performs scans to listen for devices broadcasting information. You can get more information regarding BLE connections and procedures, such as services and characteristics, from here.
To avoid latency or packet loss while advertising (transmitting) local weather data with ozone concentration over BLE, I put all parameters (2 floats and 3 integers) in a struct to pass them at once - 20 bytes - as explained below.
You can download the ozone-enabled_weather_station_data_collect.ino file to try and inspect the code for collecting local weather data with ozone concentration and transmitting information over BLE.
⭐ Include the required libraries.
#include <ArduinoBLE.h>#include "DFRobot_OzoneSensor.h"#include <Adafruit_BMP085.h>#include <Adafruit_GFX.h>#include <Adafruit_SSD1306.h>
⭐ Create the BLE service and the data characteristic. Then, allow the remote device (central) to read and write.
// Create the BLE service:BLEService air_quality_service("19B10000-E8F2-537E-4F6C-D104768A1214");// Create the data characteristic and allow the remote device (central) to read and write:BLECharacteristic airDataCharacteristic("19B10001-E8F2-537E-4F6C-D104768A1214", BLERead | BLEWrite, 20);
⭐ Define the collect number (1-100) for the I2C ozone sensor.
⭐ To modify the I2C address of the ozone sensor, configure the hardware IIC address by the dial switch - A0, A1 (ADDRESS_0 for [0 0]), (ADDRESS_1 for [1 0]), (ADDRESS_2 for [0 1]), (ADDRESS_3 for [1 1]).
⭐ Define the timer for the I2C ozone sensor.
#define COLLECT_NUMBER 20 /* The default IIC device address is ADDRESS_3: ADDRESS_0 0x70 ADDRESS_1 0x71 ADDRESS_2 0x72 ADDRESS_3 0x73*/#define Ozone_IICAddress ADDRESS_3// Define the IIC Ozone Sensor.DFRobot_OzoneSensor Ozone;// Define the timer for the IIC Ozone Sensor.unsigned long ozone_timer = 0;unsigned long timer = 0;
⭐ Define the BMP180 precision sensor and the anemometer kit's voltage signal pin (yellow).
Adafruit_BMP085 bmp;// Define the anemometer kit's voltage signal pin (yellow).#define anemometer_signal A0
⭐ Define the SSD1306 screen settings.
#define SCREEN_WIDTH 128 // OLED display width, in pixels#define SCREEN_HEIGHT 64 // OLED display height, in pixels#define OLED_RESET -1 // Reset pin # (or -1 if sharing Arduino reset pin)Adafruit_SSD1306 display(SCREEN_WIDTH, SCREEN_HEIGHT, &Wire, OLED_RESET);
⭐ Define monochrome graphics.
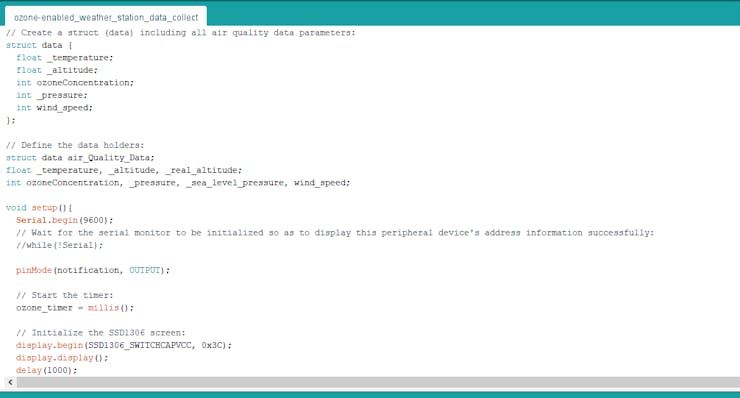
⭐ Create a struct (data) including all data elements to be advertised.
struct data { float _temperature; float _altitude; int ozoneConcentration; int _pressure; int wind_speed;};struct data air_Quality_Data;
⭐ To display the Nano 33 BLE address information successfully, uncomment the line below and wait for the serial monitor to be initialized.
//while(!Serial);
⭐ Start the timer and initialize the SSD1306 screen.
ozone_timer = millis(); // Initialize the SSD1306 screen: display.begin(SSD1306_SWITCHCAPVCC, 0x3C); display.display(); delay(1000);
⭐ In the err_msg function, show the error message on the SSD1306 screen.
void err_msg(){ // Show the error message on the SSD1306 screen. display.clearDisplay(); display.drawBitmap(48, 0, _error, 32, 32, SSD1306_WHITE); display.setTextSize(1); display.setTextColor(SSD1306_WHITE); display.setCursor(0,40); display.println("Check the serial monitor to see the error!"); display.display(); }
⭐ Check the I2C ozone sensor connection status and set the ozone sensor mode (active or passive).
while(!Ozone.begin(Ozone_IICAddress)){ Serial.println("IIC Ozone Sensor is not found!"); err_msg(); delay(1000); } Serial.println("\nIIC Ozone Sensor is connected successfully!\n"); /* Set IIC Ozone Sensor mode: MEASURE_MODE_AUTOMATIC // active mode MEASURE_MODE_PASSIVE // passive mode */ Ozone.SetModes(MEASURE_MODE_PASSIVE);
⭐ Check the BMP180 precision sensor connection status.
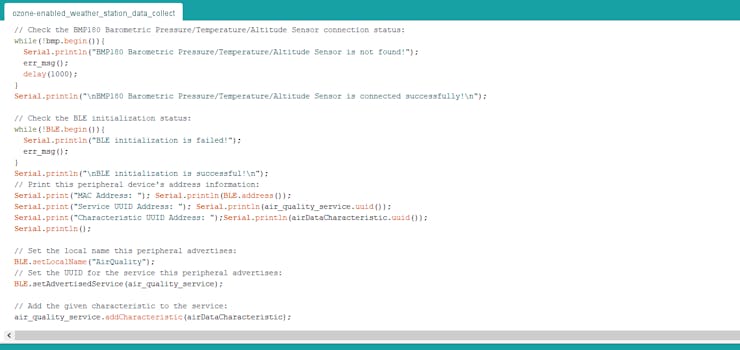
while(!bmp.begin()){ Serial.println("BMP180 Barometric Pressure/Temperature/Altitude Sensor is not found!"); err_msg(); delay(1000); } Serial.println("\nBMP180 Barometric Pressure/Temperature/Altitude Sensor is connected successfully!\n");
⭐ Check the BLE initialization status and print the Nano 33 BLE address information.
while(!BLE.begin()){ Serial.println("BLE initialization is failed!"); err_msg(); } Serial.println("\nBLE initialization is successful!\n"); // Print this peripheral device's address information: Serial.print("MAC Address: "); Serial.println(BLE.address()); Serial.print("Service UUID Address: "); Serial.println(air_quality_service.uuid()); Serial.print("Characteristic UUID Address: ");Serial.println(airDataCharacteristic.uuid()); Serial.println();
⭐ Set the local name (AirQuality) for the Nano 33 BLE and the UUID for the service the Nano 33 BLE advertises.
⭐ Add the data characteristic to the service. Then, add the service to the device.
⭐ Assign event handlers for connected and disconnected devices to/from the Nano 33 BLE.
⭐ Set the initial value for the data characteristic.
⭐ Finally, start advertising (broadcasting) information.
BLE.setLocalName("AirQuality"); // Set the UUID for the service this peripheral advertises: BLE.setAdvertisedService(air_quality_service); // Add the given characteristic to the service: air_quality_service.addCharacteristic(airDataCharacteristic); // Add the service to the device: BLE.addService(air_quality_service); // Assign event handlers for connected, disconnected devices to this peripheral: BLE.setEventHandler(BLEConnected, blePeripheralConnectHandler); BLE.setEventHandler(BLEDisconnected, blePeripheralDisconnectHandler); // Set the initial value for the given characteristic: airDataCharacteristic.writeValue((byte)0); // Start advertising: BLE.advertise(); Serial.println(("Bluetooth device active, waiting for connections..."));
⭐ In the update_characteristics function, update the data characteristic by utilizing the data struct to advertise (transmit) the collected information at once.
void update_characteristics(){ // Update the data characteristic with the data struct: air_Quality_Data._temperature = _temperature; air_Quality_Data._altitude = _altitude; air_Quality_Data.ozoneConcentration = ozoneConcentration; air_Quality_Data._pressure = _pressure; air_Quality_Data.wind_speed = wind_speed; airDataCharacteristic.writeValue((byte *) &air_Quality_Data, 20);}
⭐ Wait until the I2C ozone sensor heats for 3 minutes.
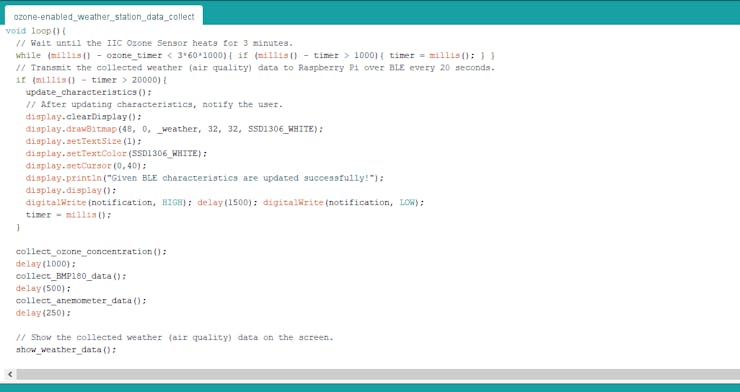
⭐ Advertise (transmit) the collected local weather data with ozone concentration to Raspberry Pi over BLE every 20 seconds.
⭐ After updating characteristics, notify the user by blinking the 5mm green LED.
// Wait until the IIC Ozone Sensor heats for 3 minutes. while (millis() - ozone_timer < 3*60*1000){ if (millis() - timer > 1000){ timer = millis(); } } // Transmit the collected weather (air quality) data to Raspberry Pi over BLE every 20 seconds. if (millis() - timer > 20000){ update_characteristics(); // After updating characteristics, notify the user. display.clearDisplay(); display.drawBitmap(48, 0, _weather, 32, 32, SSD1306_WHITE); display.setTextSize(1); display.setTextColor(SSD1306_WHITE); display.setCursor(0,40); display.println("Given BLE characteristics are updated successfully!"); display.display(); digitalWrite(notification, HIGH); delay(1500); digitalWrite(notification, LOW); timer = millis(); }
⭐ In the collect_ozone_concentration function, get the ozone concentration evaluation generated by the I2C ozone sensor.
void collect_ozone_concentration(){ ozoneConcentration = Ozone.ReadOzoneData(COLLECT_NUMBER); Serial.print("\n\nOzone Concentration => "); Serial.print(ozoneConcentration); Serial.println(" PPB");}
⭐ In the collect_BMP180_data function, obtain temperature, pressure, altitude, sea level pressure, and real altitude values generated by the BMP180 precision sensor:
⭐ Calculate altitude assuming 'standard' barometric pressure of 1013.25 millibars (101325 Pascal).
⭐ If needed, to get a more precise altitude measurement, use the current sea level pressure, which varies with the weather conditions.
void collect_BMP180_data(){ _temperature = bmp.readTemperature(); _pressure = bmp.readPressure(); // Calculate altitude assuming 'standard' barometric pressure of 1013.25 millibars (101325 Pascal). _altitude = bmp.readAltitude(); _sea_level_pressure = bmp.readSealevelPressure(); // To get a more precise altitude measurement, use the current sea level pressure, which will vary with the weather conditions. _real_altitude = bmp.readAltitude(101500); // Print the data generated by the BMP180 Barometric Pressure/Temperature/Altitude Sensor. Serial.print("Temperature => "); Serial.print(_temperature); Serial.println(" *C"); Serial.print("Pressure => "); Serial.print(_pressure); Serial.println(" Pa"); Serial.print("Altitude => "); Serial.print(_altitude); Serial.println(" meters"); Serial.print("Pressure at sea level (calculated) => "); Serial.print(_sea_level_pressure); Serial.println(" Pa"); Serial.print("Real Altitude => "); Serial.print(_real_altitude); Serial.println(" meters");}
⭐ In the collect_anemometer_data function, calculate the wind speed (level) [1 - 30] according to the output voltage (signal).
Since I converted the anemometer's 5V output signal to approximate 3.3V logic input, I changed the original formula and added a calibration value (0.1) according to my experiments with the anemometer kit.
void collect_anemometer_data(){ float outvoltage = (analogRead(A0) * (3.3 / 1023.0)) + 0.1; // Calculate the wind speed (level) [1 - 30] according to the output voltage: wind_speed = 6 * outvoltage; // Print the data generated by the Anemometer Kit. Serial.print("Wind Speed (Level) => "); Serial.print(wind_speed);}
⭐ In the show_weather_data function, display the collected local weather data with ozone concentration on the SSD1306 screen.
void show_weather_data(){ display.clearDisplay(); display.setTextSize(1); display.setTextColor(SSD1306_WHITE); display.setCursor(0,8); display.println("Ozone Con. => " + String(ozoneConcentration) + " PPB"); display.println("Wind Speed => " + String(wind_speed)); display.println("Temp. => " + String(_temperature) + " *C"); display.println("Pressure => " + String(_pressure) + " Pa"); display.println("Altitude => " + String(_altitude) + " m"); display.display(); }


Step 3.1: Advertising local weather data and ozone concentration with the weather station
After uploading and running the code for collecting local weather data with ozone concentration and advertising (transmitting) information over BLE on the Nano 33 BLE:
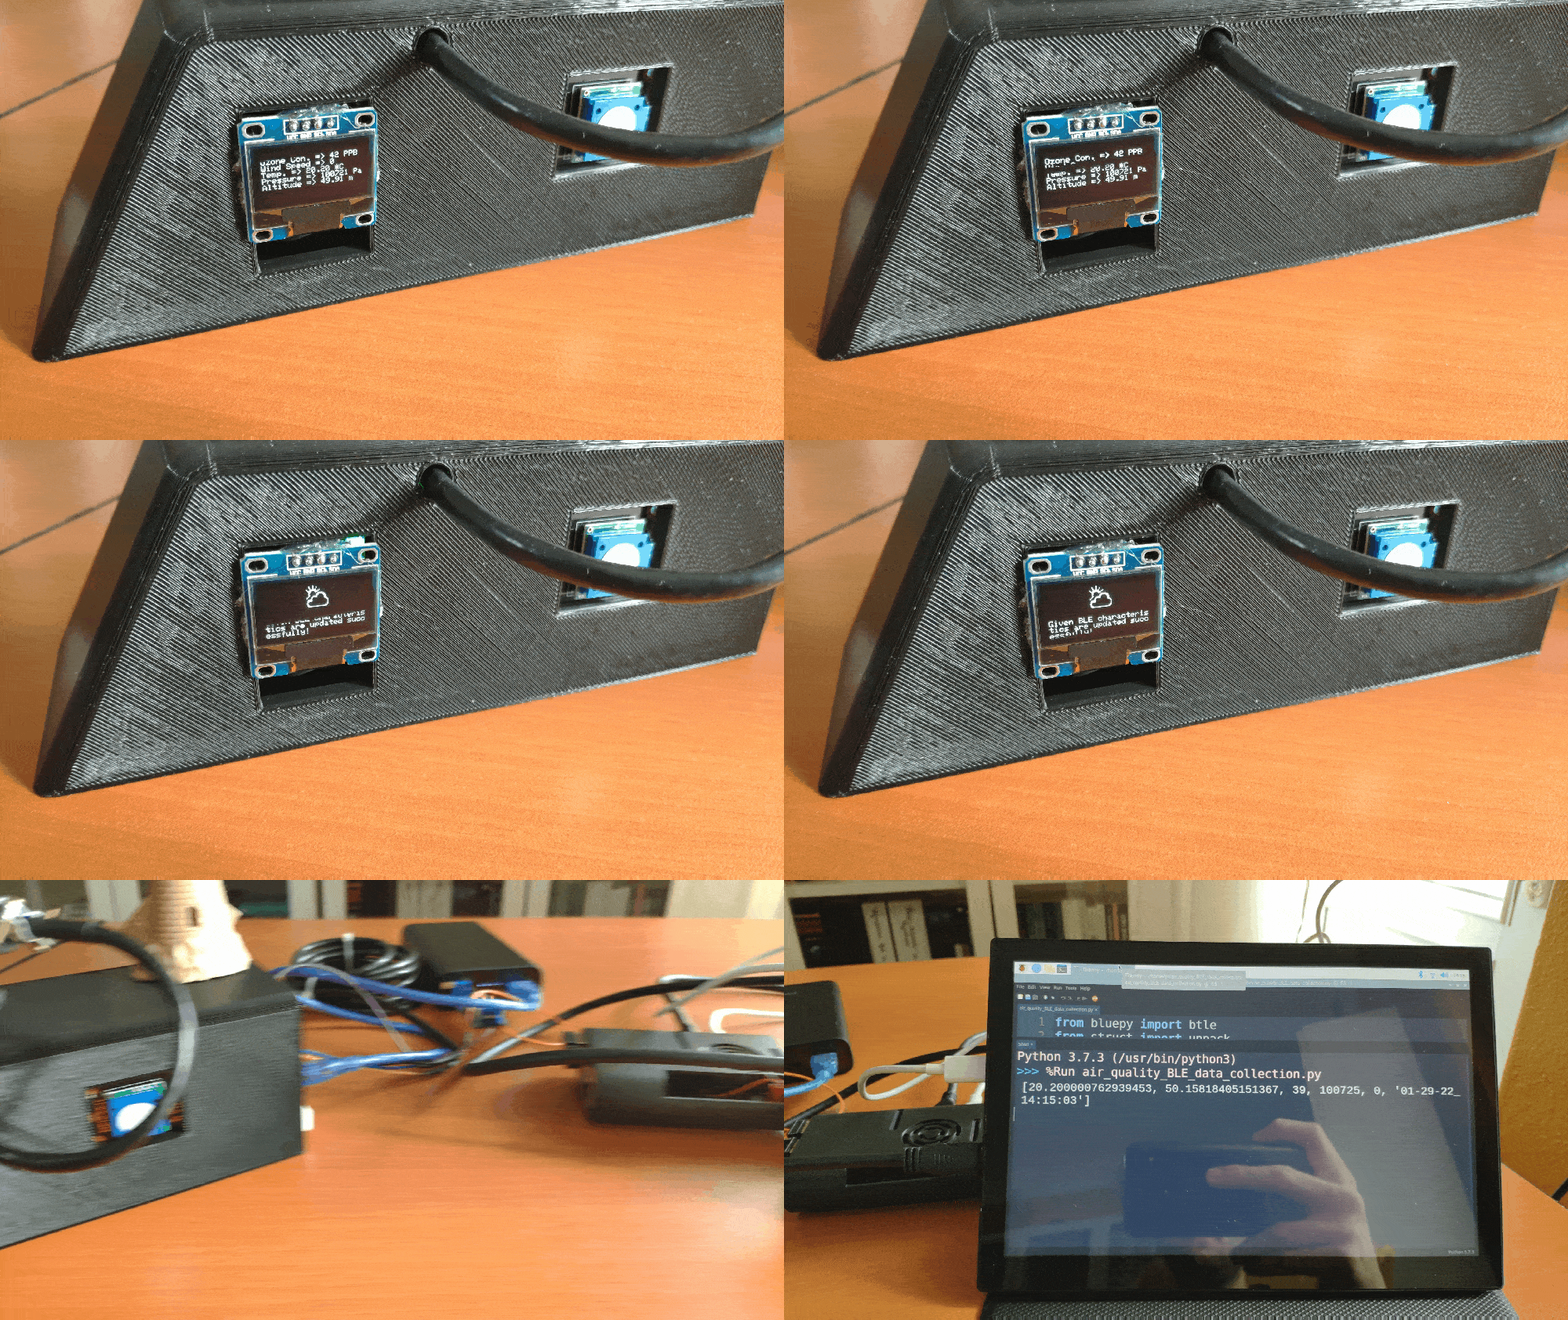
🌳🏭 The weather station waits until the I2C ozone sensor heats for 3 minutes.

🌳🏭 Then, the weather station displays all data elements to be advertised (transmitted) to the central device (Raspberry Pi) on the SSD1306 OLED screen:
- Ozone concentration (PPB)
- Wind speed (level)
- Temperature (°C)
- Pressure (Pa)
- Altitude (m)
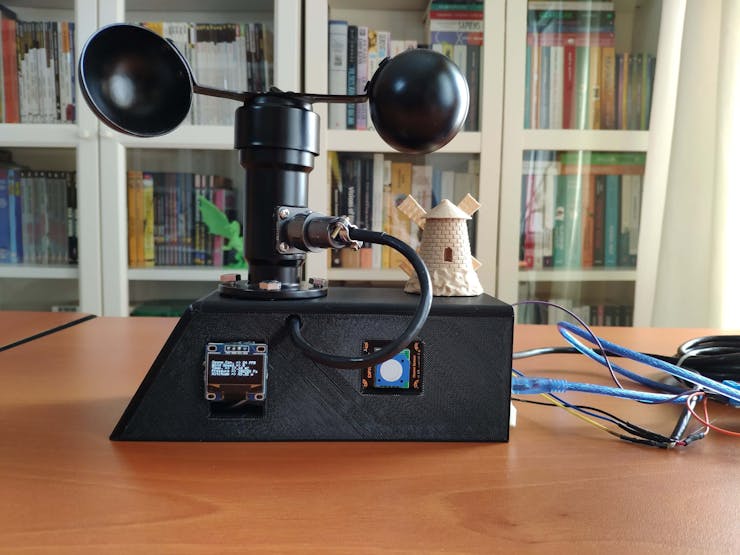

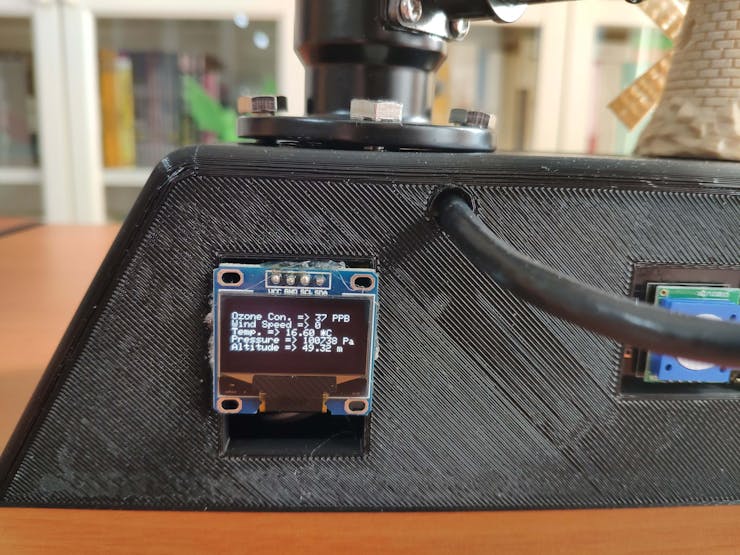
🌳🏭 The weather station advertises (transmits) the collected local weather data with ozone concentration to the central device over BLE every 20 seconds.
🌳🏭 After updating characteristics and transmitting the data packet successfully, the weather station notifies the user by making the 5mm green LED blink and displaying this message on the SSD1306 screen: Given BLE characteristics are updated successfully!

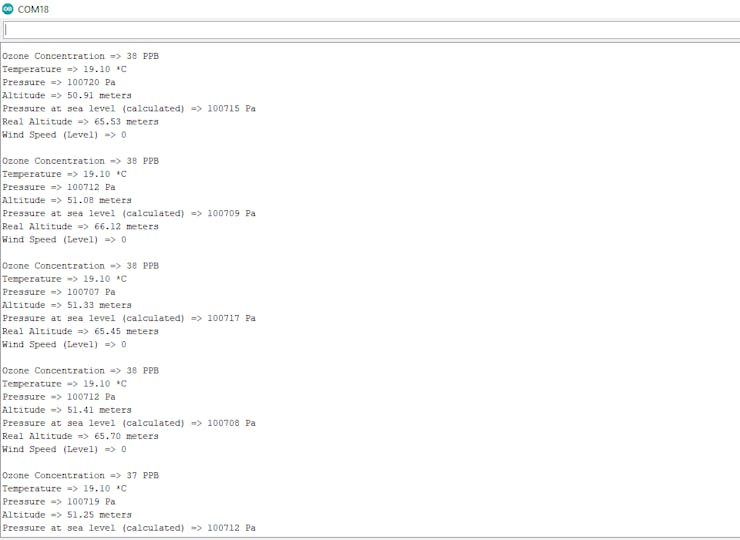
🌳🏭 Also, the weather station prints the collected local weather data with ozone concentration on the serial monitor.
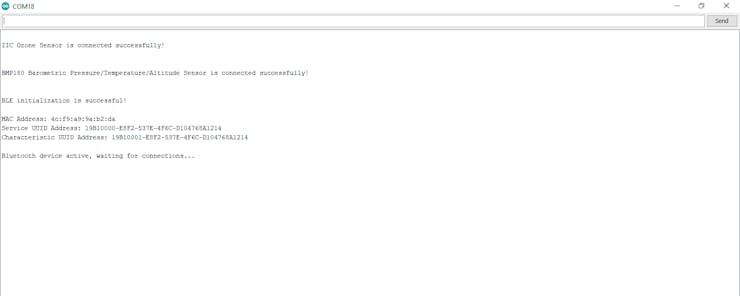
🌳🏭 If required, the weather station prints the Nano 33 BLE (peripheral device) address information on the serial monitor:
MAC Address: 4c:f9:a9:9a:b2:da
Service UUID Address: 19B10000-E8F2-537E-4F6C-D104768A1214
Characteristic UUID Address: 19B10001-E8F2-537E-4F6C-D104768A1214
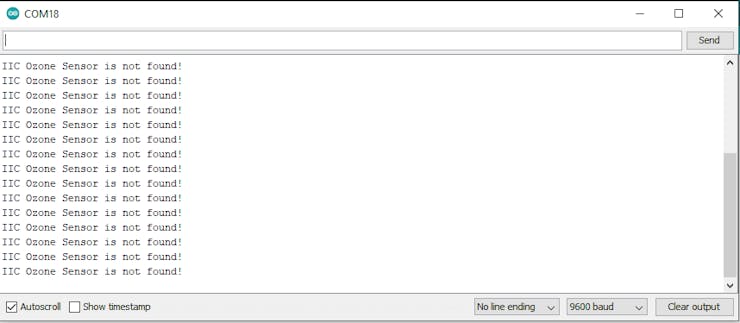
🌳🏭 If the Nano 33 BLE encounters an error while running the code, the weather station shows the error message on the SSD1306 screen and prints the error description on the serial monitor.

Step 4: Logging data broadcasted by the Nano 33 BLE w/ Raspberry Pi
After setting up the Nano 33 BLE as the peripheral device to advertise (transmit) data packets over BLE, I decided to employ my Raspberry Pi 4 as the central device to log the collected local weather data with ozone concentration.
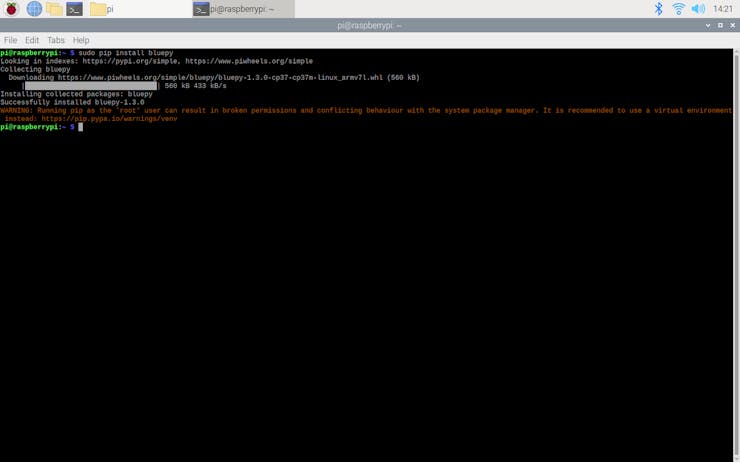
First, to enable BLE communication in Python, I installed the bluepy module by executing the command below:
sudo pip install bluepy
To receive data packets over BLE and save them to a CSV file, I developed an application in Python. As shown below, the application consists of two files:
- air_quality_BLE_data_collection.py
- air_quality_data_set.csv
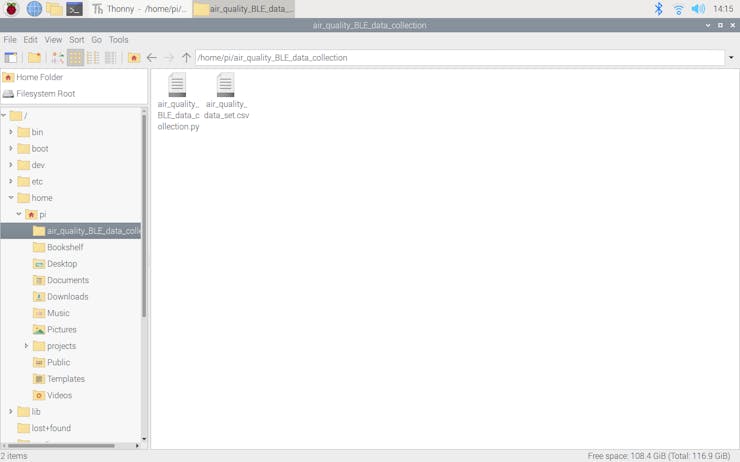
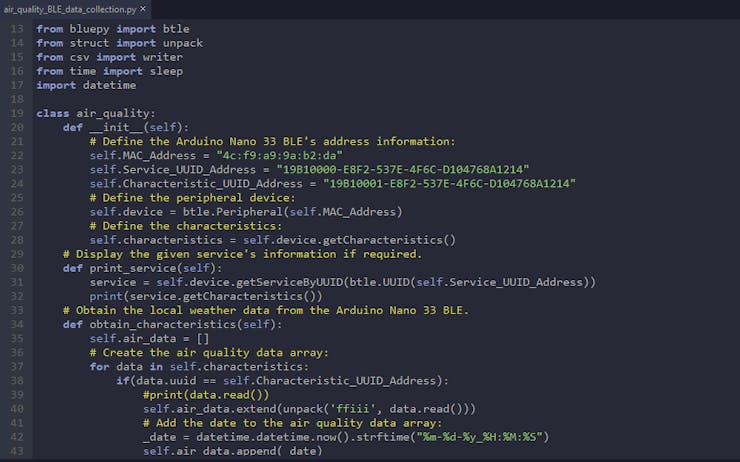
Then, I created a class named air_quality in the air_quality_BLE_data_collection.py file to execute the following functions precisely.
⭐ Include the required modules.
from bluepy import btlefrom struct import unpackfrom csv import writerfrom time import sleepimport datetime
⭐ In the __init__ function, define the peripheral device and characteristics with the Nano 33 BLE address information.
def __init__(self): # Define the Arduino Nano 33 BLE's address information: self.MAC_Address = "4c:f9:a9:9a:b2:da" self.Service_UUID_Address = "19B10000-E8F2-537E-4F6C-D104768A1214" self.Characteristic_UUID_Address = "19B10001-E8F2-537E-4F6C-D104768A1214" # Define the peripheral device: self.device = btle.Peripheral(self.MAC_Address) # Define the characteristics: self.characteristics = self.device.getCharacteristics()
⭐ In the print_service function, display the given service information if required.
def print_service(self): service = self.device.getServiceByUUID(btle.UUID(self.Service_UUID_Address)) print(service.getCharacteristics())
⭐ In the obtain_characteristics function, create an array (air_data) from the received data packet over BLE:
⭐ By utilizing the unpack function, decode the data packet advertised (transmitted) by the Nano 33 BLE as a struct. Then, add the derived data elements to the air_data array.
⭐ Append the current date and time as a data element to the air_data array.
⭐ Print the air_data array.
def obtain_characteristics(self): self.air_data = [] # Create the air quality data array: for data in self.characteristics: if(data.uuid == self.Characteristic_UUID_Address): #print(data.read()) self.air_data.extend(unpack('ffiii', data.read())) # Add the date to the air quality data array: _date = datetime.datetime.now().strftime("%m-%d-%y_%H:%M:%S") self.air_data.append(_date) # Print the air quality data array: print(self.air_data) sleep(1)
⭐ In the insert_data_to_CSV function, insert the recently generated air_data array into the given CSV file as a new row.
def insert_data_to_CSV(self, file_name): with open(file_name, "a", newline="") as f: # Add a new row: writer(f).writerow(self.air_data) f.close()
⭐ Get the updated characteristics over BLE and insert them into the given CSV file every 30 seconds.
⭐ If the KeyboardInterrupt is caught, disconnect from the peripheral device.
try: while True: # Get the updated characteristics and insert them into the given CSV file every 30 seconds: air_quality_data.obtain_characteristics() air_quality_data.insert_data_to_CSV("air_quality_data_set.csv") sleep(30)except KeyboardInterrupt: # Disconnect BLE: air_quality_data.device.disconnect() print("\r\nPeripheral Disconnected!")

After executing the code for logging the transmitted data packets:
🌳🏭 Every 30 seconds, Raspberry Pi converts the data packet advertised (transmitted) by the Nano 33 BLE as a struct to an array, adds the current date and time as a data element, and prints the recently generated array on the shell.
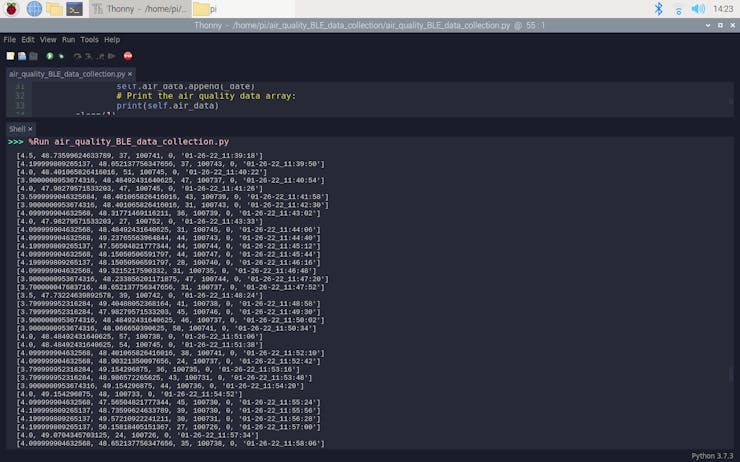
🌳🏭 Then, Raspberry Pi inserts the recently generated array to the air_quality_data_set.csv file as a new row.

🌳🏭 If the KeyboardInterrupt Is caught, Raspberry Pi disconnects from the peripheral device (Nano 33 BLE).
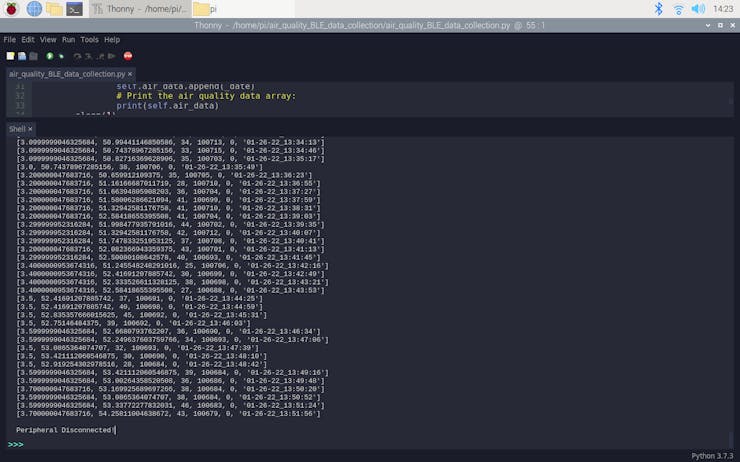
As far as my experiments go while transmitting data packets from my balcony to my house (below 3 meters), I have not encountered any problems :)


Step 5: Obtaining Air Quality Index (AQI) estimations by date to assign accurate labels
Since motley phenomena and the vagaries of the weather, some of which are not fully fathomed yet, have a veritable impact on air quality, it is struggling to extrapolate and interpret air quality levels by merely utilizing limited local weather data with ozone concentration without applying algorithms. Therefore, I decided to build and train a neural network model to forecast air quality levels with the weather station in the field.
However, before training my neural network, I needed to assign accurate labels for each data record so as to forecast air quality levels precisely with the limited data volume.
Since IQAir calculates the Air Quality Index (AQI) estimations based on satellite PM2.5 data for locations lacking ground-based air monitoring stations and provides hourly AQI estimations with air quality levels by location, I decided to employ IQAir to obtain accurate labels for my neural network model.
Therefore, while collecting local weather data with ozone concentration over BLE, I added the current date and time as a data element.
📌 Data elements:
- Temperature
- Altitude
- Ozone_Concentration
- Pressure
- Wind Speed
- Date
By utilizing the Date element (attribute), I derived labels for each data record from AQI assessments for my location provided by IQAir:
- 0 — Good
- 1 — Moderate
- 2 — Unhealthy
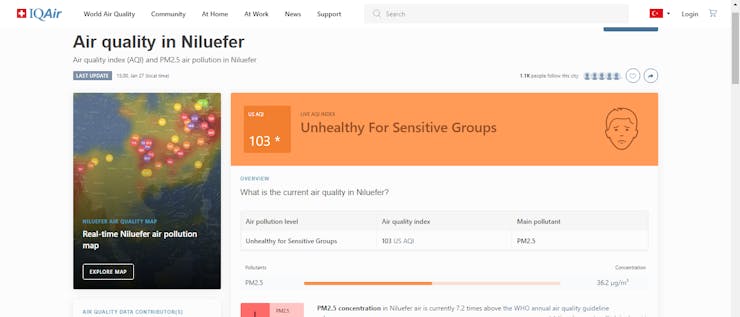
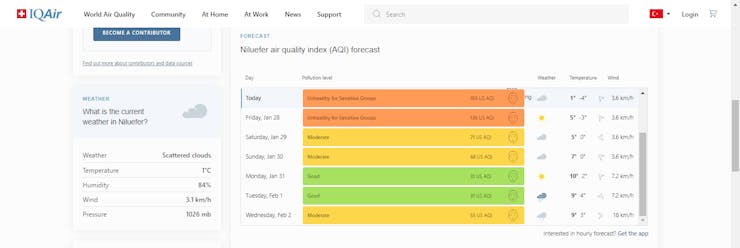

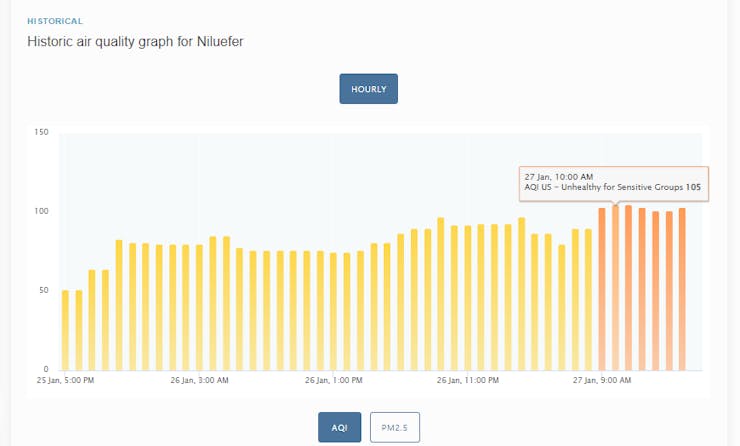
After collecting local weather data with ozone concentration for 15 days, I assigned a label for each data record and stored them in the labels NumPy array in the labels.py file.

Step 6: Building an Artificial Neural Network (ANN) with TensorFlow
When I completed collating my local weather data set (w/ ozone concentration) and deriving labels, I had started to work on my artificial neural network model (ANN) to make predictions on air quality levels (classes).
I decided to create my neural network model with TensorFlow in Python. Thus, first of all, I followed the steps below to grasp a better understanding of my data set so as to train my model accurately:
- Data Visualization
- Data Scaling (Normalizing)
- Data Preprocessing
- Data Splitting
As explained in the previous steps, I derived labels from the Air Quality Index (AQI) estimations for my location provided by IQAir. Since I had already stored the obtained labels in the labels.py file, I preprocessed my data set effortlessly to assign labels for each data record (input):
- 0 — Good
- 1 — Moderate
- 2 — Unhealthy
After scaling (normalizing) and preprocessing inputs, I obtained five input variables and one label for each data record in my data set. Then, I built an artificial neural network model with TensorFlow and trained it with my training data set to acquire the best results and predictions possible.
Layers:
- 5 [Input]
- 128 [Hidden]
- 64 [Hidden]
- 3 [Output]
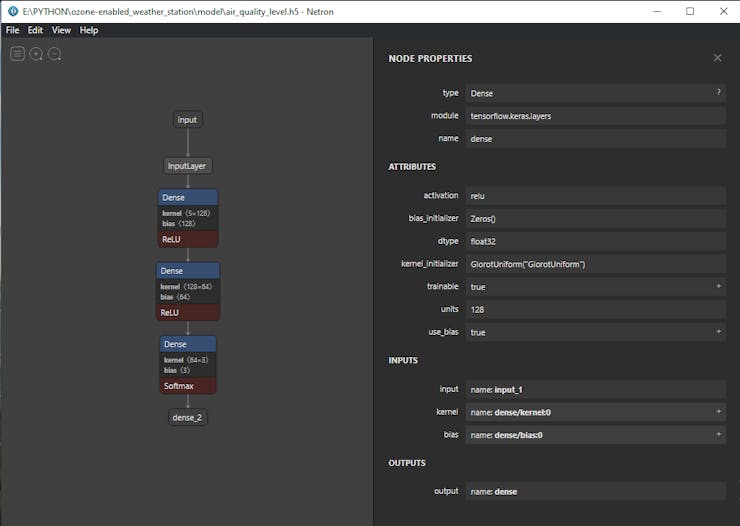
To execute all steps above and convert my model from a TensorFlow Keras H5 model to a C array (.h file) to run it successfully on the Nano 33 BLE, I developed an application in Python. As shown below, the application consists of three code files and two folders:
- main.py
- labels.py
- tflite_to_c_array.py
- /data
- /model
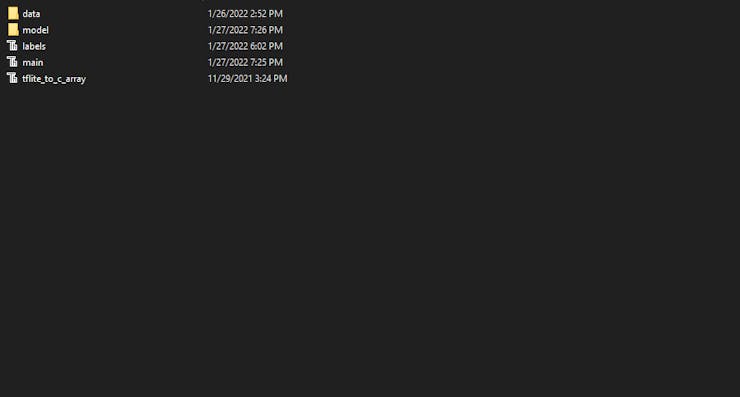
First of all, I created a class named Air_Quality_Level in the main.py file to execute the following functions precisely.
⭐ Include the required modules.
import tensorflow as tffrom tensorflow import kerasimport matplotlib.pyplot as pltimport numpy as npimport pandas as pdfrom tflite_to_c_array import hex_to_c_arrayfrom labels import labels
⭐ In the __init__ function, define the required variables and read the local weather data set (w/ ozone concentration) from the given CSV file.
def __init__(self, csv_path): self.inputs = [] self.labels = [] self.model_name = "air_quality_level" # Read the collated local weather data set: self.df = pd.read_csv(csv_path)
I will elucidate each file and function in detail in the following steps.

Step 6.1: Visualizing the local weather data set by ozone concentration
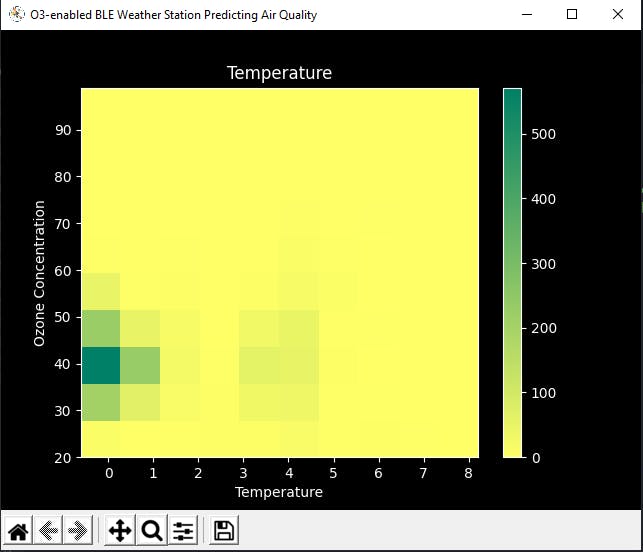
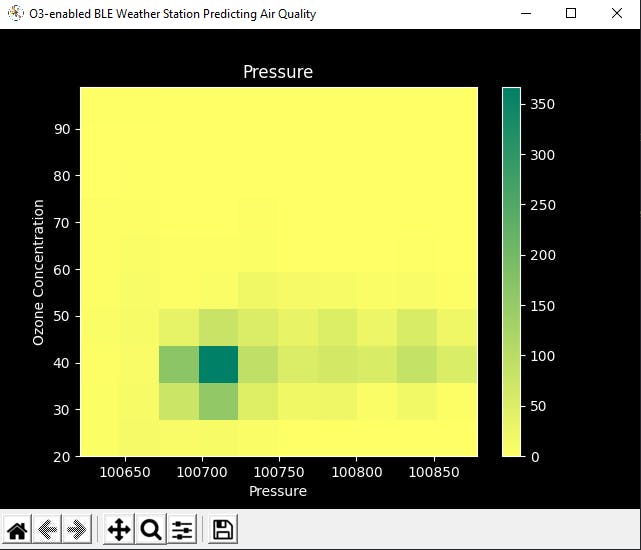
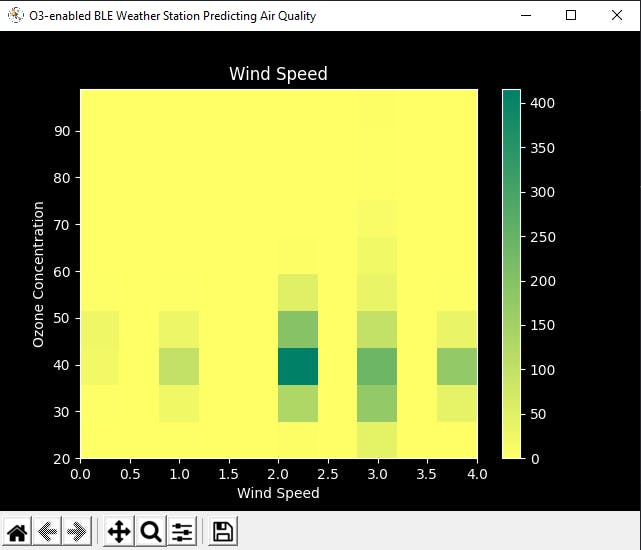
Since it is essential to understand a given data set to pass appropriately formatted inputs and labels to a neural network model, I decided to visualize my data set and scale (normalize) it in Python after reading it from the air_quality_data_set.csv file saved in the data folder.
⭐ In the graphics function, visualize the requested data column (field) from the given data set by utilizing the Matplotlib library.
def graphics(self, column_1, column_2, x_label, y_label): # Show the requested data column from the data set: plt.style.use("dark_background") plt.gcf().canvas.set_window_title('O3-enabled BLE Weather Station Predicting Air Quality') plt.hist2d(self.df[column_1], self.df[column_2], cmap="summer_r") plt.colorbar() plt.xlabel(x_label) plt.ylabel(y_label) plt.title(x_label) plt.show()
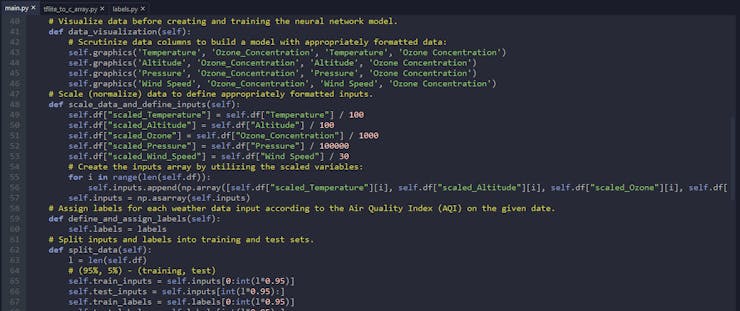
⭐ In the data_visualization function, scrutinize all data columns (fields) before scaling and preprocessing the given data set to build a neural network model with appropriately formatted data.
def data_visualization(self): # Scrutinize data columns to build a model with appropriately formatted data: self.graphics('Temperature', 'Ozone_Concentration', 'Temperature', 'Ozone Concentration') self.graphics('Altitude', 'Ozone_Concentration', 'Altitude', 'Ozone Concentration') self.graphics('Pressure', 'Ozone_Concentration', 'Pressure', 'Ozone Concentration') self.graphics('Wind Speed', 'Ozone_Concentration', 'Wind Speed', 'Ozone Concentration')

Step 6.2: Assigning labels and scaling (normalizing) data records to create inputs
After visualizing my data set, I needed to create inputs from data records to train my neural network model. Therefore, I utilized these five data elements to create inputs:
- Temperature
- Altitude
- Ozone_Concentration
- Pressure
- Wind Speed
Then, I scaled (normalized) each data element to format them properly and thus extracted these scaled data elements from my data set for each data record:
- scaled_Temperature
- scaled_Altitude
- scaled_Ozone
- scaled_Pressure
- scaled_Wind_Speed
⭐ In the scale_data_and_define_inputs function, divide every data element into their required values so as to make them smaller than or equal to 1.
⭐ Then, create inputs with the scaled data elements, append them to the inputs array, and convert this array to a NumPy array by using the asarray() function.
⭐ Each input includes five parameters [shape=(5, )]:
- [0.012999999523162841, 0.40875782012939454, 0.043, 0.99819, 0.1]
def scale_data_and_define_inputs(self): self.df["scaled_Temperature"] = self.df["Temperature"] / 100 self.df["scaled_Altitude"] = self.df["Altitude"] / 100 self.df["scaled_Ozone"] = self.df["Ozone_Concentration"] / 1000 self.df["scaled_Pressure"] = self.df["Pressure"] / 100000 self.df["scaled_Wind_Speed"] = self.df["Wind Speed"] / 30 # Create the inputs array by utilizing the scaled variables: for i in range(len(self.df)): self.inputs.append(np.array([self.df["scaled_Temperature"][i], self.df["scaled_Altitude"][i], self.df["scaled_Ozone"][i], self.df["scaled_Pressure"][i], self.df["scaled_Wind_Speed"][i]])) self.inputs = np.asarray(self.inputs)
As explained in Step 5, I derived labels for each data record from AQI assessments for my location provided by IQAir:
- 0 — Good
- 1 — Moderate
- 2 — Unhealthy
⭐ In the define_and_assign_labels function, get predefined labels [0 - 2] based on AQI estimations for each input and append them to the labels array.
def define_and_assign_labels(self): self.labels = labels
Step 6.3: Training the model (ANN) on air quality levels (classes)
After preprocessing and scaling (normalizing) my data set to create inputs and labels, I split them as training (95%) and test (5%) sets:
def split_data(self): l = len(self.df) # (95%, 5%) - (training, test) self.train_inputs = self.inputs[0:int(l*0.95)] self.test_inputs = self.inputs[int(l*0.95):] self.train_labels = self.labels[0:int(l*0.95)] self.test_labels = self.labels[int(l*0.95):]
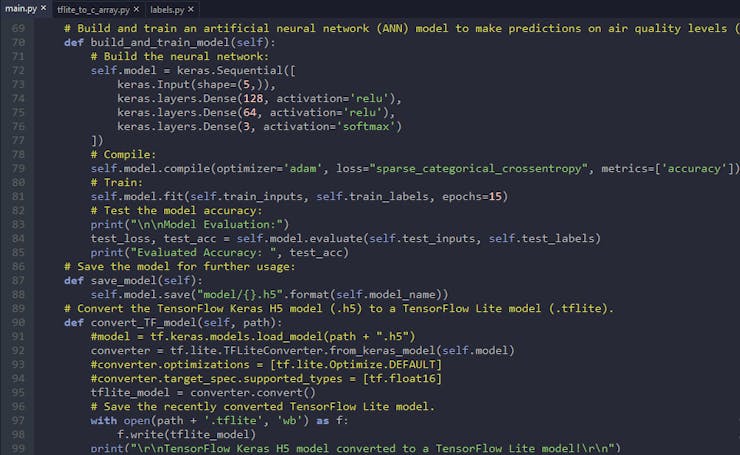
Then, I built my artificial neural network model (ANN) by utilizing Keras and trained it with the training set for 100 epochs.
You can inspect these tutorials to learn about activation functions, loss functions, epochs, etc.
def build_and_train_model(self): # Build the neural network: self.model = keras.Sequential([ keras.Input(shape=(5,)), keras.layers.Dense(128, activation='relu'), keras.layers.Dense(64, activation='relu'), keras.layers.Dense(3, activation='softmax') ]) # Compile: self.model.compile(optimizer='adam', loss="sparse_categorical_crossentropy", metrics=['accuracy']) # Train: self.model.fit(self.train_inputs, self.train_labels, epochs=100) ...
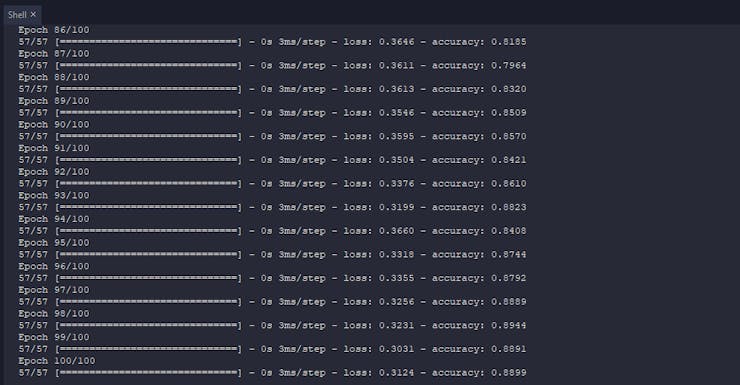
After training with the training set (inputs and labels), the accuracy of my neural network model is between 0.83 and 0.89.
Step 6.4: Evaluating the model accuracy and converting the model to a C array
After building and training my artificial neural network model, I tested its accuracy and validity by utilizing the testing data set (inputs and labels).
The evaluated accuracy of the model is 0.9158.
... # Test the model accuracy: print("\n\nModel Evaluation:") test_loss, test_acc = self.model.evaluate(self.test_inputs, self.test_labels) print("Evaluated Accuracy: ", test_acc)

After evaluating my neural network model, I saved it as a TensorFlow Keras H5 model (air_quality_level.h5) to the model folder.
def save_model(self): self.model.save("model/{}.h5".format(self.model_name))
However, running a TensorFlow Keras H5 model on the Nano 33 BLE to make predictions on air quality levels is not eligible and efficient considering size, latency, and power consumption.
Thus, I converted my neural network model from a TensorFlow Keras H5 model (.h5) to a TensorFlow Lite model (.tflite). Then, I modified the TensorFlow Lite model to create a C array (.h file) to run the model on the Nano 33 BLE successfully.
To revise the TensorFlow Lite model as a C array, I applied the hex_to_c_array function copied directly from this tutorial to the tflite_to_c_array.py file.

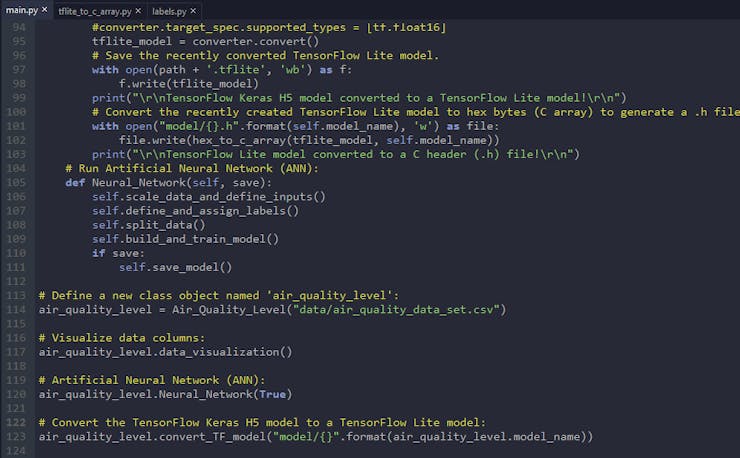
⭐ In the convert_TF_model function, convert the recently trained and evaluated model to a TensorFlow Lite model by applying the TensorFlow Lite converter (tf.lite.TFLiteConverter.from_keras_model).
⭐ Then, save the generated TensorFlow Lite model to the model folder (air_quality_level.tflite).
⭐ Modify the saved TensorFlow Lite model to a C array (.h file) by executing the hex_to_c_array function.
⭐ Finally, save the generated C array to the model folder (air_quality_level.h).
def convert_TF_model(self, path): #model = tf.keras.models.load_model(path + ".h5") converter = tf.lite.TFLiteConverter.from_keras_model(self.model) #converter.optimizations = [tf.lite.Optimize.DEFAULT] #converter.target_spec.supported_types = [tf.float16] tflite_model = converter.convert() # Save the recently converted TensorFlow Lite model. with open(path + '.tflite', 'wb') as f: f.write(tflite_model) print("\r\nTensorFlow Keras H5 model converted to a TensorFlow Lite model!\r\n") # Convert the recently created TensorFlow Lite model to hex bytes (C array) to generate a .h file string. with open("model/{}.h".format(self.model_name), 'w') as file: file.write(hex_to_c_array(tflite_model, self.model_name)) print("\r\nTensorFlow Lite model converted to a C header (.h) file!\r\n")
Step 7: Setting up the model on the Arduino Nano 33 BLE
Step 8: Running the model on the Nano 33 BLE to make predictions on air quality levels
My neural network model predicts possibilities of labels (air quality classes) for each given input as an array of 3 numbers. They represent the model's "confidence" that the given input array corresponds to each of the three different air quality classes based on the Air Quality Index (AQI) estimations [0 - 2], as shown in Step 6:
- 0 — Good
- 1 — Moderate
- 2 — Unhealthy
After importing and setting up my neural network model as a C array on the Nano 33 BLE successfully, I utilized the model to run inferences to forecast air quality levels.
After executing the code for running inferences on the Nano 33 BLE:
🌳🏭 The weather station waits until the I2C ozone sensor heats for 3 minutes.
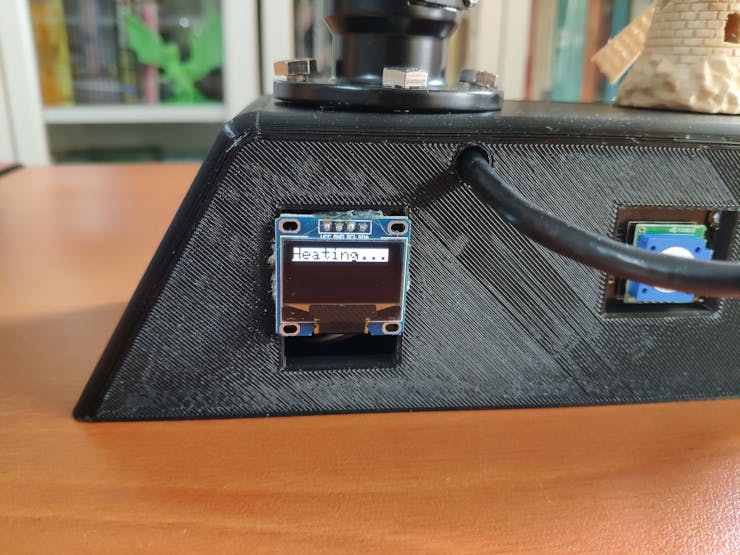
🌳🏭 Then, the weather station displays all data elements to be utilized in an input while running inference with the model on the SSD1306 OLED screen:
- Ozone concentration (PPB)
- Wind speed (level)
- Temperature (°C)
- Pressure (Pa)
- Altitude (m)

🌳🏭 If the model initialization button is pressed, the weather station runs inference with the model by employing the most recently generated local weather data with ozone concentration as the input.
🌳🏭 Then, the weather station displays the output, which represents the most accurate label (air quality class) predicted by the model.
🌳🏭 Also, after running inference successfully, the weather station notifies the user by making the 5mm green LED blink.


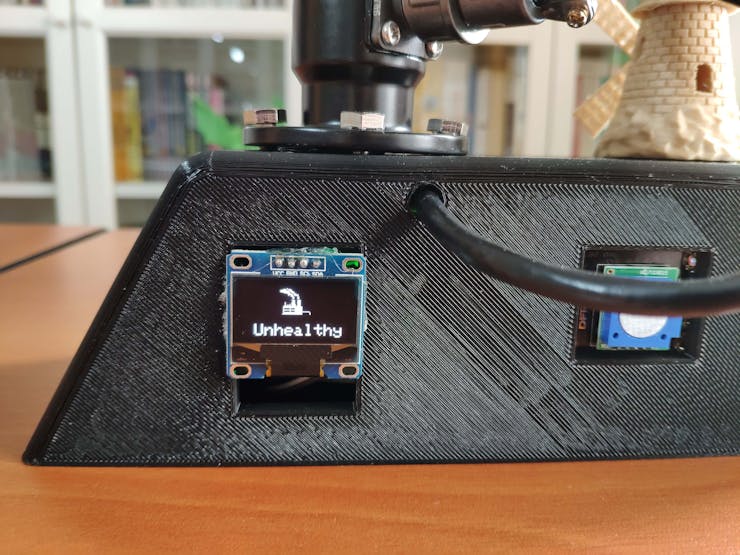
As far as my experiments go, the weather station operates impeccably while forecasting air quality levels :)
 kutluhan_aktar