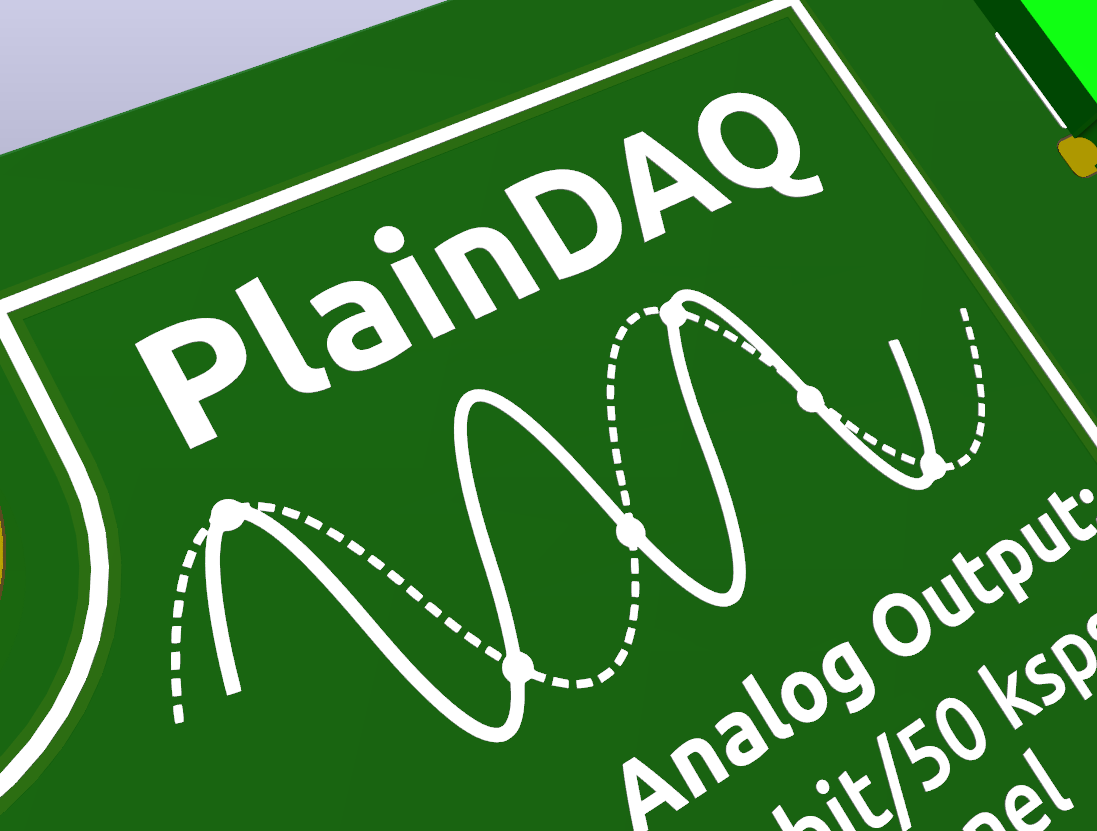
I've been working on a new revision of PlainDAQ and I had an empty space left on my PCB. I decided to fill it up with some visuals related to sampling theory.
Here is what I've drawn: The thick line supposed to be the signal that's being measured and the dotted line supposed to be the reconstructed waveform. To be honest not sure if it's terrrible accurate depiction.

Let us hope that it will be printed well on the silkscreen layer
I drew this on inkscape and imported it to KiCAD via image converter.
 Alperen
Discussions
Become a Hackaday.io Member
Create an account to leave a comment. Already have an account? Log In.