I created the following gcode for the Y axis, which merely shakes it back and forth at 240mm/s:
G28 Y
G0 Y125 Z125 F3600
G0 F14400


G0 Y125 ;line 10
G0 Y175
G0 Y125
G0 Y175
[continues till line 3010]
It's similar to X, but it went 125 -> 150 -> 125 to try and amplify the vibrations. This gcode is designed for back-to-back rounds, so do a full homing first before the very first round.
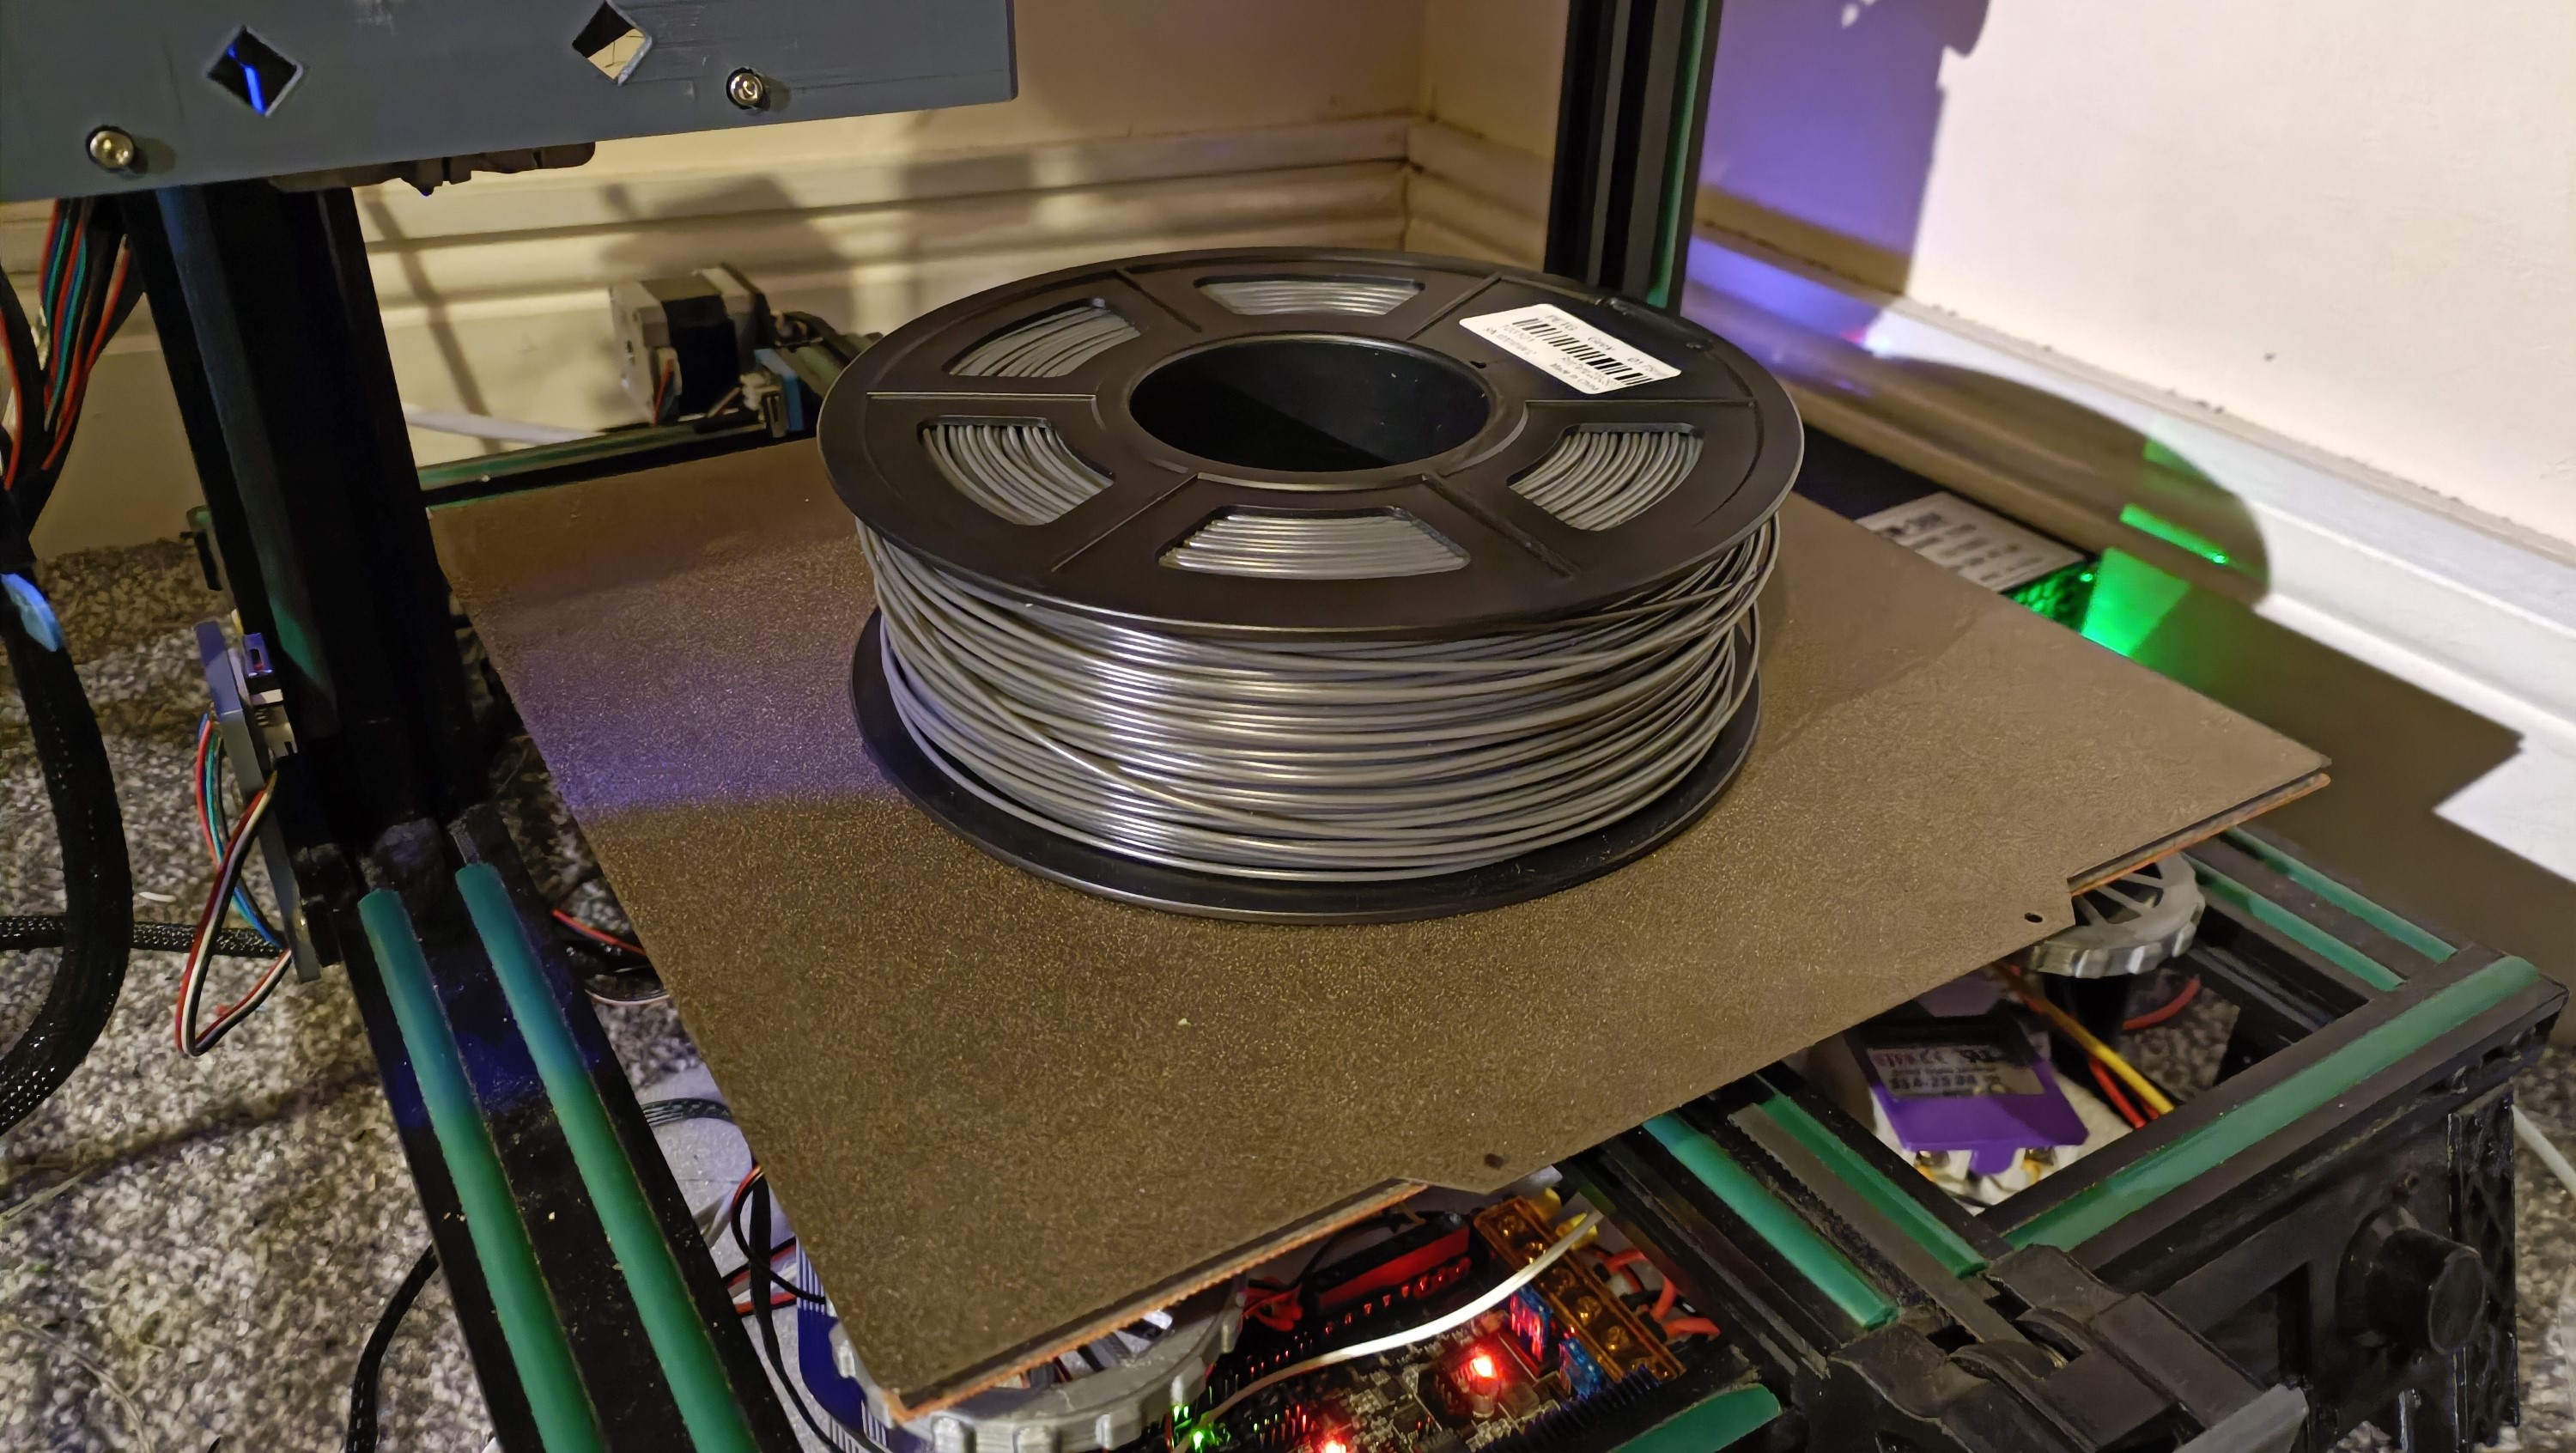
Running them, with Junction Deviation set to the max value of 0.3mm, I determined that 9000mm/s2 and 3600mm/s2 were acceptable acceleration limits for the X and Y axis respectively. I made sure to do the test of the latter with a 1kg spool ontop to ensure that the printer wont skip steps with a large print:
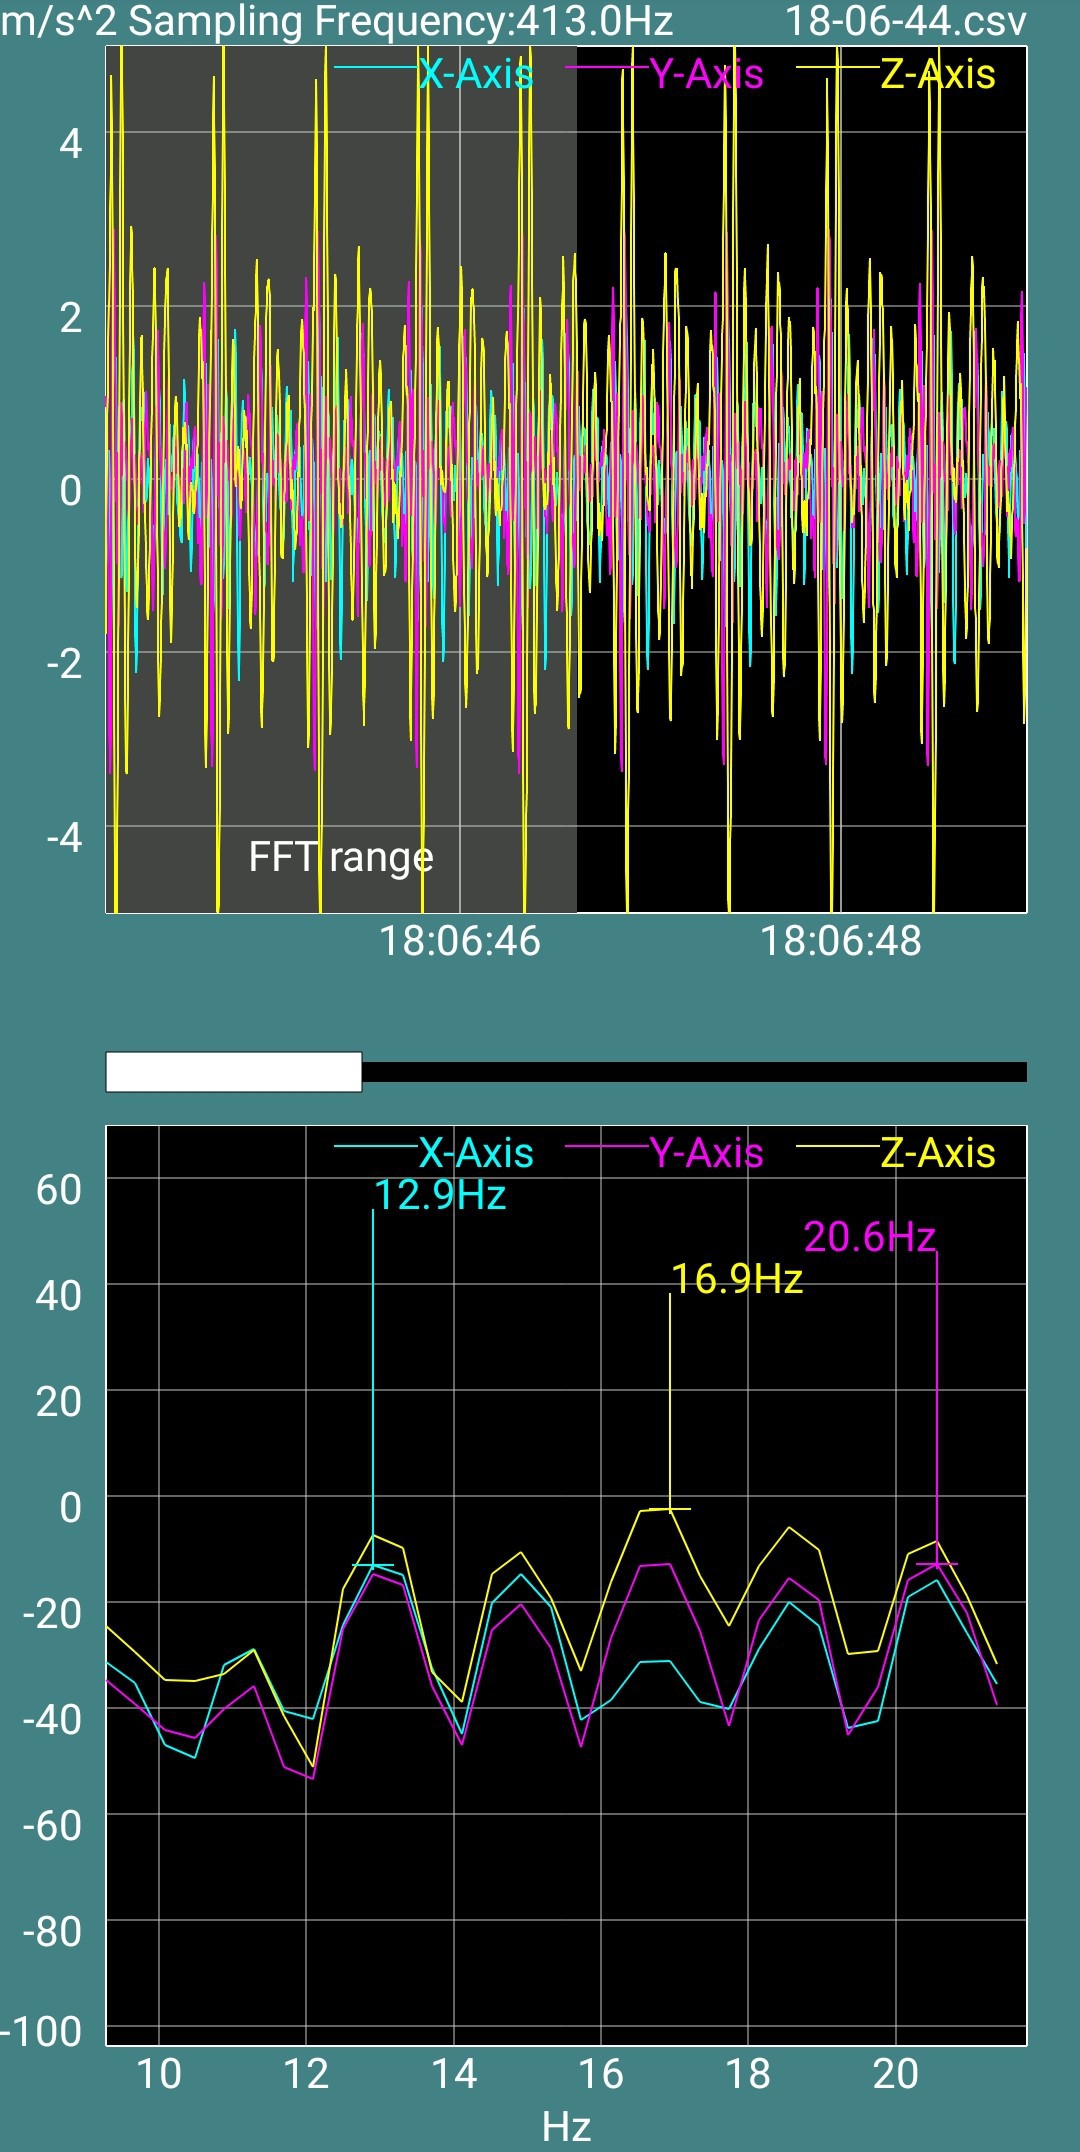
Disappointed by the inconclusive results from the Marlin test pattern or vase-mode frequency sweep, I was able to find FFTSensor, a nifty app on the Play store. This takes either accelerometer (or gyroscope) data and puts it through a fast fourier transform to show a smooth-framerate real-time graph that allows me to pick out specific frequencies.
In my testing, I found it was best to use the linear scale so that I could zoom in and guestimate where multiple peaks were, not just the absolute highest. I also found it was best to press my phone against the Z-axis extrusion so that the readings weren't dominated by the low frequency swaying of the axis (e.g. 2Hz for the Y axis).
From the aforementioned attempts to calibrate input shaping, I had zeta factors in excess of 0.5, but the vibrations felt weakest at 0 and just gradually increased the more I increased the value. It also took a while for me to realise I could set the frequency to 0 to disable shaping for that axis; before I found that out, I just threw in some high number like 99Hz.
Anyway, with the gcode and app, the frequencies were very easy to see and change values to see/hear their effect. A common tactic I employed was to jump between peaks, hear/feel the result and then jump to the new highest peak. For the Y axis, it flip-flopped from 12.9Hz and 20.6Hz, but the latter sounded and felt smoother.
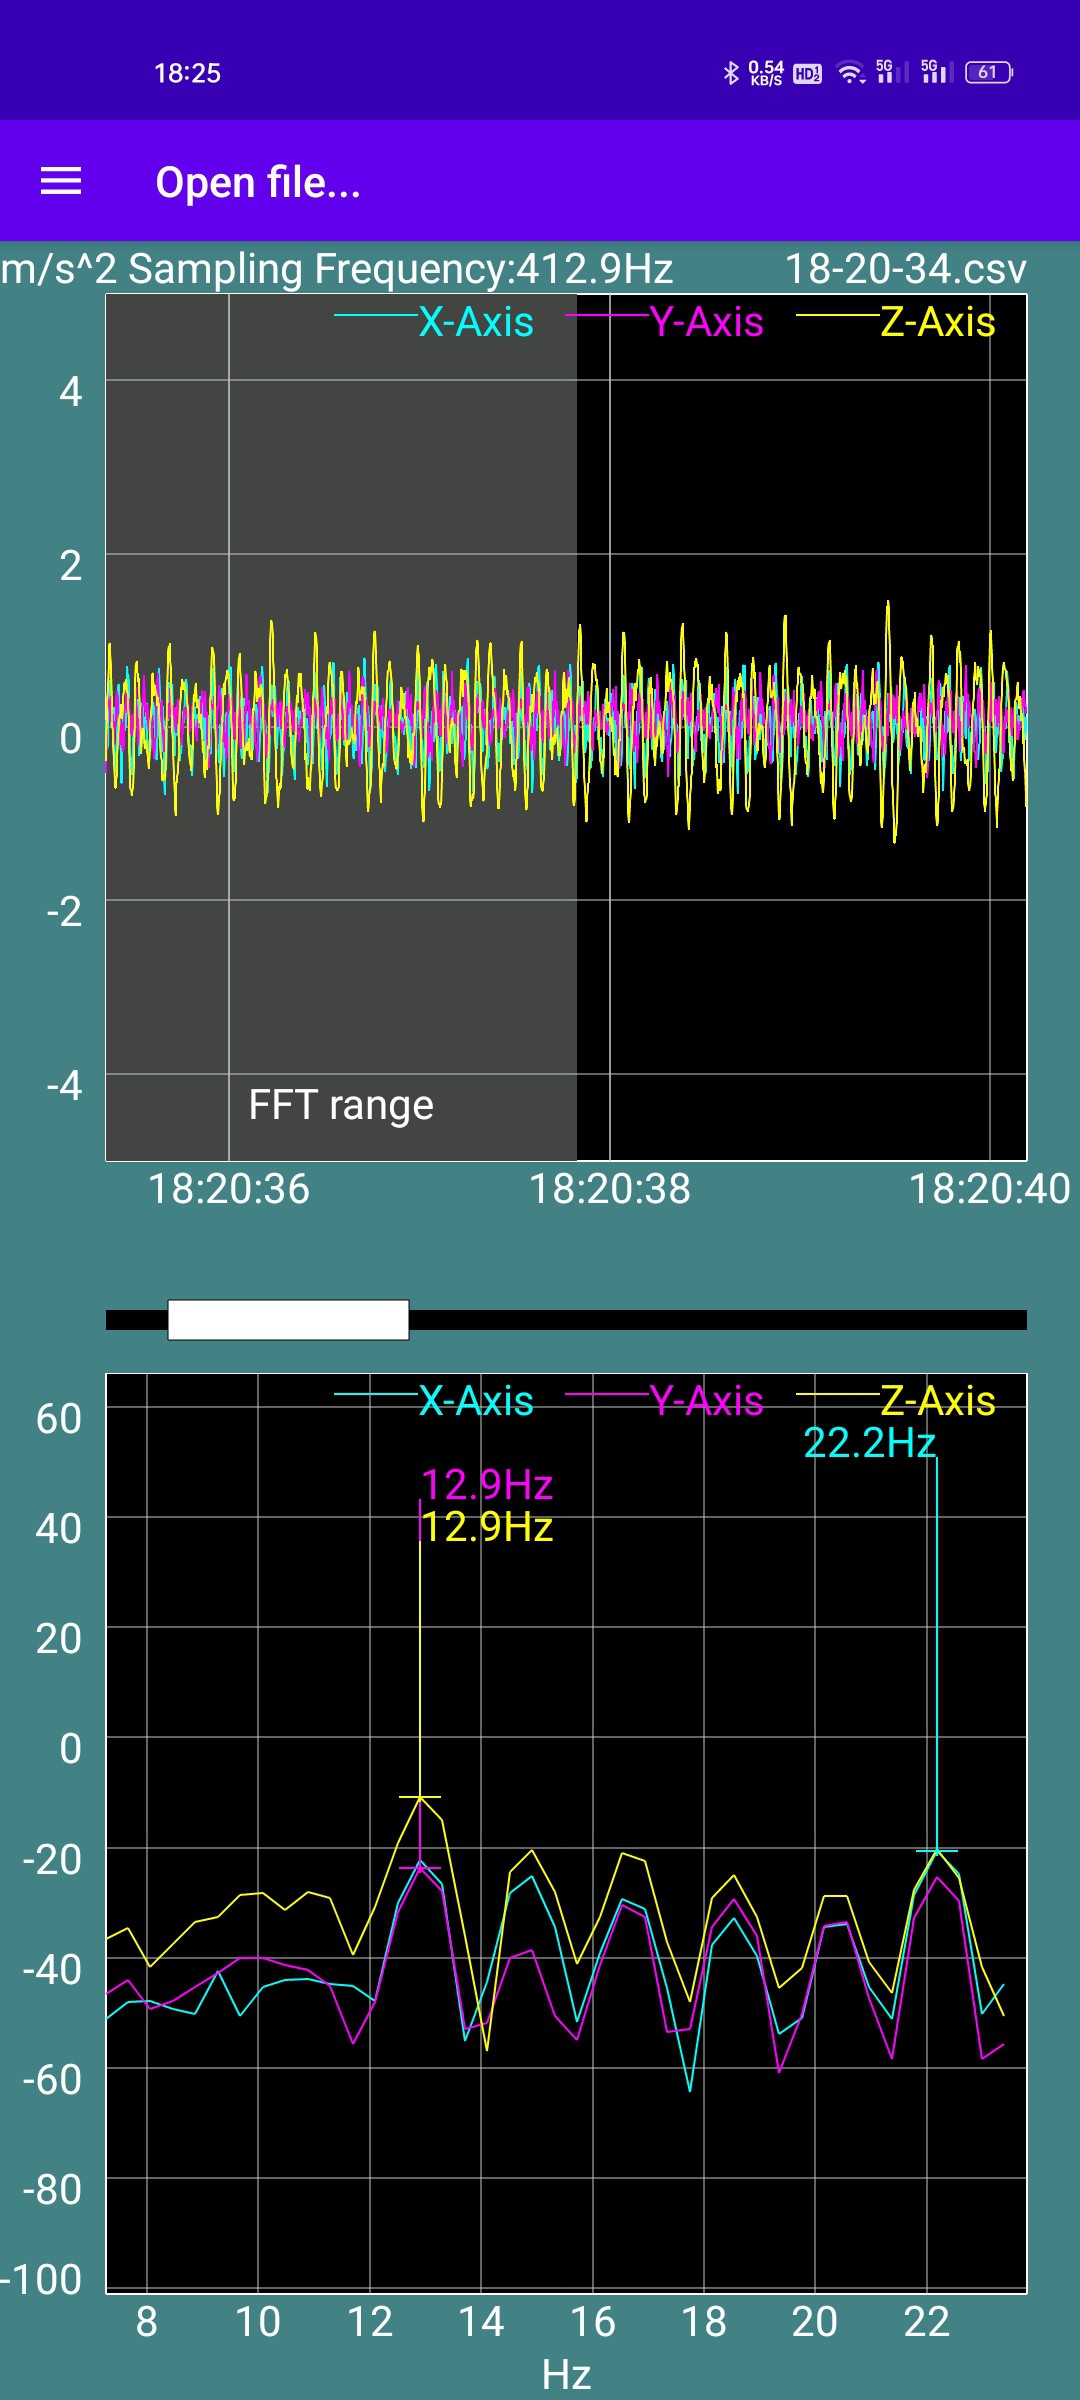 | 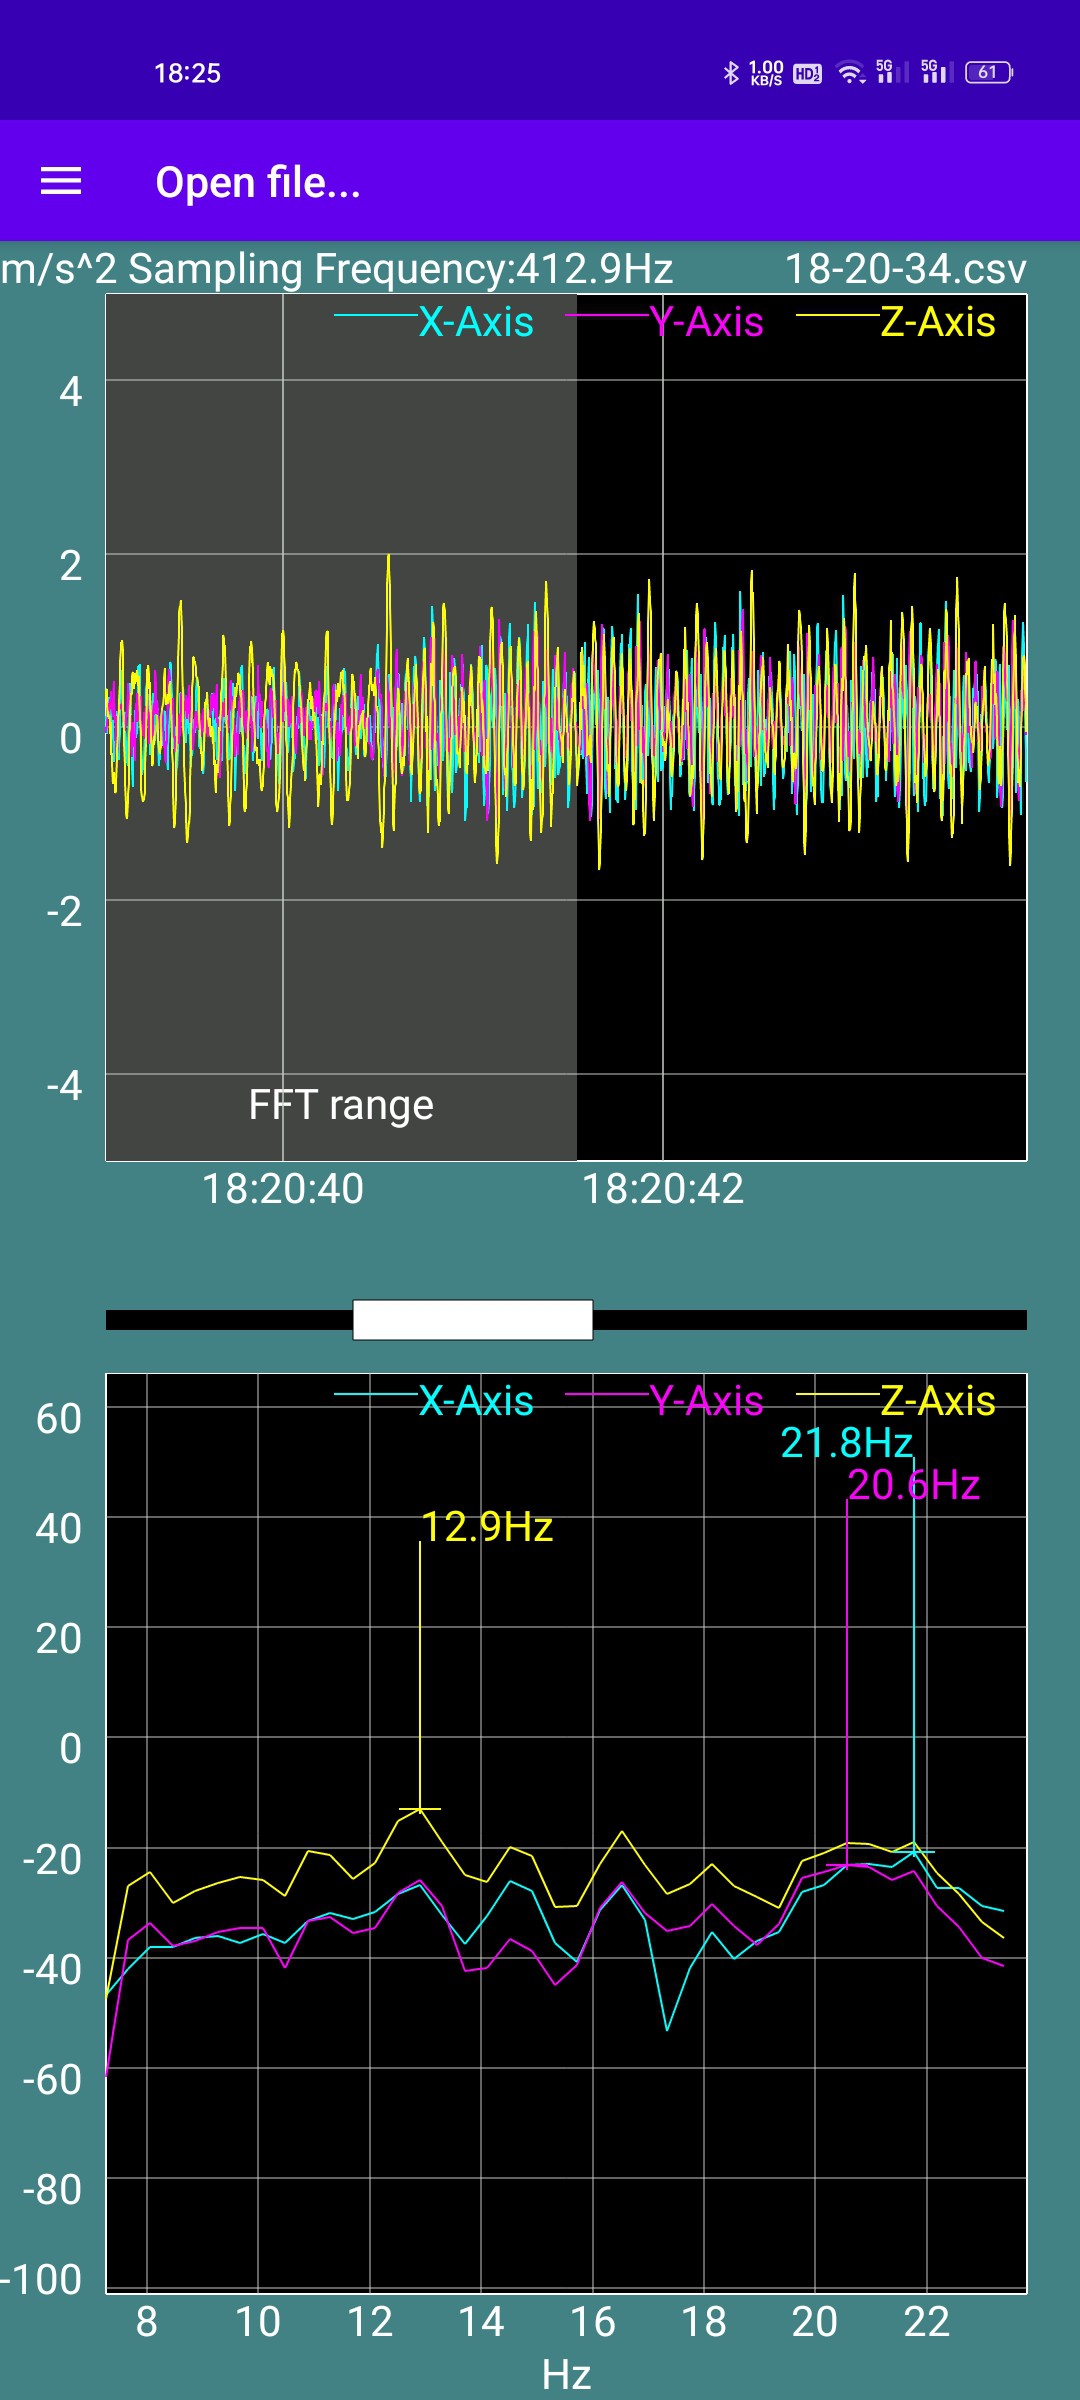 | 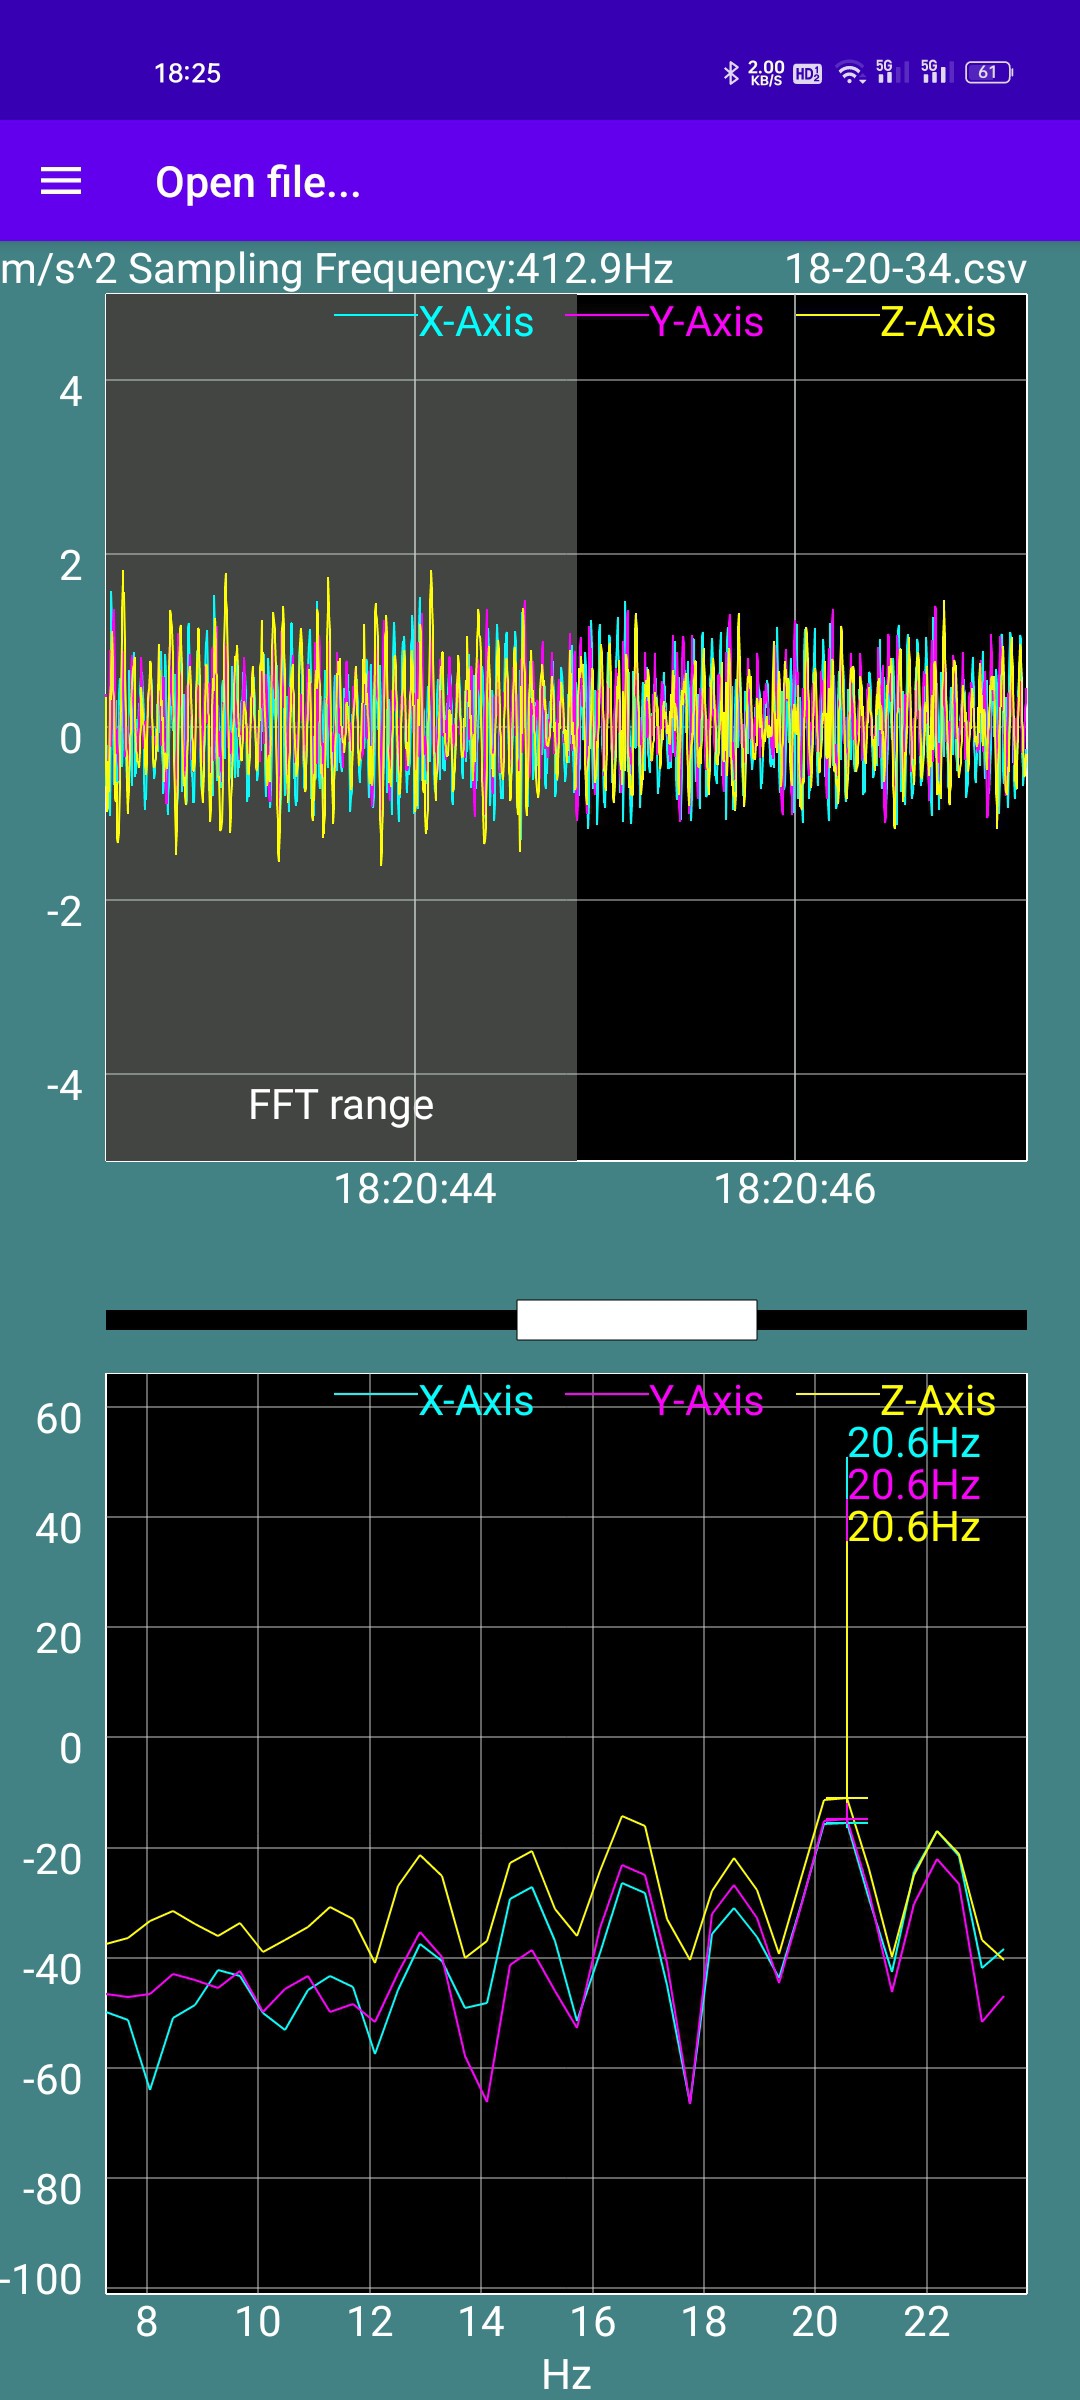 |
I also had to sweep through speed multipliers to confirm the real resonant frequency and not one that came about due to the coincidental timing of the swaying motion. For the Y axis, I was getting a 12.9Hz frequency at 100% but it would slowly disappear when reducing the speed multiplier. Meanwhile, the other candidate frequency would sweep in the range 18.9 - 21.0Hz. 77% speed produced the strongest vibrations.
The X axis was harder to determine since there were more options, with the most likely candidates being, in order: 44, 54, 35, 28Hz.
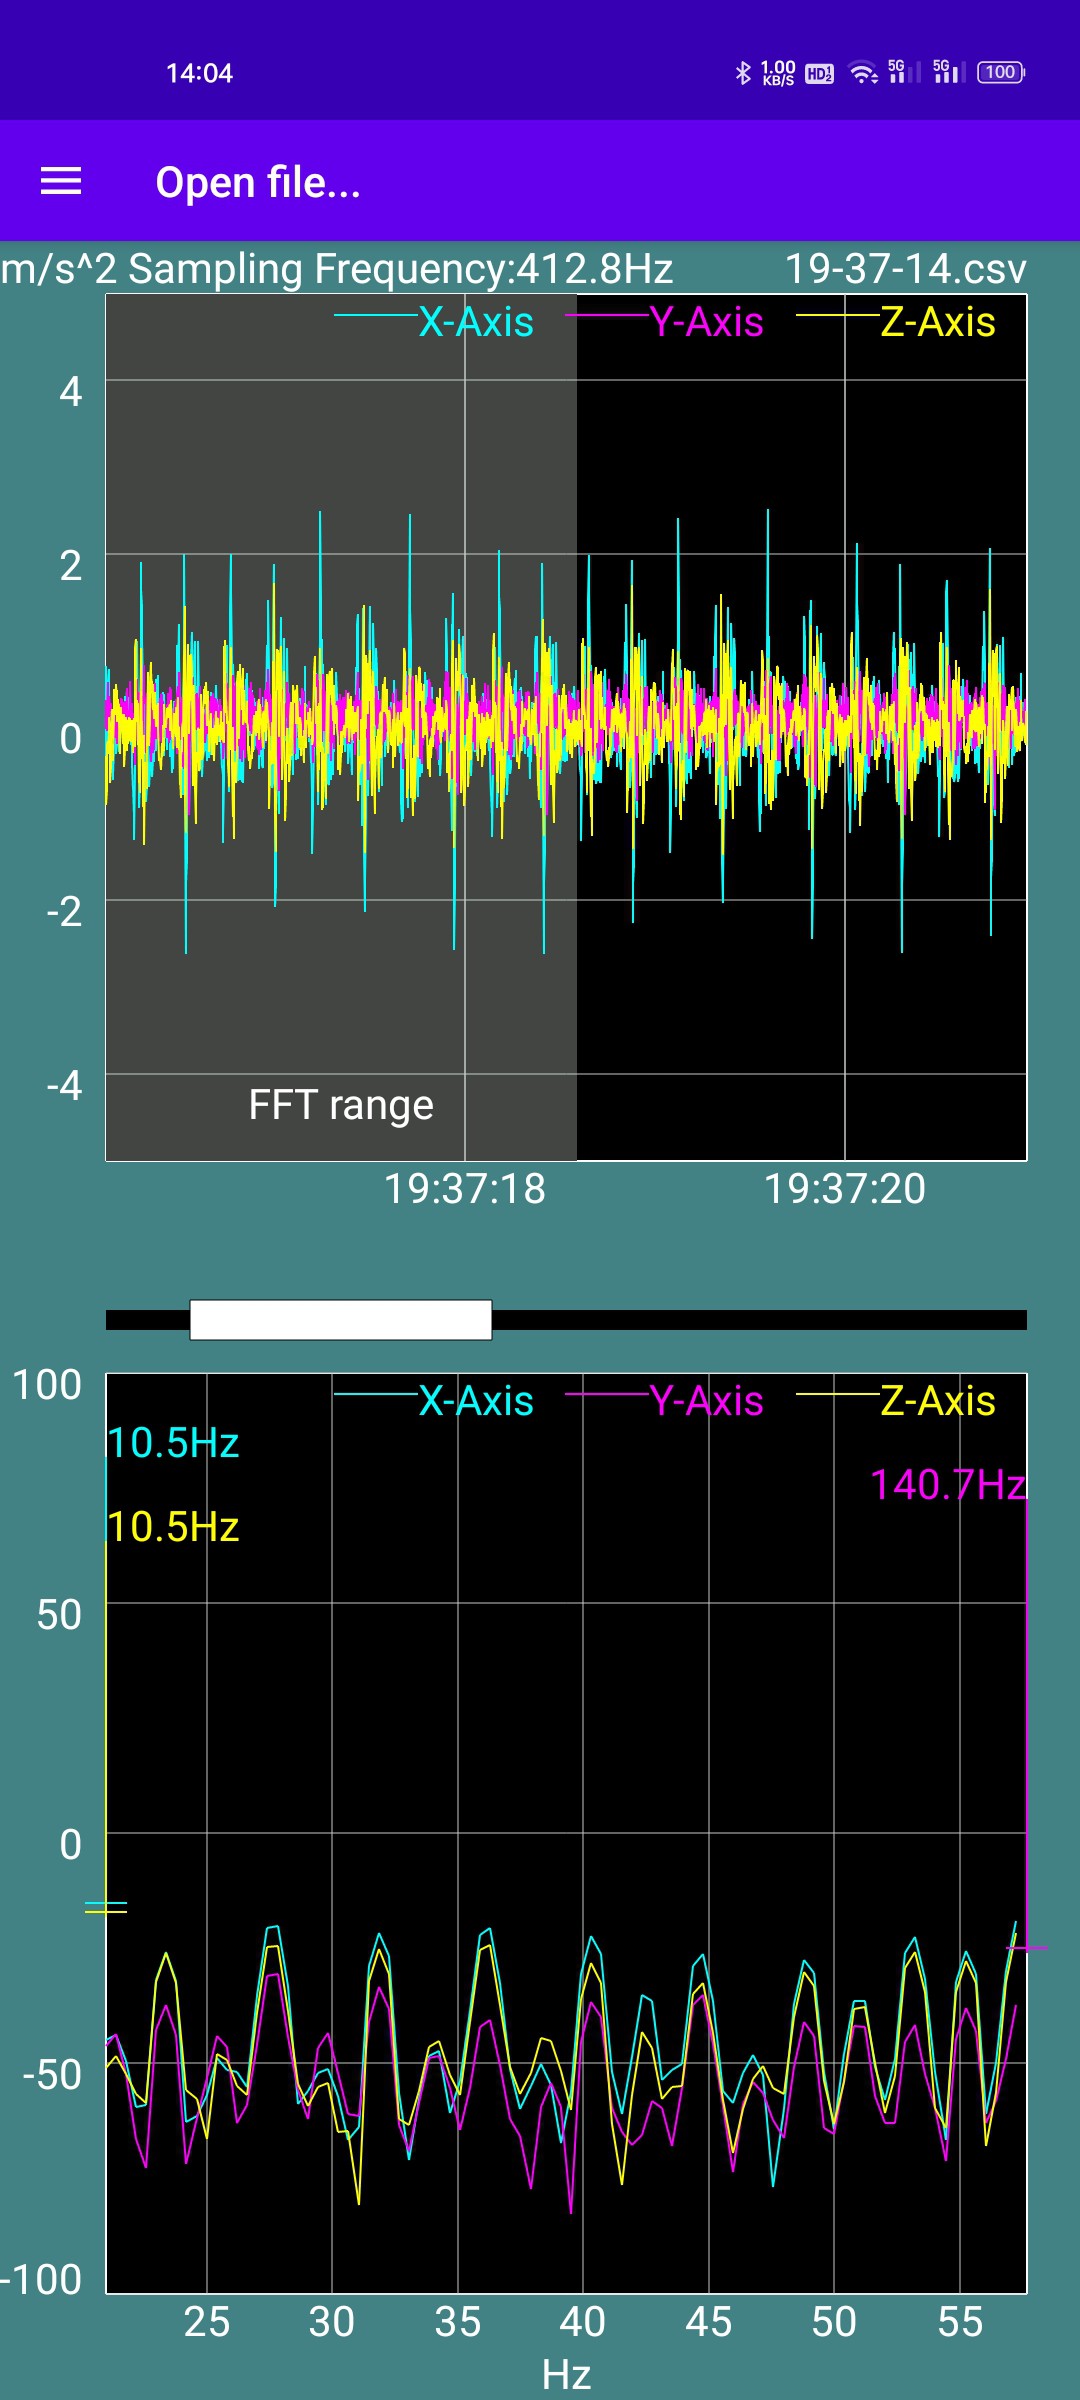
I underwent a process of elimination. I was bouncing around peaks and it didn't sound like 28Hz was going to be it. 54Hz was questionable when I was sweeping through the speed multiplier. The peak that moved between 42 - 45Hz sounded the best and still attenuated the 54 - 57Hz peak. Then the moment I found out about how to entirely disable shaping, the highest frequency shown was 42.6Hz, closely followed by 34.6Hz. I tried both and 42.6 was the better response.
A note on Junction Deviation tuning
My walls out of the corners looked better at Junction Deviation = 0.24, so I believe that the strategy for tuning is:
- set JD to max, which is 0.3
- tune max acceleration
- tune input shaping
- tune linear advance and E acceleration
- it was 1200mm/s2 for my BMG clones, which is understandable since it's geared 3 : 1.
- finally, lower JD (e.g. in steps of 0.06) till the reflections of the walls look straight and not wavy.
- They were low-frequency "waves", not the high frequency of typical ringing.
The goal is for JD to be high enough not to affect linear advance; corners looked bulged no matter if the printer was moving at 120mm/s or 20mm/s without it.
 kelvinA
Discussions
Become a Hackaday.io Member
Create an account to leave a comment. Already have an account? Log In.