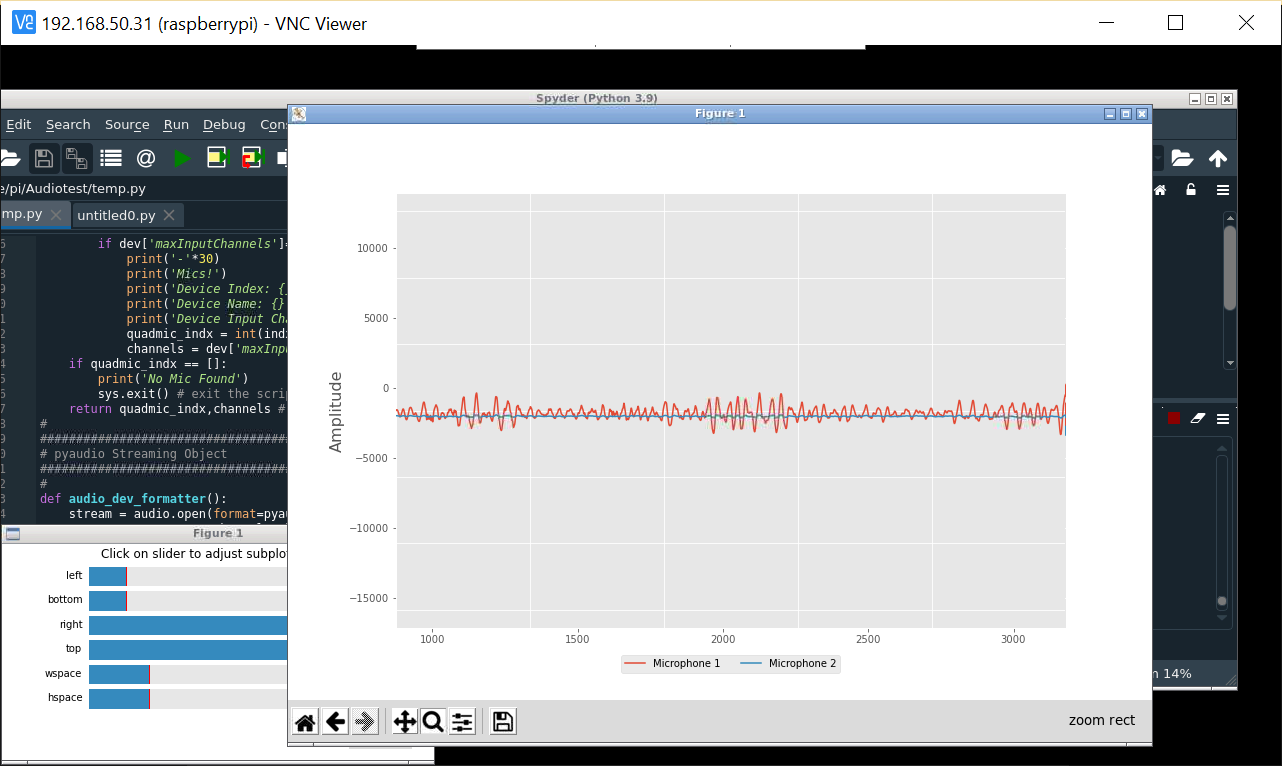
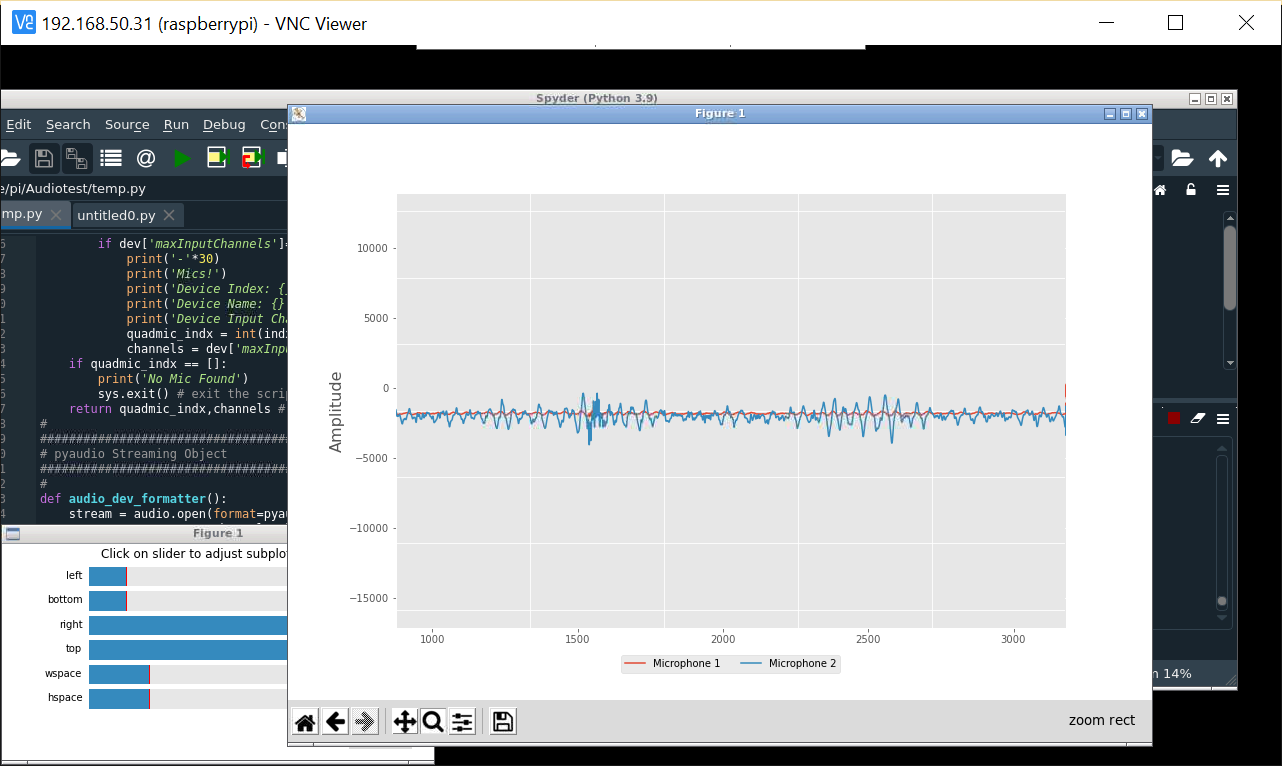
 This is the wave form of the sound captured by the microphones. Two colors, two channels, two microphone.
 So In the previous log, I talk about different python code that I struggled with. I finally succeed at plotting the wave form with the code that was made for Quadramicrophones. Here it is :
# -*- coding: utf-8 -*-
##############################################
# QuadMic Test for all 4-Microphones
# ---- this code plots the time series for all
# ---- four MEMS microphones on the QuadMic
# ---- attached to the Raspberry Pi
#
# -- by Josh Hrisko, Principal Engineer
#       Maker Portal LLC 2021
#

import pyaudio,sys,time
import matplotlib
matplotlib.use('TkAgg')
import numpy as np
import matplotlib.pyplot as plt
#
##############################################
# Finding QuadMic Device
##############################################
#
def indx_getter():
    quadmic_indx = []
    for indx in range(audio.get_device_count()):
        dev = audio.get_device_info_by_index(indx) # get device
        if dev['maxInputChannels']==2 :
            print('-'*30)
            print('Mics!')
            print('Device Index: {}'.format(indx)) # device index
            print('Device Name: {}'.format(dev['name'])) # device name
            print('Device Input Channels: {}'.format(dev['maxInputChannels'])) # channels
            quadmic_indx = int(indx)
            channels = dev['maxInputChannels']
    if quadmic_indx == []:
        print('No Mic Found')
        sys.exit() # exit the script if no QuadMic found
    return quadmic_indx,channels # return index, if found
#
##############################################
# pyaudio Streaming Object
##############################################
#
def audio_dev_formatter():
    stream = audio.open(format=pyaudio_format,rate=samp_rate,
                        channels=chans,input_device_index=quadmic_indx,
                        input=True,frames_per_buffer=CHUNK) # audio stream
    stream.stop_stream() # stop streaming to prevent overloa
    return stream
#
##############################################
# Grabbing Data from Buffer
##############################################
#
def data_grabber():
    stream.start_stream() # start data stream
    channel_data = [[]]*chans # data array
    [stream.read(CHUNK,exception_on_overflow=False) for ii in range(0,1)] # clears buffer
    for frame in range(0,int(np.ceil((samp_rate*record_length)/CHUNK))):
        if frame==0:
            print('Recording Started...')
        # grab data frames from buffer
        stream_data = stream.read(CHUNK,exception_on_overflow=False)
        data = np.frombuffer(stream_data,dtype=buffer_format) # grab data from buffer
        for chan in range(chans): # loop through all channels
            channel_data[chan] = np.append(channel_data[chan],
                                        data[chan::chans]) # separate channels
    print('Recording Stopped')
    return channel_data
#
##############################################
# functions for plotting data
##############################################
#
def plotter():
    ##########################################
    # ---- time series for all mics
    plt.style.use('ggplot') # plot formatting
    fig,ax = plt.subplots(figsize=(12,8)) # create figure
    ax.set_ylabel('Amplitude',fontsize=16) # amplitude label
    ax.set_ylim([-2**15,2**15]) # set 16-bit limits
    fig.canvas.draw() # draw initial plot
    ax_bgnd = fig.canvas.copy_from_bbox(ax.bbox) # get background
    lines = [] # line array for updating
    for chan in range(chans): # loop through channels
        chan_line, = ax.plot(data_chunks[chan],
                label='Microphone {0:1d}'.format(chan+1)) # initial channel plot
        lines.append(chan_line) # channel plot array
    ax.legend(loc='upper center',
              bbox_to_anchor=(0.5,-0.05),ncol=chans) # legend for mic labels
    fig.show() # show plot
    return fig,ax,ax_bgnd,lines

def plot_updater():
    ##########################################
    # ---- time series and full-period FFT
    fig.canvas.restore_region(ax_bgnd) # restore background (for speed)
    for chan in range(chans):
        lines[chan].set_ydata(data_chunks[chan]) # set channel data
        ax.draw_artist(lines[chan]) # draw line
    fig.canvas.blit(ax.bbox) # blitting (for speed)
    fig.canvas.flush_events() # required for blitting
    return lines
#
##############################################
# Main Loop
##############################################
#
if __name__=="__main__":
    #########################
    # Audio Formatting
    #########################
    #
    samp_rate      = 16000 # audio sample rate
    CHUNK          = 4000 # frames per buffer reading
    buffer_format  = np.int16 # 16-bit for buffer
    pyaudio_format = pyaudio.paInt16 # bit depth of audio encoding

    audio = pyaudio.PyAudio() # start pyaudio device
    quadmic_indx,chans = indx_getter() # get QuadMic device index and channels

    stream = audio_dev_formatter() # audio stream

    record_length = 0.1 # seconds to record
    data_chunks = data_grabber() # grab the data
    fig,ax,ax_bgnd,lines = plotter() # establish initial plot

    while True:
        data_chunks = data_grabber() # grab the data
        lines = plot_updater() # update plot with new data
So I change the original code to be used with 2 microphones. The code allows you to record live. You have to run it on the raspberry desktop via spyder. My issues was that it didn't plot anything and then spyder displayed multiple imports errors. I had already installed the library needed, but I imported them with pip instead of pip3 since I'm running python3. After the import problems were solved, the chart showed up but with no signals. Then the times that I was running the code again nothing was showing and spyder told me that the raspberry was busy. So it's seems like every time I am using node red or spyder the raspberry is said busy but I can't find a way to stream the sound on a terminal.
Anyway later on when I was desperate and retrying everything that I tryied so far, I found out that I can stream with this code just one time every-time the Raspberry is on else it display errors. I also realize that the plotting scale is to high and that I have to put the sound source close to the microphones.
The next step would be to re-calibrate the scale, find a way to amplify the sound with the code and finally reduce the sound live.
Discussions
Become a Hackaday.io Member
Create an account to leave a comment. Already have an account? Log In.