pammyleong
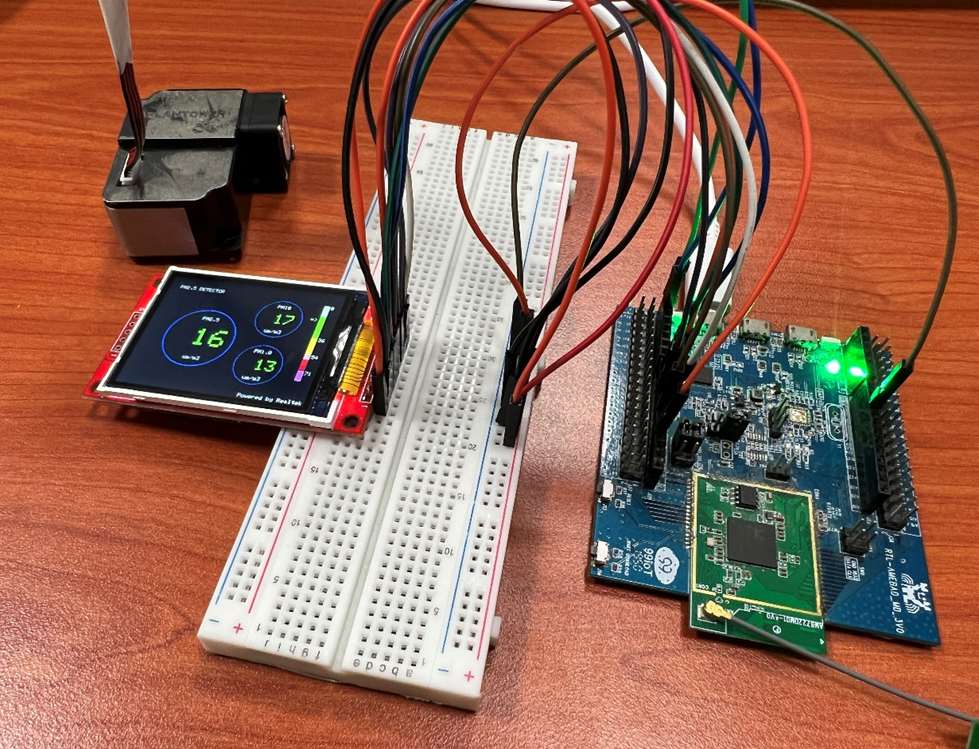
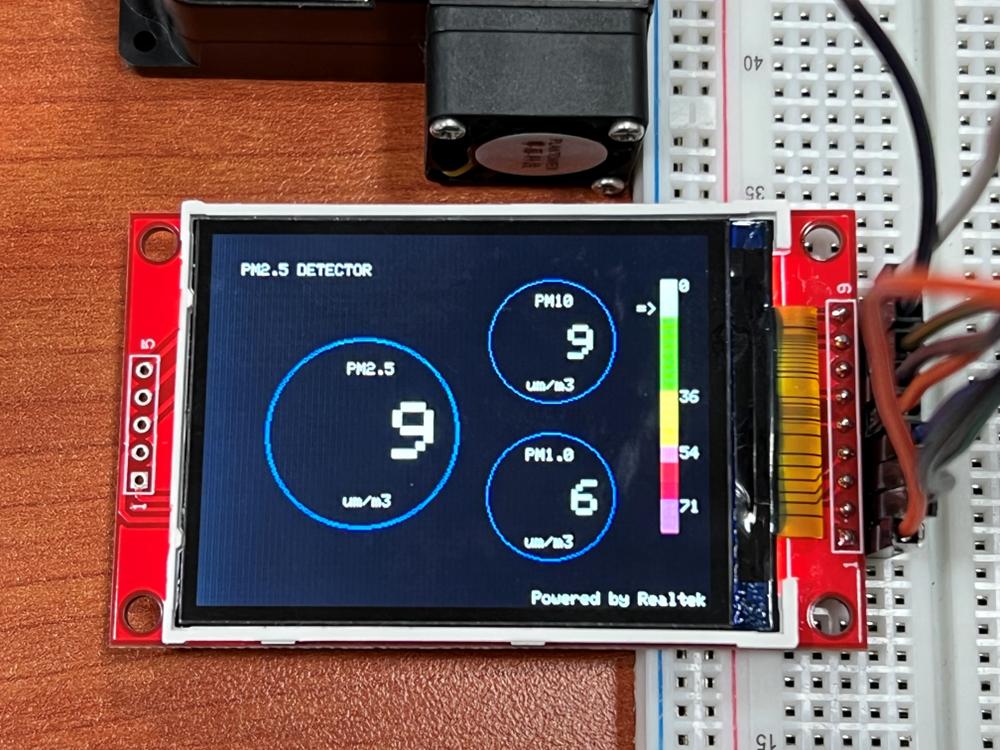
In this example, first rotate the screen by 90 degrees, and draw the static components such as the circles, the measuring scale, and the title text. After the concentration value is detected, it is printed inside the circle.
0%
0%
SPI – Show PM2.5 Concentration on ILI9341 TFT LCD
This example extends previous PM2.5 example to show the PM2.5 concentration on the LCD.
Become a Hackaday.io member
Already have an account? Log in.
Just one more thing
To make the experience fit your profile, pick a username and tell us what interests you.
Pick an awesome username
hackaday.io/
Your profile's URL: hackaday.io/username. Max 25 alphanumeric characters.
Pick a few interests
Projects that share your interests
People that share your interests
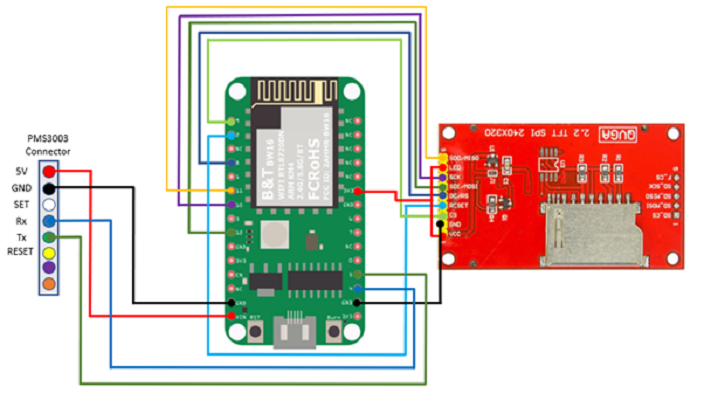
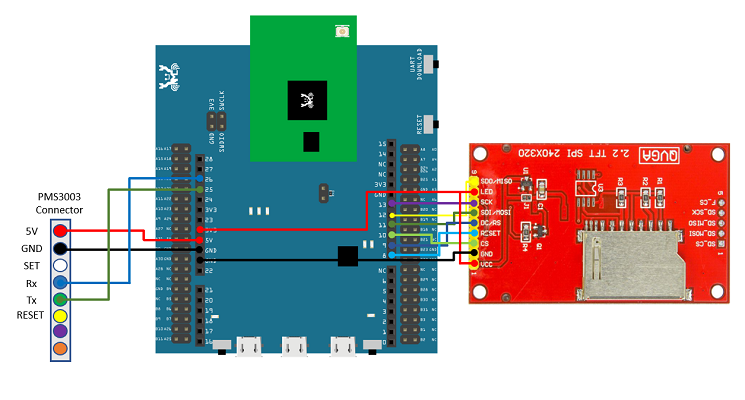 AMB23 and QVGA TFT LCD:
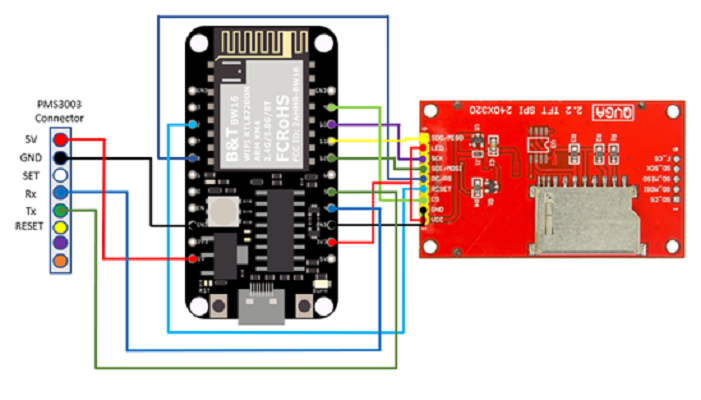
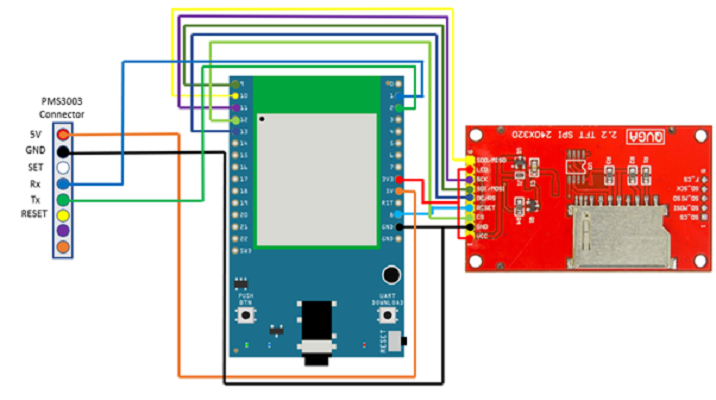 BW16 and QVGA TFT LCD: