 Denys Zaikin
Description and requirements
- Initially, the task was to be able to use open Wi-Fi networks that are placed far away and have weak signal levels.
- The antenna either should have been small or portable or could be assembled/disassembled.
- F=2.45 GHz but possibly also F=5..6 GHz. Wi-Fi and Bluetooth should be covered.
- The receiver should not be placed so far away from the antenna for practical use. Focus distance r=50 cm for 2.45 GHz. r=120 cm for 5.9 GHz.
- The diameter of the antenna should be no more than 70cm for practical use. D=70cm.
- We assume that the source is placed at an infinite distance.
- The antenna design is a metal ring with an external radius = of 0.35m and an internal radius = of 0.247m.
- Not tested with a real Wi-Fi signal yet, only spectrum analyzer result so far.
Fresnel zone antenna
- During simulation, it found that for focus distance f=50 cm and diameter of antenna D=70cm, the optimal gain is achieved using only shielding (shading) second Fresnel zone.
- Thus, all zones are open except the second one.
- Such configuration can give an amplitude gain 3.0 (9.5 dB).
Vector diagram for gain calculation:

Calculation
For 2.45 Ghz

For 5.5GHz

Simulation
Setup
- OptiFDTD simulation SW, https://optiwave.com/resources/academia/free-fdtd-download/
- OptiFDTD gives the result in DFT (digital Fourier transform).
Simulation setup in optiFDTD:

Simulation setup in optiFDTD with plane wave source:

Results – plane incident wave
F=2.45GHz
Result at receiver:

Result along the Z-axis:

Field magnitude along the Z-axis:

Peak position around f=46mm (96mm-50mm):

Conclusion
- A gain of around 2.8 (9.0 dB) can be expected for F=2.45GHz.
- For F=2.45GHz focus distance f=46 mm where the field is maximum.
F=2.45GHz with the presence of a tablet pc or smartphone at the focus
Setup with the presence of a tablet pc at the focus:

Simulation with the presence of a smartphone or tablet pc at the focus:


Conclusion
- Seems like presence of smartphone/tablet pc does not affect the gain a lot.
- Some standing waves can be seen at the antenna of the receiver but the field strength is still high.
- Should be tested with the spectrum analyzer.
F=5.9 GHz
Result along the Z-axis:

Field magnitude along the Z-axis:

Conclusion
- A gain of around 2.8 (9.0 dB) can be expected for F=5.9GHz.
- For F=5.9 GHz focus distance f=120+ mm where the field is maximum.
Results – simulation with the point source at the far field
Setup
Setup with points source:

F=2.45 Ghz
Comparison at a far distance and point source simulation:

Far-field comparison without and with antenna:

Far-field comparison without and with antenna:

Conclusion
- A gain of around 2.8 (9.0 dB) can also be seen with far-field simulation.
- It also proves that the antenna will work in both modes: receiver and transmitter. It is also theoretically proved by the reciprocity principle.
PCB design
- Thus, the antenna design is a metal ring with an external radius = 0.35m and an internal radius = 0.247m.
- For portability, the ring is split into 8 pieces, so the antenna can be assembled and disassembled.
- PCB design has only one metal layer (TOP).
PCB design:


Assembly
- Parts should be connected using interleaving – one part normal, one part upside down,
- In this case, the metal layers (TOP) touch each other directly.
- Such a connection also helps to compensate for the curvature of each PCB.
Two parts connection:

Antenna assembled:


Test results
Setup
- Beacon with spread spectrum as a source at the distance of about 40m.
- Loop H near field probe as a receiver.
- FLP1003 spectrum analyzer.
Measurement at receiver point:

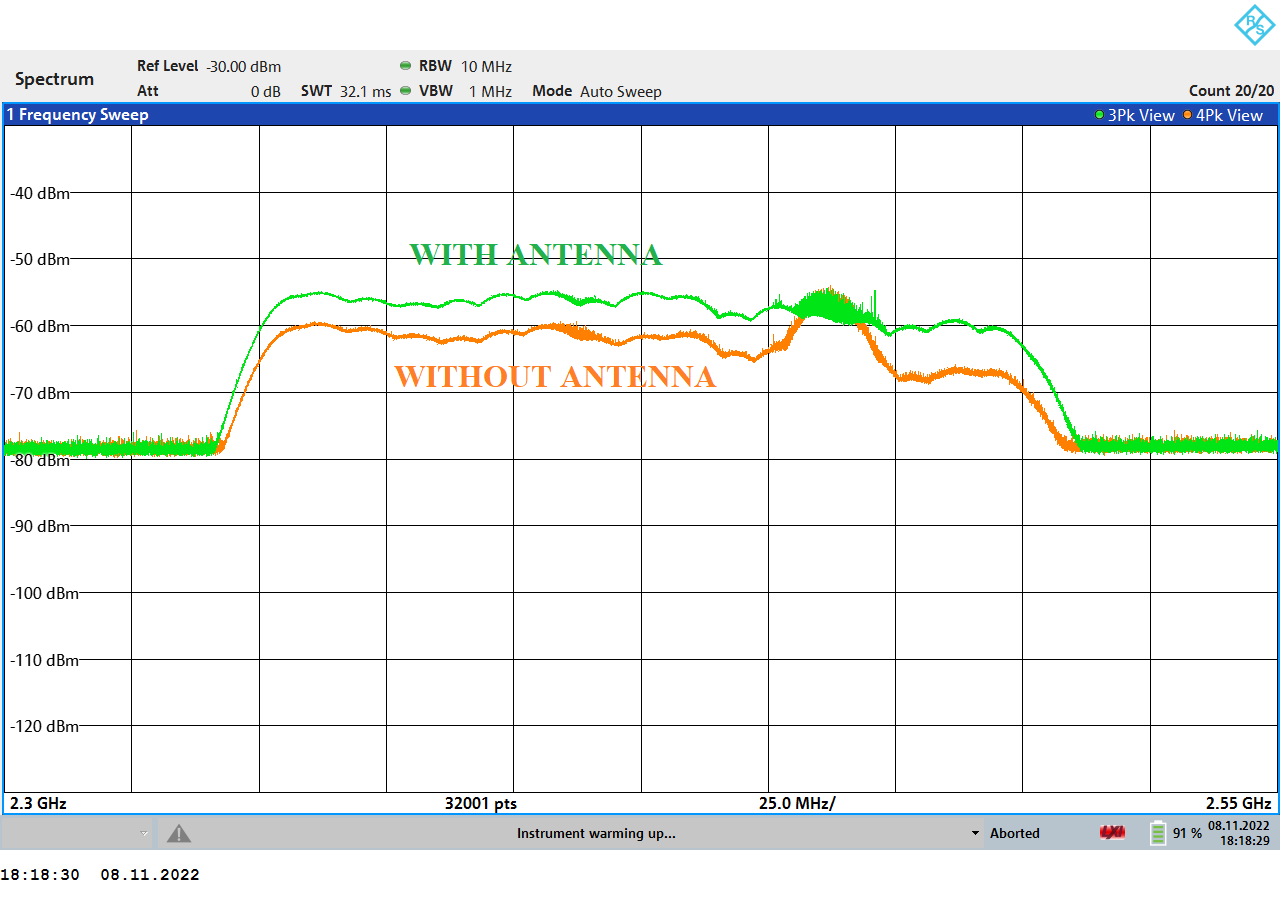
Measurement results
- The following pictures show difference with and without the antenna presented.
- Case with antenna shows a higher signal level (5...10 dB gain).
- Receiving probe moved +-5cm from r=50.0 cm.
Measurement at spectrum analyzer:


Conclusion
- The presented antenna can theoretically be used as an antenna for WiFi and Bluetooth.
- Seems like antenna gain is close to simulated (9.0dB) and measured as 5...10 dB.
- Should be measured with real weak WiFi signal receiving.
Notes on practical using
- The source of the signal (WiFi or Bluetooth) should be known.
- The placement of the antenna on the tablet PC or smartphone should be known.
- Around the antenna, there should be some space free of obstacles to avoid shading of the rest of the Fresnel zones.