Update
Here are the main updates since my last project log
- A new version of the measurement device (V2)
- Process python library
- GitHub page with complete details about the project (only for v2): I added the link to the project page. Complementary information is available on the README page.
Goal
There were two goals in this update
- Share the current status of the project on GitHub
- Being able to take reliable measurements in my car easily with a single unit device (instead of having a laptop + cellphone).
Measuring device v2

The main changes are enumerated below:
- Combine IMU and GPS data capture IMU sampling > 100hz
- GPS sampling at 1 Hz
- Standalone saving on an SD card (No computer required anymore)
- Device powered by USB external battery
- Button to stop and start a capture with LED indicator (saving & error status)
FPS
The FPS of both sensor GPS and IMU was improved compared with V1
GPS is now capturing at 1 fps. The previous version used to stop when the car was stopped (as per the application that was used in V1)
IMU fps is not stable but it is 99% higher than 100Hz.
Process
In V1 the process of the data was simply done in a Jupyter notebook. This is easy to use for developing new features and testing hypotheses, but not as useful when coming the time to process a larger volume of data.
For V2, I developed a small library to automatically process my data. I am not 100% sure yet about the full architecture of the library. I spent quite some time thinking about what should be the main class. After some time, I decided to put my current idea on VScode and agree on improving as I gather more data and get a better view of what should be the main class and function. The figure below depicts the current architecture of the library.
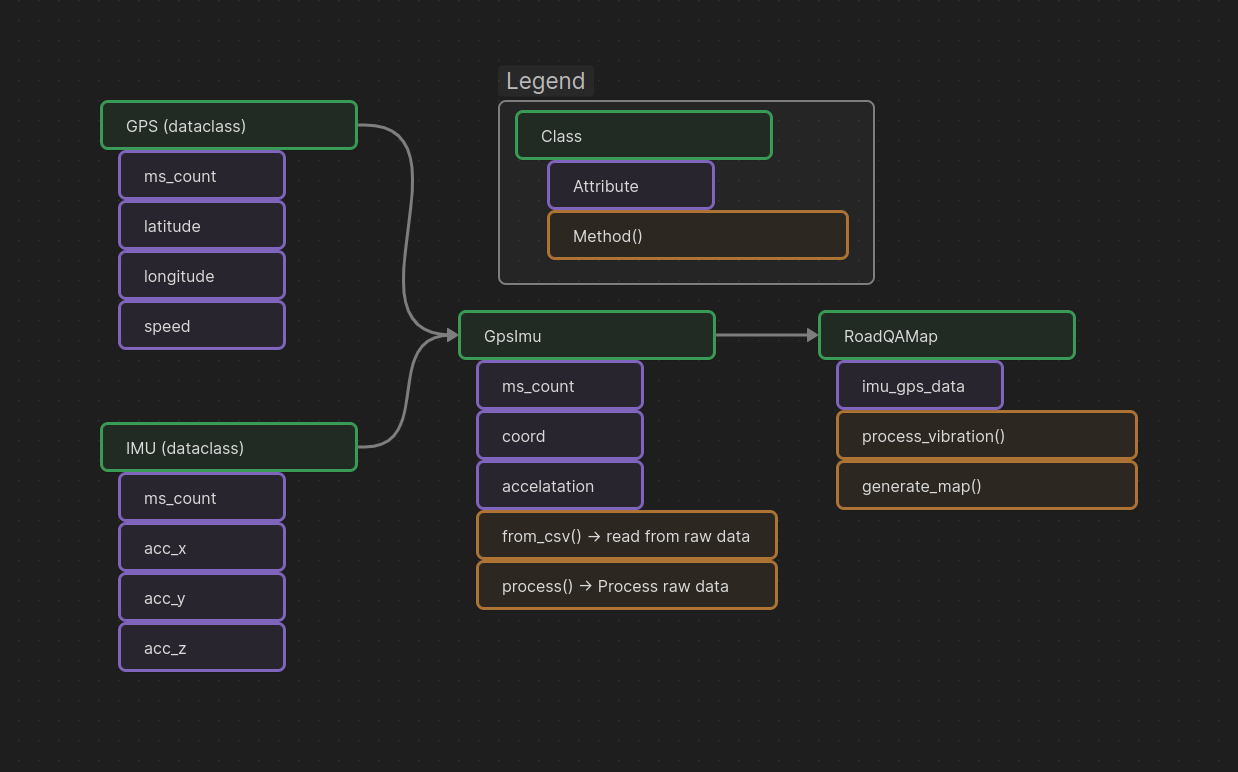
There are mainly four classes that are used by the entry point `roadqa_process` to generate a map:
- GPS: Data class for GPS data point
- IMU: Data class for IMU data point
- GpsImu: Aggregate a list of IMU and GPS data points and process them minimally and align them on the same time axis
- RoadQAMap: Process the vibration metric and display it on a map
The logic behind the process of v2 is the same as V1. There are essentially three factors to control the process:
- Sensibility: Control how sensible the post-process is too small vibration
- Threshold: Control the minimum perceptible vibration
- Contrast: Control the contrast between low and large vibration
Process improvement
I didn't have that much time to improve the process as I intended to, but I have a few ideas to improve the process:
- Modulate the vibration metric with the speed of the car. For example, the vertical acceleration will oscillate more if the car hit a pothole at higher speed.
- For now, most of the analysis is done in the spatial domain. I had the idea of using a spectrogram (Frequency domain). I generated the spectrogram data for the sample data but didn't figure out a way yet to extract relevant information.
Result
To validate the functionality of V2, I did a similar capture and analysis as in V1. I drove along a path and noted the outstanding good (2) and bad (1, 3) sections of the road. The figure below depicts the vibration metric along the path with some photos extracted from the latest google street view that show the condition of the road side by side with the vibration metric.

Next step
- Improve device setup: Right now there is several wire and no box to contain the full device. I want to print a 3D box for the full device to make it easier to transport.
- Improve data post-process and robustness: I want to capture data along a specific path to see the variability of the data and optimize the post-process.
- Dash cam comparison: The state of the routes is changing quite fast and I would like to get a better comparison of road quality using a dash cam for the next analysis.
Discussions
Become a Hackaday.io Member
Create an account to leave a comment. Already have an account? Log In.