 Andrey Kalmatskiy
Argentum compiler builds a DWARF-compatible debug info, And it's all integrated with VSCode:
- Ctrl+Shift+B builds and runs release versions.
- F5 - starts debugging sessions.
So far it supports:
- Variable and class inspection (including lambda capture blocks)
- Call stack + intermediate frames' variables and code locations
- Breakpoints
- Stepping through code.
It has special handling for pointers to functions, lambdas and delegates, strings and limited support for arrays (it shows only 20 first elements).
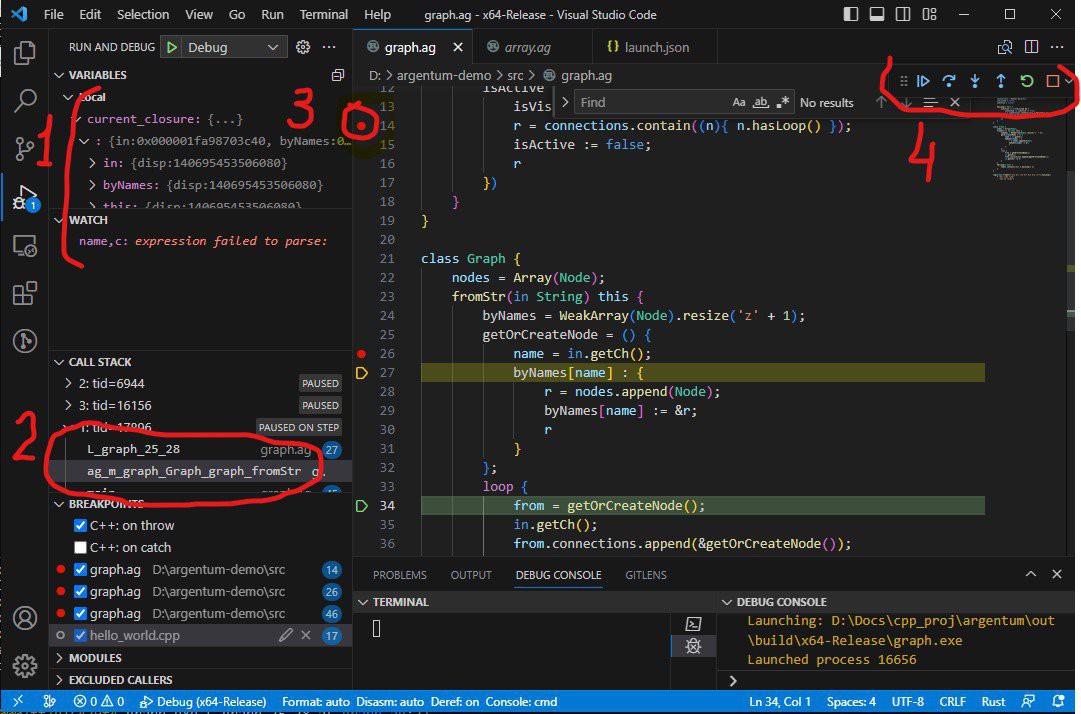
So far it shows only static type of object by pointers. As a temporary work-around you can use watch expressions with type casts (they can also be used to access any array elements beyond 20 elements boundary).
All details are here: https://aglang.org/argentum-debugger-v1/
Discussions
Become a Hackaday.io Member
Create an account to leave a comment. Already have an account? Log In.