 Guillermo Perez Guillen
- We already have all the data stored in the "PressureArray" matrix. Now our goal is to find these points where the Korotkoff sounds occur.
- I did a test, send and graph to excel all the points of the curve of my blood pressure to see the points where the Korotkoff sounds occur, and this is what I saw.

Detecting 10 Korotkoff sounds
Here you can get a tutorial to send the data to Excel: https://github.com/gsampallo/serialToExcel
And you can download my excel file at this link: Korotkoff_sounds_excel
- In the graph above I found ten Korotkoff sounds. I did an analysis and in all Korotkoff points I found the following two constants: 1) point b is greater than point a, and 2) point c is greater than point a.
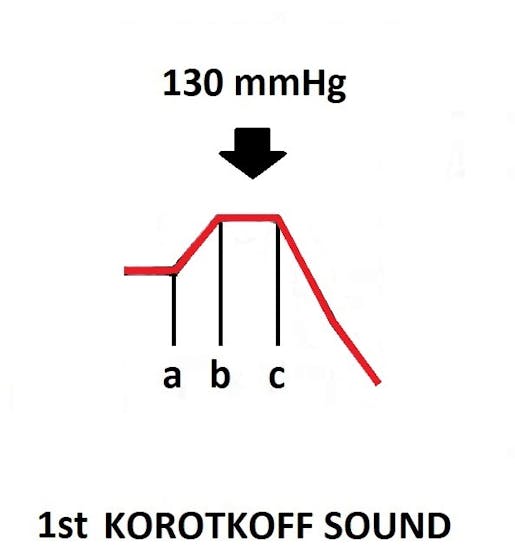
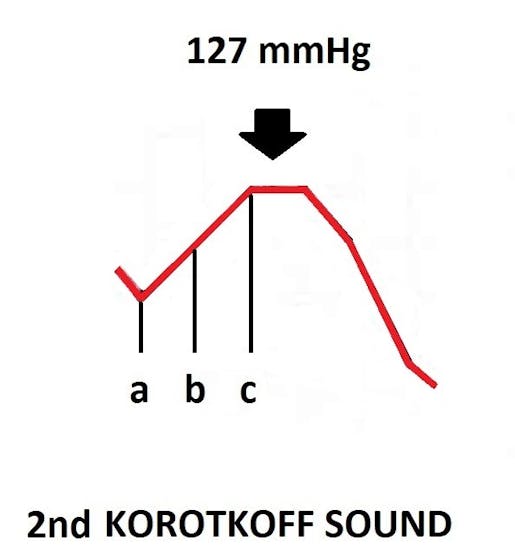
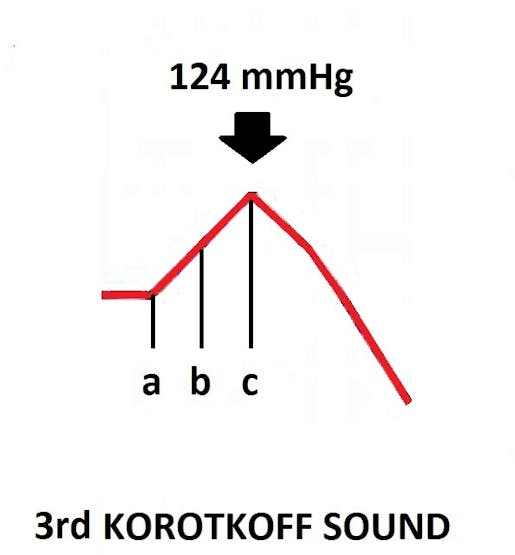
- Through a for loop I'm going to go through 130 records of the "PressureArray" matrix. Next, I assign the first record to the variable "var_a", the second record to the variable "var_b" and the third record to the variable "var_c".
- If the variables "var_b"> "var_a" and "var_c"> "var_a", then I print the variable "var_b" as Korotkoff sound.
- Any other combination I only delay 1 ms. and I don't print anything.
- According to the theory read at the beginning of this tutorial (sections 2 and 3), systolic pressure is the first Korotkoff sound, and diastolic pressure is the last Korotkoff sound.

Flowchart
for I in 1 .. 130 loop
            var_a := UInt32(PressureArray(I));
            var_b := UInt32(PressureArray(I+1));
            var_c := UInt32(PressureArray(I+2));

            if var_b > var_a and var_c > var_a then

               Print (0, Integer (inc), var_b, " mmHg-korot");
               inc := inc + 25;
               delay until Clock + Milliseconds (1);

            else

               delay until Clock + Milliseconds (1);

            end if;

         end loop;
Discussions
Become a Hackaday.io Member
Create an account to leave a comment. Already have an account? Log In.